1 Introduction. Blogs have become an important medium of communi- ... we found that blog posts do not have a bursty behavior; ..... from the top to the bottom.
Patterns of Cascading Behavior in Large Blog Graphs Jure Leskovec, Mary McGlohon, Christos Faloutsos Abstract How do blogs cite and influence each other? How do such links evolve? Does the popularity of old blog posts drop exponentially with time? These are some of the questions that we address in this work. Blogs (weblogs) have become an important medium of information because of their timely publication, ease of use, and wide availability. In fact, they often make headlines, by discussing and discovering evidence about political events and facts. Often blogs link to one another, creating a publicly available record of how information and influence spreads through an underlying social network. Aggregating links from several blog posts creates a directed graph which we analyze to discover the patterns of information propagation in blogspace, and thereby understand the underlying social network. Here we report some surprising findings of the blog linking and information propagation structure, after we analyzed one of the largest available datasets, with 45, 000 blogs and ≈ 2.2 million blog-postings. Our analysis also sheds light on how rumors, viruses, and ideas propagate over social and computer networks. 1 Introduction Blogs have become an important medium of communication and information on the World Wide Web. Due to their accessible and timely nature, they are also an intuitive source for data involving the spread of information and ideas. By examining linking propagation patterns from one blog post to another, we can infer answers to some important questions about the way information spreads through a social network over the Web. For instance, does traffic in the network exhibit bursty and/or periodic behavior? After a topic becomes popular, how does interest die off – linearly, or exponentially? In addition to temporal aspects, we would also like to discover topological patterns in information propagation graphs (cascades). We explore questions like: do graphs of information cascades have common shapes? What are their properties? What are characteristic inlink patterns for different nodes in a cascade? What can
∗
Natalie Glance, Matthew Hurst
†
we say about the size distribution of cascades? 1.1 Summary of findings and contributions Temporal patterns: For the two months of observation, we found that blog posts do not have a bursty behavior; they only have a weekly periodicity. Most surprisingly, the popularity of posts drops with a power law, instead of exponentially, that one may have expected. Surprisingly, the exponent of the power law is ≈-1.5, agreeing very well with Barabasi’s theory of heavy tails in human behavior [3]. Patterns in the shapes and sizes of cascades and blogs: Almost every metric we measured, followed a power law. The most striking result is that the size distribution of cascades (= number of involved posts), follows a perfect Zipfian distribution, that is, a power law with slope =-2. The other striking discovery was on the shape of cascades. The most popular shapes were the “stars”, that is, a single post with several in-links, but none of the citing posts are themselves cited. 2 Related work To our knowledge this work presents the first analysis of temporal aspects of blog link patterns, and gives detailed analysis about cascades and information propagation on the blogosphere. As we explore the methods for modeling such patterns, we will refer to concepts involving power laws and burstiness, social networks in the blog domain, and information cascades.
2.1 Burstiness and power laws Extensive work has been published on patterns relating to human behavior, which often generates bursty traffic. Disk accesses, network traffic, web-server traffic all exhibit burstiness. Wang et al in [19] provide fast algorithms for modeling such burstiness. Burstiness is often related to self-similarity, which was studied in the context of World Wide Web traffic [5]. Vazquez et al [18] demonstrate the bursty behavior in web page visits and corresponding response times. Self-similarity is often a result of heavy-tailed dynamics. Human interactions may be modeled with ∗ School of Computer Science, Carnegie Mellon University, networks, and attributes of these networks often follow power law distributions [6]. Such distributions Pittsburgh, PA. † Neilsen
Buzzmetrics, Pittsburgh, PA.
have a PDF (probability density function) of the form p(x) ∝ xγ , where p(x) is the probability to encounter value x and γ is the exponent of the power law. In loglog scales, such a PDF gives a straight line with slope γ. For γ < −1, we can show that the Complementary Cumulative Distribution Function (CCDF) is also a power law with slope γ+1, and so is the rank-frequency plot pioneered by Zipf [21], with slope 1/(1 + γ). For γ = −2 we have the standard Zipf distribution, and for other values of γ we have the generalized Zipf distribution. 2.2 Blogs Most work on modeling link behavior in large-scale on-line data has been done in the blog domain [1, 2, 12]. The authors note that, while information propagates between blogs, examples of genuine cascading behavior appeared relatively rare. This may, however, be due in part to the Web-crawling and text analysis techniques used to infer relationships among posts [2, 10]. Our work here differs in a way that we concentrate solely on the propagation of links, and do not infer additional links from text of the post, which gives us more accurate information. There are several potential models to capture the structure of the blogosphere. Work on information diffusion based on topics [10] showed that for some topics, their popularity remains constant in time (“chatter”) while for other topics the popularity is more volatile (“spikes”). Authors in [12] analyze community-level behavior as inferred from blog-rolls – permanent links between “friend” blogs. Authors extended this work in [13] to analysis of several topological properties of link graphs in communities, finding that much behavior was characterized by “stars”. Analysis based on thresholding as well as alternative probabilistic models of node activation is considered in the context of finding the most influential nodes in a network [11], and for viral marketing [17]. Such analytical work posits a known network, and uses the model to find the most influential nodes. 2.3 Information cascades Information cascades are phenomena in which an action or idea becomes widely adopted due to the influence of others, typically, neighbors in some network [4, 8, 9]. Cascades on random graphs using a threshold model have been theoretically analyzed [20]. Empirical analysis of the topological patterns of cascades in the context of a large product recommendation network is in [16] and [14]. 3
Preliminaries
In this section we introduce terminology and concepts regarding the blogosphere and information cascades. Blogs (weblogs) are web sites that are updated on a
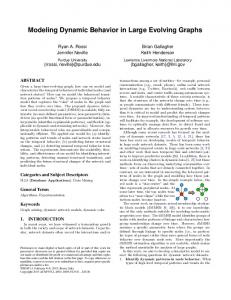
regular basis. Blogs have the advantage of being easy to access and update, and have come to serve a variety of purposes. Often times individuals use them for online diaries and social networking; other times news sites have blogs for timely stories. Blogs are composed of posts that typically have room for comments by readers – this gives rise to discussion and opinion forums that are not possible in the mass media. Also, blogs and posts typically link each other, as well as other resources on the Web. Thus, blogs have become an important means of transmitting information. The influence of blogs was particularly relevant in the 2004 U.S. election, as they became sources for campaign fundraising as well as an important supplement to the mainstream media [1]. Understanding the ways in which information is transmitted among blogs is important to developing concepts of present-day communication. We model two graph structures emergent from links in the blogosphere, which we call the Blog network and the Post network. Figure 1 illustrates these structures. Blogosphere is composed of blogs, which are further composed of posts. Posts then contain links to other posts and resources on the web. From Blogosphere (a), we obtain the Blog network (b) by collapsing all links between blog posts into directed edges between blogs. A blog-to-blog edge is weighted with the total number of links where a post in source blog point to a post in destination blog. From the Blog network we can infer a social network structure, under the assumption that blogs that are “friends” link each other often. In contrast, to obtain the Post network (c), we ignore the posts’ parent blogs and focus on the link structure. Associated with each post is the date of the post, so we label the edges in Post network with the date difference ∆ > 0 between the source and the destination posts. Let tu and tv denote post times of posts u and v, where u links to v, then the link time ∆ = tu − tv . From the Post network, we extract information cascades, which are induced subgraphs by edges representing the flow of information. A cascade (also known as conversation tree) has a single starting post called the cascade initiator with no out-links to other posts (e.g. nodes a, b, c, d in Figure 1(c)). Posts then join the cascade by linking to the initiator, and subsequently new posts join by linking to members within the cascade. Figure 2 gives a list of cascades extracted from Post network in Figure 1(c). Since a link points from the follow-up post to the existing (older) post, influence propagates following the reverse direction of the edges. We define a non-trivial cascade to be a cascade containing at least two posts. Therefore, a trivial cascade is an isolated post. Figure 2 shows all non-
B1
B2
B1
a
1 1
B2
1 1
B3
B4 (a) Blogosphere
B3
b
c
2
d
3
B4
e
(b) Blog network
(c) Post network
Figure 1: The model of the blogosphere (a). Squares represent blogs and circles blog-posts. Each post belongs to a blog, and can contain hyper-links to other posts and resources on the web. We create two networks: a weighted blog network (b) and a post network (c). Nodes a, b, c, d are cascade initiators, and node e is a connector.
e
60000
a
e
Sept 29 50000 Aug 1 Number of posts
d
b
c
40000 30000 20000 Jul 4 10000
Figure 2: Cascades extracted from Figure 1. Cascades represent the flow of information through nodes in the network. To extract a cascade we begin with an initiator with no out-links to other posts, then add nodes with edges linking to the initiator, and subsequently nodes that link to any other nodes in the cascade.
0 0
10
20
30
40 50 Time [1 day]
60
70
80
90
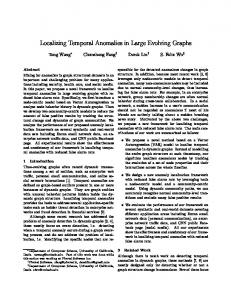
Figure 3: Number of posts by day over the three-month period.
tracing back into July to avoid a “missing past”). There are 245, 404 links among the posts of our dataset. trivial cascades in Figure 1(c), but not the two trivial cascades. Cascades form two main shapes, which we refer to as stars and chains. A star occurs when a single center post is linked by several other posts, but the links do not propagate further. This produces a wide, shallow tree. Conversely, a chain occurs when a root is linked by a single post, which in turn is linked by another post. This creates a deep tree that has little breadth. As we will later see most cascades are somewhere between these two extreme points.
4.2 Data preparation and cleaning Before analysis, we cleaned the data to most clearly represent the structures of interest. In essence: We first reduced time resolution to one day. We also removed edges pointing to webpages outside the dataset and to posts supposedly written in the future. Finally, we removed links where a post pointed to itself (although a link to a previous post in the same blog was allowed). A full explanation of data cleaning may be found in [15].
4 Experimental setup 4.1 Dataset description We extracted our dataset from a larger set of blogs and posts from August and September 2005 [7]. We are interested in blogs and posts that actively participate in discussions, so we biased our dataset towards the more active part of the blogosphere. We focused on the most-cited blogs and traced forward and backward conversation trees containing these blogs. Details may be found in [15]. This process produced a dataset of 2, 422, 704 posts from 44, 362 blogs gathered over the two-month period (with some conversations
5 Observations, patterns and laws 5.1 Temporal dynamics of posts and links Traffic in the blogosphere is not uniform. As Figure 3 illustrates, there is a seven-day periodicity. Posting and blog-to-blog linking patterns tend to have a weekend effect, with frequency sharply dropping off at weekends. In Figure 3 we plot the number of posts per day over the span of our dataset. Next, we examine how a post’s popularity grows and declines over time. We collect all in-links to a post and plot the number of links occurring after each day
4
10
3
10
2
Posts = 541905.74 x−1.60 R2=1.00 1
10
3
10
3
10
10
2
10
2
10
2
10
1
1
10
10
1
10
Posts
0
10
= 60853.80 x−1.46 R2=0.99
10 0 10
1
10
Days after post
0
0
10
1
10
2
10
Days after post
All posts
4
10
2
R :0.92
3
10
0
2
10
4
-1.7
5.7e3 x
2
3
10 10 Blog in-degree
10
4
10
0
10
1
2
10 10 Blog out-degree
3
10
Only Monday posts
4
10
following the post. This creates a curve that indicates the rise and fall of popularity. By aggregating over a large set of posts we obtain a more general pattern. However, the weekend effect creates abnormalities in the plots we must account for. We smooth the in-link plots by applying a weighting parameter to the plots separated by day of week. For each delay ∆ on the horizontal axis, we estimate the corresponding day of week d, and we prorate the count for ∆ by dividing it by l(d), where l(d) is the percent of blog links occurring on day of week d. This simulates a popularity drop-off that might occur if posting and linking behavior were uniform throughout the week. We fit the power-law distribution with a cut-off in the tail (bottom row). We fit on 30 days of data, as most posts in the graph have complete in-link patterns for the 30 days following publication. We performed the fitting over all posts and for all days of the week separately, and found a stable power-law exponent of around −1.5, which is exactly the value predicted by the model where the bursty nature of human behavior is a consequence of a decision based queuing process [3] – when individuals execute tasks based on some perceived priority, the timing of the tasks is heavy tailed, with most tasks being rapidly executed, whereas a few experience very long waiting times. In summary:
-2.2
3e6 x
5
10
2
R :0.92
10
2
10
1
x=40
10
2
, R :0.95
3
10
2
10
1
10
0
10
-2.73
1e5 x
4
10
3
Count
Figure 4: Number of in-links vs. the days after the post in log-linear scale, after removing the day-of-the week effects. Power law fits to the data produce exponents −1.6 and −1.46.
Figure 5: In- and out-degree distributions of the Blog network.
Count
1
10 0 10
10
Count
Number of in−links
Number of in−links
5
10
10
4
5
10
Count
6
10
0
0
10
1
10
2
3
10 10 Posts per Blog
4
10
10
0
10
1
2
3
10 10 10 Number of blog-to-blog links
Figure 6: Distribution of the number of posts per blog (a); Distribution of the number of blog-to-blog links, i.e. the distribution over the Blog network edge weights (b).
p(tp + ∆) ∝ ∆−1.5
corresponds to the number of posts from blog u linking to posts at blog v. Connectivity-wise, half of the blogs belong to the largest connected component and the other half are isolated blogs. We show the in- and out-degree distribution in Figure 5. Notice both follow a heavy-tailed distribution. The number of posts per blog, as shown in Figure 6(a), also follows a heavy-tailed distribution. The deficit of blogs with low number of posts and the knee at around 40 posts per blog can be explained by the fact that we are using a dataset biased towards active blogs. However, our sample still maintains the power law in the number of blog-to-blog links as shown in 6(b). In contrast to Blog network the Post network is very sparsely connected. 98% of the posts are isolated, and the largest connected component accounts for 106, 000 nodes, while the second largest has only 153 nodes. Figure 7 shows the in- and out-degree distributions of the Post network which, not surprisingly, follow a power law.
5.2 Blog network and Post network topology The first graph we consider topologically is the Blog network. As illustrated in Figure 1(c), every node represents a blog and there is a weighted directed edge between blogs u and v, where the weight of the edge
5.3 Patterns in the cascades We are especially interested in how information propagates, and this phenomenon is illustrated by cascades. Given the Post network we extracted all information cascades using the following procedure. We found all cascade initiator nodes, i.e. nodes that have zero out-degree, and started
Observation 1. The probability that a post written at time tp acquires a link at time tp + ∆ is:
G2
G3
G4
G5
G6
G7
G8
G9
G10
G11
G16
G34
Figure 8: Common cascade shapes ordered by frequency. Cascade with label Gr has the frequency rank r. 5
10
-2.15
5e4 x
6
10
2
R :0.95
-2.95
1e5 x
2
R :0.98
5
4
10
3
10
10
Count
Count
4
10
2
10
2
10
1
10
1
10
0
10
3
10
0
0
10
1
10
2
3
10 10 Post in-degree
4
10
10
0
10
1
2
10 10 Post out-degree
3
10
Figure 7: Post network in- and out-degree distribution.
following their in-links. This process gives us a directed acyclic graph with a single root node. To obtain the examples of the common shapes and count their frequency we used algorithms described in [16]. We find a total of 2, 092, 418 cascades.
We next ask: what distribution do cascade sizes follow? Does the probability of observing a cascade on n nodes decreases exponentially with n? We examine the Cascade Size Distributions over the bag of cascades extracted from the Post network. We consider three different distributions: a distribution over all cascade sizes, and separate size distributions of star and chain cascades. We chose stars and chains since they are well defined and given the number of nodes in the cascade, there is no ambiguity in the topology of a star or a chain. Figure 9 gives the Cascade Size Distribution plots. Notice all follow a heavy-tailed distribution, with slopes ≈ −2 overall (Figure 9(a)). Stars have ≈ −3.1 (Figure 9(b)), and chains are small and rare and decay with exponent ≈ −8.5 (Fig. 9(c)). In summary: Observation 2. The probability of observing a cascade on n nodes follows a Zipf distribution:
5.3.1 Common cascade shapes First, we give exp(n) ∝ n−2 amples of common Post network cascade shapes in Figure 8. A node represents a post and the influence flows 6 Conclusion from the top to the bottom. Cascades tend to be wide and not too deep– stars and shallow bursty cascades are We analyzed one of the largest available collections of blog information, trying to find how blogs behave and the most common type of cascades. how information propagates through the blogosphere. 5.3.2 Cascade topological properties What is We studied two structures, the “Blog network” and the common topological pattern in the cascades? We the “Post network”. Our findings are summarized as next examine the general cascade behavior by measur- follows: Temporal Patterns: The decline of a post’s popuing and characterizing the properties of real cascades. First we observe the degree distributions of the larity follows a power law, rather than an exponential cascades. This means that from the Post network we dropoff as might be expected. The slope is ≈-1.5, the extract all the cascades and measure the overall degree slope predicted by a very recent theory of heavy tails in distribution. Essentially we work with a bag of cascades, human behavior [3]. Topological Patterns: Almost any metric we examwhere we treat a cascade as separate disconnected subgraph in a large network. Similar to other networks, ined follows a power law: size of cascades, size of blogs, in- and out-degree distribution of the bag of cascades in- and out-degrees. Finally, stars and chains are basic follow power laws with exponents of -2.2 and -1.92, components of cascades, with stars being more common. respectively. Further examination showed that the in- Most cascades are tree-like. We also built a generative degree exponent is stable and does not change much model for cascades, which was removed for space and given level L in the cascade (a node is at level L if it may be found in [15]. is L hops away from the cascade initiator). This means that posts still attract attention (get linked) even if they Acknowledgements are somewhat late in the cascade and appear towards This material is based upon work supported by the the bottom of it. National Science Foundation under Grants No. IIS-
5
10
-1.97
3e4 x
4
10
2
R :0.93
4
2
10
1
10
1
10
0 1
2
3
4
10 10 10 10 Cascade size (number of nodes)
(a) All cascades
10
3
10
2
10
1
10
0
0
10
2
R :0.99
10 Count
2
10
-8.6
2e+7 x
4
3
10
10
5
10
2
R :0.98
10
3
Count
Count
10
-3.14
1.8e6 x
0
0
10
1
2
3
10 10 10 Size of a star (number of nodes)
(b) Star cascade
10
0
10
1
2
10 10 Size of a chain (number of nodes)
(c) Chain cascade
Figure 9: Size distribution over all cascades (a), only stars (b), and chains (c). They all follow heavy tailed distributions with increasingly steeper slopes. 0209107, SENSOR-0329549, EF-0331657, IIS-0326322, IIS-0534205, and also by the Pennsylvania Infrastructure Technology Alliance (PITA). Additional funding was provided by a generous gift from Hewlett-Packard. Jure Leskovec was partially supported by a Microsoft Research Graduate Fellowship, and Mary McGlohon was partially supported by a National Science Foundation Graduate Research Fellowship. References [1] L. A. Adamic and N. Glance. The political blogosphere and the 2004 u.s. election: divided they blog. In LinkKDD ’05: Proceedings of the 3rd international workshop on Link discovery, pages 36–43, 2005. [2] E. Adar and L. A. Adamic. Tracking information epidemics in blogspace., 2005. [3] A.-L. Barabasi. The origin of bursts and heavy tails in human dynamics. Nature, 435:207, 2005. [4] S. Bikhchandani, D. Hirshleifer, and I. Welch. A theory of fads, fashion, custom, and cultural change in informational cascades. Journal of Political Economy, 100(5):992–1026, October 1992. [5] M. Crovella and A. Bestavros. Self-similarity in world wide web traffic, evidence and possible causes. Sigmetrics, pages 160–169, 1996. [6] M. Faloutsos, P. Faloutsos, and C. Faloutsos. On power-law relationships of the internet topology. In SIGCOMM, pages 251–262, 1999. [7] N. S. Glance, M. Hurst, K. Nigam, M. Siegler, R. Stockton, and T. Tomokiyo. Deriving marketing intelligence from online discussion. In KDD, 2005. [8] J. Goldenberg, B. Libai, and E. Muller. Talk of the network: A complex systems look at the underlying process of word-of-mouth. Marketing Letters, 2001. [9] M. Granovetter. Threshold models of collective behavior. Am. Journal of Sociology, 83(6):1420–1443, 1978. [10] D. Gruhl, R. Guha, D. Liben-Nowell, and A. Tomkins. Information diffusion through blogspace. In WWW ’04, 2004.
[11] D. Kempe, J. Kleinberg, and E. Tardos. Maximizing the spread of influence through a social network. In KDD ’03, 2003. [12] R. Kumar, J. Novak, P. Raghavan, and A. Tomkins. On the bursty evolution of blogspace. In WWW ’03, pages 568–576. ACM Press, 2003. [13] R. Kumar, J. Novak, and A. Tomkins. Structure and evolution of online social networks. In KDD ’06: Proceedings of the 12th ACM SIGKDD international conference on Knowledge discovery and data mining, pages 611–617, New York, NY, USA, 2006. ACM Press. [14] J. Leskovec, L. A. Adamic, and B. A. Huberman. The dynamics of viral marketing. In EC ’06: Proceedings of the 7th ACM conference on Electronic commerce, pages 228–237, New York, NY, USA, 2006. ACM Press. [15] J. Leskovec, M. McGlohon, C. Faloutsos, N. Glance, and M. Hurst. Cascading behavior in large blog graphs: Patterns and a model. Technical Report CMU-ML-06113, October 2006. [16] J. Leskovec, A. Singh, and J. Kleinberg. Patterns of influence in a recommendation network. In PacificAsia Conference on Knowledge Discovery and Data Mining (PAKDD), 2006. [17] M. Richardson and P. Domingos. Mining knowledgesharing sites for viral marketing, 2002. [18] A. Vazquez, J. G. Oliveira, Z. Dezso, K. I. Goh, I. Kondor, and A. L. Barabasi. Modeling bursts and heavy tails in human dynamics. Physical Review E, 73:036127, 2006. [19] M. Wang, T. Madhyastha, N. H. Chang, S. Papadimitriou, and C. Faloutsos. Data mining meets performance evaluation: Fast algorithms for modeling bursty traffic. ICDE, Feb. 2002. [20] D. J. Watts. A simple model of global cascades on random networks. In PNAS, 2002. [21] G. Zipf. Human Behavior and Principle of Least Effort: An Introduction to Human Ecology. Addison Wesley, Cambridge, Massachusetts, 1949.