Khaing Nang et al. BMC Public Health 2010, 10:644 http://www.biomedcentral.com/1471-2458/10/644
RESEARCH ARTICLE
Open Access
Patterns of physical activity in different domains and implications for intervention in a multi-ethnic Asian population: a cross-sectional study Ei Ei Khaing Nang
1†
, Eric YH Khoo2†, Agus Salim1, E Shyong Tai1,2, Jeannette Lee1, Rob M Van Dam1,2,3*
Abstract Background: The benefits of regular physical activity for quality of life and disease prevention have been well documented. Identification of low activity groups would facilitate interventional programs. Many studies have focussed on leisure time activity, which may not capture the spectrum of physical activity relevant to disease prevention. Furthermore, few studies have been conducted in urban Asian settings. Methods: We evaluated physical activity in different domains (leisure time, occupational, household and transportation) and its sociodemographic determinants in 4750 adult Chinese, Malay, and Asian Indian Singaporeans. Physical activity was assessed using locally validated questionnaires. Results: Occupational and household activity contributed substantially more to total physical activity than leisure time or transportation activity. However, when only activity of at least moderate intensity was considered leisure time activity contributed most to total physical activity. Higher socio-economic status was associated with more leisure time activity, but less total physical activity due to reduced activity in the other domains. Chinese ethnicity was also associated with less total physical activity as a result of less activity in non-leisure time domains. Conclusions: In assessing levels of physical activity and recommending changes, it is important to consider physical activity in different domains. Focus on leisure-time physical activity alone could identify the wrong groups for intervention and miss opportunities for increasing physical activity in populations.
Background It is widely recognized that regular physical activity has many health benefits including a reduction in risk of cardiovascular diseases, type 2 diabetes, hypertension, certain cancers, osteoporosis, dyslipidaemia, anxiety and depression [1,2]. Public health programmes have therefore emphasized increases in physical activity and commonly used guidelines recommend that all adults accumulate at least 30 minutes per day of activity of at least moderate intensity (equivalent to walking at 3 to 4 miles per hour) [3]. Recent studies have emphasized the value of assessing total physical activity (leisure time, occupational, transportation and household) rather than focussing on one * Correspondence:
[email protected] † Contributed equally 1 Department of Epidemiology and Public Health, Yong Loo Lin School of Medicine, National University of Singapore, Singapore, Republic of Singapore Full list of author information is available at the end of the article
domain or aspect of physical activity, especially in certain groups of individuals such as women, ethnic minorities or those with lower social economic status [4,5]. In addition, Westerterp demonstrated that vigorous activities such as sports may not contribute as much to total energy expenditure as moderate-intensity activities because vigorous activities are often of short duration [6]. Furthermore, there is also evidence that in the general population, regular light-to-moderate activities such as walking may be beneficial for lowering risk of coronary heart disease and stroke [7-10]. In a U.S. cohort study, women who were walking regularly even with light intensity (walking pace less than 2.0 mph) had a lower risk of coronary heart disease than women who did not walk regularly [7]. As a result, light-to-moderate-intensity everyday activities may be highly relevant for promoting physical activity in the general population. Thus, a broader approach to the assessment of energy expenditure associated with physical activity will
© 2010 Khaing Nang et al; licensee BioMed Central Ltd. This is an Open Access article distributed under the terms of the Creative Commons Attribution License (http://creativecommons.org/licenses/by/2.0), which permits unrestricted use, distribution, and reproduction in any medium, provided the original work is properly cited.
Khaing Nang et al. BMC Public Health 2010, 10:644 http://www.biomedcentral.com/1471-2458/10/644
more reliably identify groups with the lowest total physical activity which could have greater priority for public health interventions. Most previous studies have been conducted in western populations [11-13], and few have evaluated different domains of physical activity in diverse populations in an urban Asian setting [14,15]. We therefore evaluated the characteristics of individuals participating in activities in different domains in a population-based study of Chinese, Malay, and Asian Indian in Singapore. These data can assist in identifying the domains of activity that can be targeted and the low physical activity groups who may benefit most from public health intervention.
Methods Study population
In this study, conducted between 2004 and 2007, 10,080 subjects who had previously participated in populationbased cross-sectional surveys in Singapore between 1982 and 1998 were invited. These previous surveys were all conducted in random sample of individuals from the Singapore population, with disproportionate sampling stratified by ethnicity to increase the numbers for ethnic minority groups (Malays and Asian Indians) [16]. Participants who were deceased at time of follow-up (through data-linkage with the Registry of Births and Deaths) were excluded from the study (n = 559). Six participants who had emigrated and 102 participants, who had error in identity card number and couldn’t follow up, were excluded. A questionnaire was administered by investigators at the participant’s home. Questionnaires were in English and when needed interviewers provided additional explanation in Chinese, Malay or Tamil. Three home visits on three different occasions including one weekend and weekday were made before a participant was deemed non-contactable. 2306 participants were non-contactable. Of the remaining participants, thirty (0.3%) refused to take part. All the interviewed participants were subsequently invited to attend a health examination for additional tests and collection of blood samples shortly after the home visit. A total of 7,744 (76.8% response rate) were interviewed, of which 5,164 (66.7% response rate, or 51.3% of total eligible participants) participants attended the health examination. Of note a high percentage 37.8% of the study population declined to reveal their household income. Ethics approval was obtained from the Institutional Review Boards of National University of Singapore and Singapore General Hospital. Informed consent was obtained from all participants before conduct of study. Assessment of Physical activity
Physical activity was assessed by interviewer-administered questionnaire with a recall period of the previous
Page 2 of 11
3 months. The questionnaire was adapted from several established questionnaires validated in other populations [17-19] and encompassed transportation, occupation, leisure time and household activities. Participants were asked the type and duration of various activities. Then a metabolic equivalent of task (MET) value was assigned to each reported activity according to the compendium by Ainsworth et al [20]. One MET unit is defined as the energy expenditure for sitting quietly, which for the average adult is approximately 3.5 ml of oxygen × kg bodyweight-1 × min-1 or 1 kcal × kg body weight-1 × h-1 [20]. The minutes were converted to hours and weekly energy expenditure from physical activity (Kcal/week) was computed as follows: hours spent on activity per day × numbers of day per week × METs × body weight in kg [21,22]. All light, moderate, and vigorous activities were included in this calculation. For example, if a 60kg participant reported bowling activity for 60 minutes per day for 3 times a week, then his energy expenditure for this activity was calculated as 1 hr × 3 days × 3 METs × 60 kg resulting in 540 Kcal/week. The questions on transportation activity were adapted from National Health Survey 2004 questionnaire [23] which asked about walking or cycling for transport for at least 10 minutes. The duration, frequency and the intensity of the activity (light, moderate, or vigorous) were recorded. Questions on occupational activity were based on the validated Modifiable Activity Questionnaire [18,24]. Participants were asked to list all jobs held during the past 3 months. For each job entry, data was collected for the job schedule and job activity was determined by the number of hours spent sitting at work and the most common physical activities performed when not sitting. Leisure time activity was adapted from the Minnesota leisure time activity questionnaire covering a total of 48 specific activities and open questions about possible other activities which has been validated in various populations [19,25-27]. For each activity, participants identified the frequency and the average duration of participation in each activity. Household activity was adapted from the Yale physical activity questionnaire which covers housework, yard work and caretaking for elderly persons or children and has been validated in diverse populations [17,28,29]. Participants were asked about the type of activity performed and the frequency and duration of each activity. We validated the combined physical activity questionnaire using Actical accelerometers in Singapore population. The Actical accelerometer has been validated previously showing good reliability and accuracy for estimating the time spent in moderate and vigorous physical activity [30,31] and has been widely used in epidemiological studies [32]. A convenience sample of 120 Singaporean adults, aged 21-80 years (49 Chinese,
Khaing Nang et al. BMC Public Health 2010, 10:644 http://www.biomedcentral.com/1471-2458/10/644
31 Malays and 40 Asian Indians; 54 males and 66 females) was recruited. Participants were given instruction on wearing the Actical accelerometer. The participants were required to wear this device for five consecutive days (3 weekdays and 2 weekend days) during all waking hours (except during water-based activities). At the end of the monitoring period, the participants completed the same interviewer-administered physical activity questionnaire as was used in the main study. The correlation between the accelerometer and the physical activity questionnaire estimates were 0.19 (p = 0.03) for moderate (3 to 6 METs) and 0.40 (p < 0.001) for vigorous (>6 METs) activity. Classification of physical activity
“Have no activity” was defined as a person not participating in any physical activity and “Have any activity” was defined as a person participating in any amount of physical activity in the respective domain i.e. any amount of light, moderate or vigorous activity. The recommended level of physical activity was defined as at least 150 minutes a week of moderately-intense or 75 minutes a week of vigorously-intense aerobic physical activity, or an equivalent combination of moderate and vigorous intensity aerobic activity [3]. Moderate intensity was defined as 3 to 6 metabolic equivalents (METs) and vigorous intensity was defined as more than 6 METs [3]. Assessment of socio demographic factors
Baseline information about socio demographic factors (age, gender, ethnicity, education, work status, household income in Singapore $ per month and type of housing) was recorded by interviewer-administered questionnaire. Education was determined as the highest level achieved. This was divided into 4 categories: no education/primary, secondary, technical school and university. Statistical Analysis
5164 participants attend the health examination, of which 143 were excluded due to missing data on weight. In addition, to exclude outliers, the ratio of the energy intake to energy expenditure was calculated and 271 participants, who were in the lowest 2.5 percentile and in the highest 2.5 percentiles, were excluded. A total of 4750 participants were left for analysis. For occupational activity, only the 3267 participants who were employed were included in the analysis. All statistical analyses were performed using Stata 10 for Windows (Stata Corporation, College station, Texas, USA). The participants were divided into two groups; “have no activity” and “have any activity” and chi-square tests were used to test whether there was an association
Page 3 of 11
between participation in physical activity and various sociodemographic factors. For “have any activity” group, the energy expenditure was reported in median and as the distribution of energy expenditure in each domain was skewed, the Kruskal Wallis test was therefore used to assess the association between level of energy expenditure and sociodemographic variables. Age-and gender adjusted median, 25th and 75th percentiles of the activity level of the whole population (i.e includes both no activity and any activity group) were obtained by median regression and presented in the figures stratified by ethnicity and socioeconomic status (SES). Crude median, 25th and 75th percentiles of activity level stratified by age and gender are also shown in the figures. The amount of physical activity based on activity at all intensities (i.e. light, moderate and vigorous) is shown in figure 1, whereas the amount of physical activity based only activity of at least moderate intensity is shown in figure 2. Less than 25% of the population had any transportation or occupational activity of at least moderate intensity. Therefore, these two domains were not presented in figure 2. However, the data for total physical activity level in this figure still covers all 4 domains. For occupational activity, the analysis for tables included only those participants who were currently working while the figures included both working and non working group to be consistent with other domains in the figures. SES was expressed by individual indicators such as highest level of education, work status, household income and type of housing in univariate and multivariate analysis in the tables. However, for figure 1 &2b, a single SES index was developed from education, household income and type of housing. Participants who had missing answer on any of these indicators were excluded (1 missing answer for education and 1794 declined to answer household income). A total of 1794 participants were excluded and 2956 participants were left for SES index analysis. SES index from these three indicators was obtained by performing principal component analysis and using the first and second tertiles of the first principal component score to classify subjects into low, middle and high SES. All statistical tests were two-sided with a level of significance defined as a P-value < 0.05.
Results Population characteristics stratified by gender and ethnic group are shown in Table 1. Participants were of Chinese (67.6%), Malay (16.9%), and Asian Indian (15.4%) ethnicity. More than 80% of men in each ethnic group were employed as compared with 61.5%, 45.0% and 48.0% of Chinese, Malay and Indian women respectively. Approximately 14% of men and 4% of women were retired. Chinese participants were more likely to have a university
Khaing Nang et al. BMC Public Health 2010, 10:644 http://www.biomedcentral.com/1471-2458/10/644
Page 4 of 11
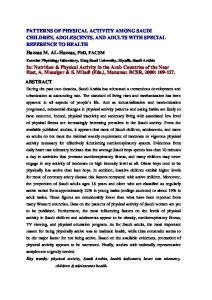
Figure 1 Level of physical activity according to sociodemographic characteristics. Physical activity includes light, moderate and vigorous activity. The activity in each domain, including occupational activity, is based on all eligible participants (N = 4750) i.e. both employed and unemployed participants. a. Median (interquartile range) level of physical activity by ethnicity, adjusted for age and gender. b. Median (interquartile range) level of physical activity by socioeconomic status, adjusted for age and gender. c. Median (interquartile range) level of physical activity by age group. d. Median (interquartile range) level of physical activity by gender.
education, a higher income and live in private housing as compared with other ethnic groups (Table 1). Physical activity by domain
Household and occupational activity contributed most to total physical activity, whereas leisure and transportation activity contributed much less (Figure 1). However, when only activity of at least moderate intensity was considered, leisure time activity contributed most to physical activity (Figure 2). Leisure-time activity was higher in men, in the older age group, and those with higher SES. No substantial differences were observed by ethnicity (Figure 1 &2). In addition, we considered the proportion participating in any leisure time activity and the level of activity among those that participated in leisure time activity separately (Table 2). 73% reported participating in at least some leisure time activity. Men were both more likely to participate in leisure time activity and to have a higher level of activity. Similarly, students and retired persons had both a higher participation in leisure time activity and a higher level of activity than the employed and
homemakers. However, older persons were less likely to participate in leisure time activity than younger persons, but had a higher level of activity if they participated. A higher SES was associated with a higher likelihood of participating in leisure time activity, rather than a higher level of activity for those who participated. Associations for different measures of SES (education, income, type of housing) were similar. When only leisure time activity of at least moderate intensity was considered, associations with sociodemographic characteristics were generally similar (Figure 2). However, the association between older age and more leisure time activity largely disappeared. Occupational activity was higher in the middle age group, men, those with low SES and those of Malay ethnicity (Figure1). Having any light, moderate or vigorous occupational activity was reported by 96% of the working population. The percentage having any occupational activity was highest in the middle age group. However, the level of occupational activity was highest in the older age group. Men, Malays, and those with a lower SES had both the highest participation in occupational
Khaing Nang et al. BMC Public Health 2010, 10:644 http://www.biomedcentral.com/1471-2458/10/644
Page 5 of 11
Figure 2 Level of physical activity of at least moderate intensity according to sociodemographic characteristics. The activity in each domain was based on all eligible participants (N = 4750). Transportation and occupational activity were not shown because less than 25% participated in any activities of at least moderate intensity in these domains. However, total activity does include activity from all four domains. a. Median (interquartile range) level of physical activity of at least moderate intensity by ethnicity, adjusted for age and gender. b. Median (interquartile range) level of physical activity of at least moderate intensity by socioenocomic status, adjusted for age and gender. c. Median (interquartile range) level of physical activity of at least moderate intensity by age group. d. Median (interquartile range) level of physical activity of at least moderate intensity by gender.
activity and the highest level of occupational activity (Table 2). The percentage of having moderate activity and above was reported by 25.0% of working population (i.e. 17.2% of the total population) (Data not shown). Transportation activity was similar in the different age and ethnic groups, but was lower for those with a higher SES (Figure 1). 82% of the population participated in at least some transportation activity. Women were more likely to participate in transport activity, but among those that participated in transport activity the level was lower for women than for men (Table 3). Most transportation activity was of light intensity and transportation activity of at least moderate intensity was only reported by 18.0% of the participants. Household activity was lowest for men, young participants, the Chinese, and those with higher SES (Figure 1). 92% of individuals reported at least some household activity. The largest difference in household activity was observed by gender with women both participating
more in household activities and having a higher level of household activity (Table 3). For all measures of SES, we observed approximately double the level of household activity in those in the lowest as compared with those in the highest category of SES. The level of household activity of at least moderate intensity was much lower, but associations with sociodemographic characteristics were generally similar (Figure 2). However, the association between older age and more household activity largely disappeared. Total physical activity
Total physical activity was highest in Malays, intermediate in Asian Indians, and lowest in Chinese (Figure 1a). The lower activity in the Chinese participants was due to having less household and occupational activity rather than having less leisure time activity. Although a higher SES was associated with more leisure time physical activity, it was associated with less total physical activity
Khaing Nang et al. BMC Public Health 2010, 10:644 http://www.biomedcentral.com/1471-2458/10/644
Page 6 of 11
Table 1 Socio-demographic characteristics of study population Male (N = 2280)
Female (N = 2470)
Chinese N = 1530
Malay N = 392
Indian N = 356
Chinese N = 1682
Malay N = 411
Indian N = 375
%
%
%
%
%
%
18-39 years
20.5
13.5
11.5
22.8
19.5
13.9
40-60 years
58.6
68.6
65.7
60.3
65.2
69.1
>60 years
20.9
17.9
22.8
16.9
15.3
17.1
None/primary
20.9
24.7
17.1
27.8
36.0
37.6
Secondary
33.0
48.5
42.4
37.6
46.7
41.1
Technical school University
23.0 23.1
23.5 3.3
23.9 16.6
19.4 15.2
15.8 1.5
11.5 9.9
Working
80.8
82.4
82.6
61.5
45.0
48.0
Student
0.6
0.5
0.3
0.3
0.5
0.3
Homemaker
0.1
0
0.3
31.0
48.2
44.8
Characteristics Age group
Highest level of education
Work status
Retired
14.5
13.8
13.5
4.9
2.9
4.3
Unemployed (able to work)
2.4
1.8
2.0
1.4
2.0
1.6
Unemployed (unable to work) #Others
1.1 0.7
1.0 0.5
0.8 0.6
0.4 0.6
0.2 1.2
0.3 0.8
Household income (S$/month) Less than $2000
14.5
31.1
24.4
14.5
23.4
26.7
$2000 to $3999
20.1
21.7
23.3
16.9
24.6
21.6
$4000 to $5999
12.8
8.9
11.5
10.6
5.6
8.0
$6000 to $9999
10.2
2.8
9.8
10.6
3.2
5.1
7.1
1.0
4.8
5.2
0.5
1.6
35.3
34.4
26.1
42.1
42.8
37.1
More than $ 10 000 Decline to answer Type of housing 1-2 room flat 3 room flat
1.1
2.3
0.8
1.0
3.9
2.9
13.7
15.8
12.1
16.2
15.3
14.4
4 room flat
32.2
45.7
37.9
31.3
43.3
38.1
5 room or executive flat
31.0
29.1
36.0
29.1
32.4
33.3
Private condominium
12.4
3.3
4.5
12.0
2.9
4.3
9.7
3.8
8.7
10.5
2.2
6.9
Private house (landed property)
#Others: disabled persons, persons with large private financial means, prisoners, patients of mental hospitals, inhabitants of homes for the aged as well as those who were awaiting call-up for national military service are included in this category.
(Figure 1b). This was due to the lower household, transport, and occupational activity in participants with a higher SES. The middle age group had the highest total physical activity as most people in this group were working (Figure 1c). Total physical activity was higher in men than women due to having higher leisure activity and occupational activity (Figure 1d). When considering only activities of moderate or higher intensity levels, total physical activity was still highest in Malays, the low SES group, the middle age group, and men (Figure 2). The majority of the study population (71%) achieved the recommended level of activity of at least 150 minutes per week of moderately intense physical activity or 60 minutes of vigorous physical activity or a combination of both. The percentage of participants who did not
meet the recommended level of activity was somewhat higher for women (31%), the youngest age group (18-39 years; 34%), and those with the lowest (lower primary education or less; 36%) or highest (university; 33%) education. The percentage of participants not meeting the physical activity recommendations also differed by work status: homemakers (26%) and the retired (29%) were the least likely to not to meet the recommendations. Ethnicity, household income and type of housing were not significantly associated with achieving the recommended level of activity (data not shown).
Discussion Identifying sociodemographic determinants of different types of physical activity is an important step in the
Khaing Nang et al. BMC Public Health 2010, 10:644 http://www.biomedcentral.com/1471-2458/10/644
Page 7 of 11
Table 2 Leisure time and occupational physical activity according to sociodemographic characteristics Leisure time activity
Occupational activity*
Any activity N (%)
Median† (Kcal/week)
Any activity N (%)
Median† (Kcal/week)
3449 (73)
801(360-1600)
3122(96)
3527(1534-6298)
18-39 years
738 (80)
706 (341-1493)
751(95)
2600(1134-4957)
40-60 year
2085 (71)
799 (350-1595)
2147(97)
3861(1682-6633)
>60 years
626 (71)
966 (470-1778)
224(93)
4174(2144-7115)
p value Gender