anglais). RESUME. L'objectif premier a été l'étude des possibilités de tarification de l'eau dans les ...... (Ellis 1990). In today's developed countries the bottled water industry's effect ... water using fixtures or various consumption units (tariffication points). Flat rates are ...... bet and stones were traditionally used in small and.
Tampereen teknillinen korkeakoulu Julkaisuja 74
Tampere University of Technology Publications 74
Tapio S. Kalko
Paying for Water in Developing Countries
Thesis for the degree of Doctor of Technology
Tampere 1991
Katko, Tapio S. Paying for water in developing countries/Tapio S. Katko. — Tampere: Tampereen teknillinen korkeakoulu, 1991. - 240 s. — (Julkaisuja/Tampereen teknillinen korkeakoulu ; 74) Diss. : Tampere University of Technology. — Abstract in Finnish and French. — ISBN 951-721—724—2 ISSN 0356-4940 UDC 628.1 628.003 Tehokopiointi Ky , Tampere 1991
T0
PAIVI,
JEMI AND
REBEKKA
Katko, T. Paying for Water in Developing Countries
5
Katko, T. 1991. Paying for Water in Developing Countries. Tampere University of Technology. Publication No. 74. 240 p.
TABLE
OF
CONTENTS
Page
LIST OF ORIGINAL PUBLICATIONS PREFACE AND ACKNOWLEDGEMENTS ABSTRACT RESUME TIIVISTELMA
10
LIST OF ACRONYMS
11
ESSENTIAL DEFINITIONS
12
1
INTRODUCTION 1 .1
Background
1 .2 1.3
Objectives of the Study Structure and Methodology
PROBLEM FORMULATION 2.1 Water Supplies in Developing Countries 2.2 Constraints on Water Supply 2.3 Cost Recovery Policies 2.4
Focus and Hypotheses
15 15 15 16 18 18 19 21 22
THEORETICAL CONSIDERATIONS 3.1 Development Theories and Strategies 3.2 Basic Concepts 3.3 Pricing Objectives 3.4 Institutional Aspects
26 26 28 38
RESULTS AND DISCUSSION 4.1 Water Pricing in Developed Countries 4.2 Cost Recovery in Water Supply in Developing Countries 4.3 Advantages of Consumer-Managed Water Supply 4.4 Implications for Development Cooperation 4.5 Evaluation
37 37
CONCLUSIONS AND RECOMMENDATIONS 5 .1 5 .2
Conclusions Recommendations
REFERENCES
37 48 62 65 69 69 70 71
Katko, 72 Paying for Water in Developing Countries
6
LIST OF ORIGINAL PUBLICATIONS
The dissertation is based on the following papers, referred in the text by their roman numerals:
Page Katko, T., 1986. Major Constraints in Water Supply in Developing Countries. Aqua Fennica. 16,2:231-244.
81
l I
Katko, T., 1988. Various Approaches of Nordic-Supported Water Supply Projects in Tanzania. Proceedings of the Vlth lWRA World Congress on Water Resources. 29 May 3 June 1988. Ottawa, Canada. Vol. 4. p. 52-60.
97
ll l
Katko, T., 1988. Pricing of Water Services in Finland and Some Other Developed Countries. Aqua Fennica. 18,1:61—74.
109
IV
Katko, T., 1990. Cost Recovery in Water Supply in Developing Countries. Water Resources Development. 6,2:86~94.
125
V
Katko, T., 1991. Reselling and Vending Water. Journal AWWA. Vol. 83, no. 6. p. 63—69.
137
Vl
Katko, T., and Viitasaari, M., 1990. Rural Water Supply Development in Finland — Possible Implications for the Developing Countries. Aqua Fennica. 20,1:3~12.
147
Vll
Katko, T., 1991. Development of Water Supply Associations in Finland with lmpllcations for the Developing Countries. The UNDP/ World Bank Water and Sanitation Program. Discussion Paper (Accepted). 70 p.
159
-
I
Katko, 72 Paying for Water in Developing Countries
7
PREFACE AND ACKNOWLEDGEM ENTS
"He brought you water out of hard rock" Deuteronomy 8:
15
This study was conducted at Tampere University of Technology from 1986 to 1991. The research interest has evolved through various activities in development cooperation in the sector since 1978. I am greatly indebted to Professor Matti Viitasaari for originally arousing my interest in water supplies for developing countries, and for his continuous encouragement and supervision of the study. l wish to thank the preliminary assessors, Professor Terje Simensen from Norwegian University of Technology, Trondheim and Dr. Dennis 8. Warner from the World Health Organization, Geneva for their constructive comments and suggestions. Special thanks go to Mr. William Ferguson for reviewing the final draft. In developing the research topic and strategy l was also guided by David Grey, Jarmo Hukka, Reijo Hakkinen, Ayse Kudat, Louis Laugeri, Damas Mashauri, Eero Meskus, Olli Niemi, Patts Odira, Jouko Peltokangas, Pekka Pietila, Raimo Salokangas, Tauno Skytta, Christine van Wijk-Sijbesma, Hannu Vikman and Matti ware. i thank the staff members of FlNNlDA, the World Bank and the World Health Organization for their support. i highly appreciate the discussions with many East African water specialists and other experts familiar with developing countries. in Finland i want to thank the numerous people from water associations who contributed to my study. indeed, it is not possible to thank all those persons who have helped me during the research years: the list would just be too long. The English text of the dissertation and the related papers were revised by Jorma Tiainen. Secretarial and drawing services were provided by Riitta Jokipolvi, Pirkko Lehtonen, Sari Merontausta, Riitta Myyrylainen, Riitta Ranta and Tea Tikka. Tuija Poussa helped in statistical analysis of the data. This support was invaluable. The major part of this study was financed by the Academy of Finland and the Finnish international Development Agency (FlNNlDA). Their support is gratefully acknowledged. i wish to thank The Air—Ix Fund, The Foundation for Civil Engineering, The Industrial Culture Foundation, The Okobank K Haataja Foundation, Tampere City Research Foundation, Tampere University of Technology, and The Wihuri Fund for personal scholarships. Finally, i want to thank warmly my wife Paivi, our son Jemi and our daughter Rebekka for their support and patience.
Tampere, October 1991
Tapio S. Katko
Katko, 72 Paying for Water in Developing Countries
4
8
Katko, T., 1991. Paying for Water in Developing Countries. Tampere University of Technology. Publication No. 74. 240 p.
ABSTRACT
The primary objective of this study was to determine the possibilities of making consumers pay for their water in developing countries. The secondary objective was to survey the applicability of consumer-managed water supplies to the developing world.‘Questionnaires, delphi-surveys, theme interviews, and field surveys were used in this study which is based on seven related publications.
inadequate cost recovery was shown to be the most severe constraint on water supply in developed and developing countries. Developing countries, supported by external agencies, have emphasized implementation, while operation and maintenance has often been neglected. Since Governmental funding and external support are insufficient, consumer payments have become necessary.
The study shows that water payments from consumers in developing countries is possible to a larger extent than previously believed. The produced cost recovery model has four key elements: benefits and costs, predictability of consumer contributions, water tariffs, and fee collection and financial management. The model is further divided into sub-elements and variables which provide several partial solutions. Cost data is typically scarce and follow-up systems do not exist. The commonly practised water vending and reselling indicate consumers' actual willingness to pay for water. in many developing countries water tariffs have declined in real terms ever since their independence in the 19603. It would be more equitable to use progressive tariffs. Collection methods may vary from spot cash payments to seasonal ones. Rural areas, in particular, lack appropriate institutions for developing cost recovery strategies.
Consumer-managed water cooperatives, such as those in Finland, have special merits for the developing world. Gradual development where consumers act as initiators and contributors is the natural way to improve services. in small systems simpler technology, accurate technical design, the use of small contractors, minimum staffing, voluntary contributions and self-help can reduce costs. Each party should assume the duties they do best. Consumers should cover the majority of the costs in cash or in kind. The government should concentrate on policy issues, promotion and guidance. Cooperatives or other types of associations should have the management responsibility. The private sector could supply many of the external services. Consumer-managed water associations exist in many other developed, and even developing countries, although largely unrecognized by the authorities.
it is suggested that external support agencies should further analyse and use the experiences accumulated in their home countries. Developed countries could also make use of the experiences from the developing world. To secure efficient use of resources alternatives for grant aid should be studied.
Key words: water supply, water pricing, cost recovery, institutional development, water associations, water cooperatives, diffusion of innovations, developing countries, development cooperation, water policy
Katka, T. Paying for Water in Developing Countries
9
Katko, T., 1991. Payer pour l’eau dans les pays en voie de développement. Université de Technologie de Tampere. Publication No 74. 240 p. (original en anglais).
RESUME
L'objectif premier a été l‘étude des possibilités de tarification de l'eau dans les pays en voie de développement (PVD). De plus le développement des adductions
d'eau gérées par les consommateurs pour les PVD ont été étudiés. L'étude s'appuie sur questionnaires, interviews thématiques, la méthode Delphi et enquétes sur le terrain. La these est basée sur sept articles sur la taritication de l'adduction d'eau et ses développements institutionnels. L‘insuffisance de recouvrement des cofits s'avére étre le problems principal du
secteur dans tous les pays. Les pays en voie de développement ont construit de nouvelles installations avec les dons de l'aide internationale tout en négligeant
l’entretien. L’insuifisance du financement des gouvernements de ces pays et des bailleurs de fonds rendent les taxes a la consommation nécessaires.
Cette étude montre que l’eau pourra étre taxée plus souvent que les pays en developpement ne i’ont cru. Le modele de recouvrement des coats que nous avons
concu comporte quatre éléments-clés: couts et bénéiices, capacité et volonté de payer des clients, tarification et encaissement. ll est sub—divisé en souséléments et variables donnant diverses solutions partielles. Les données sur les coats sont rares et peu étudie’es. La revente de l'eau, tres tréquente, indique la volonté des consommateurs a payer leur eau. Dans de nombreux pays en développement Ia valeur réelle des redevances a diminué depuis les indépendances vers 1960. ll serait plus equitable d’utiliser des tarlfs progressifs avec la consommation. Les modes d'encaissement varient du paiement sur place a la recette saisonniere. En milieu rural surtout, les organisations de gestion
adéquates font défaut.
Les organisations ge’rées par les consommateurs telles qu'en Finlande oftrent de nombreux avantages 3 cos pays. ll est nature! de développer le service d’eau par étapes suivant l'initiative et les versements des consommateurs. Les petits groupements réduisent les coats par technique simple, dimensionnement précis, personnel réduit, petits entrepreneurs et travail volontaire. Chacun devrait s'occuper uniquement de son secteur de predilection. L'administration devrait se limiter aux grandes lignes, a l'éducation et au conseil. Les cooperatives ou autres
associations devraient étre responsables de la gestion de I'installation. Le secteur privé pourrait étre charge de services extérieurs. Des adductions d’eau associatives gérées par les consommateurs existent dans de nombreux pays développés et méme en développement, bien qu’on ne le sache pas.
L’étude suggére que les organismes de coopération devraient mieux analyser et utiliser l’expérience de leur propre pays. Les pays développés ont aussi beaucoup a apprendre de celle des pays en développement. Des alternatives a l'aide par dons devraient étre recherchées afin de renforcer l'efficacité de l’utilisation des ressources.
Mots-clés: adduction d'eau, tarification, recouvrement des coats, développement institutionnel, adduction associative, diffusion des innovations, pays en voie de développement, aide au développement, politique de l'eau.
Katko, T. Paying [or Water in Developing Countries
10
Katko, T., 1991. Vesimaksut kehitysmaissa. Tampereen teknillinen korkeakoulu. Julkaisu no. 74. 240 s. (Alkuperéinen englanniksi). TIIVISTELMK Témén tutkimuksen péétavoitteena oli tutkia mahdoilisuuk-sia Saada kuluttajat maksamaan vesihuollosta kehitysmaissa. Lisétavoitteena'oli tutkia kuluttajien hallinnoimien vesiyhtymien soveltuvuutta kehitysmaihin. Tutkimuksessa kéytettiin kyselyjé, delfoitekniikkaa, teemahaastatteluja ja kemtétutkimuksia. Véitaskirja perustuu seitseméén tutkimuksen ongelma—aluetta késittelevéén julkaisuun. Riittémétén kustannusvastaavuus osoittautui vaikeimmaksi vesihuollon ongelmaksi kehittyneissé ja kehitysmaissa. Kehitysmaat ovat kansainvéliseilé Iahja-avulla rakentaneet uusia laitoksia samalla, kun kunnossapito on laiminlyéty. Koska kehitysmaiden hallitusten ja avunantajien rahoitus on riittaméténté, ovat kuluttajamaksut tulleet vélttéméttémiksi.
Tutkimus osoittaa, etté kehitysmaissa voidaan kéyttéé vesimaksuja enemmén kuin aiemmin on uskottu. Tyéssé kehitetty kustannustenkattamismalli sisé‘xltéé neljé pééelementtié: hyb‘dyt ja haitat, kuluttajien maksukyky ja -halukkuus, maksurakenteet ja maksujen hallinnointi. Mani jakautuu alielementteihin ja muuttujiin, jotka antavat useita osittaisratkaisuja. Kustannuksista on véhé’m tietoa eiké niiden muodostumista seurata. Laajaue Ievinnyt veden yksityinen myynti osoittaa kuluttajien halukkuutta maksaa vedesté. Monissa kehitysmaissa vesimaksut ovat Iaskeneet reaalisesti 1960’luvun valtiollisesta itsenéis— tymisesté léhtien. Oikeudenmukaisempaa olisi kéyttéé kulutuksen mukaan nousevia maksuja. Keréysmenetelmét voivat vaihdella kéteismaksuista vuodenaikaisiin maksuihin. Erityisesti maaseudulta puuttuvat vesimaksujen hailin-
nointiin soveltuvat instituutiot. Suomen kaltaiset kuluttajien hallinnoimat vesiosuuskunnat tarjoavat useita etuja kehitysmaille. Vesihuoltopalveluja on Iuonnoilista kehittéé asteittain kuluttajien aloitteellisuuden ja maksujen pohjalta. Pienissa yhtymissé voidaan kustannuksia véhentéé yksinkertaisella tekniikalla, tarkalla teknisellé mitoituksella. pienurakoitsijoiila, pienellé henkiléstémééréllé ja talkootyélla. Kunkin osapuolen tulisi huolehtia sille parhaiten soveltuvasta toiminnasta. Kuluttajien tulisi kattaa pééosa kustannuksista maksuilla tai muulla tavalla. Viranomaisten tulisi keskittyé linjakysymyksiin, valistamiseen ja neuvontaan. Osuuskunnilla tai muun tyyppisill‘a yhtymillé tulisi olla péévastuu laitosten hallinnoinnista. Yksityissektori voisi tuottaa monia ulkopuolisia palveluja. Kuluttajien hallinnoimia vesiyhtymia on monissa kehittyneissa ja jopa kehitysmaissa, vaikka viranomaiset eivét juuri ole niisté tietoisia.
Tutkimus suosittaa, etté kehitysyhteistyéjérjestéjen pitéisi tarkemmin analysoida ja hyédyntéé omien maidensa kokemukset. Kehittyneillé mama on myb‘s paljon opittavaa kehitysmaiden kokemuksista. Resurssien tehokkaan kéytén varmistamiseksi tulisi Iahjamuotoiselle avulle etsié vaihtoehtoja. Avainsanat: vedenhankinta, veden hinnoittelu, kustannusten kattaminen, institutionaalinen kehittéminen, vesiyhtymat, vesiosuuskunnat, innovaatioiden leviaminen, kehitysmaat, kehitysyhteistyé, vesihuoitopolitiikka
Kalka, T. Paying for Water in Developing Countries
11
LIST OF ACRONYMS AlC AWWA BMZ
Average Incremental Cost American Water Works Association Bundesministerium fur wirtschattliche Zusammenarbeit (Federal
Ministry for Economic Cooperation, FRG) Canadian international Development Agency Contingent Valuation Danish International Development Agency Department of Technical Cooperation for Development (UN) External Support Agency Economic and Social Commission for Asia and the Pacific Franc Communaule Financiere Atricaine
CIDA OJ DANIDA DTCD ESA ESCAP FCFA FIM FINNIDA FmHA Gt?
Farmers Home Administration (USA) Gross National Product
iBRD
International Bank for Reconstruction and Development
IDWSSD IPHE IRC
International Drinking Water Supply and Sanitation Decade Indian Public Health Engineers International Reference Centre
lWEE
Institute of Water and Environmental Engineering (TUT)
IWEM IWRA IWSA
Institute of Water and Environmental Management (UK) International Water Resources Association International Water Supply Association Least Developed Countries Long-Run Marginal Cost Meticais (Mozambique) Non-governmental organisation Norwegian Agency for International Development Non~revenue water National Rural Water Supply Association (USA) National Urban Water Authority (Tanzania) Overseas Development Administration (UK) Organisation for Economic Cooperation and Development Promotion of the Role of Women in Water and Environmental Sanitation Services pays en voie de développement (developing countries) Swiss Development Cooperation Agency Swedish International Development Authority Short—Run Marginal Cost Tanzanian Shilling Tampere University of Technoiogy United Nations Development Programme United Nations Educational, Scientific and Cultural Organization United Nations Children’s Fund United States Agency for International Development Water and Sanitation for Health Project Women in Development World Health Organization Willingness to Join Willingness to Pay
LDCs
LRMC MET N30 NORAD NRW NRWA NUWA 03A 0830 PROWWESS PVD SDCA SIDA SRMC TAS TUT UNDP mssoo UNICEF USA! D WASH W! D Wl-D WTJ WTP
Finnish Mark(s) Finnish International Development Agency
Katlco, I Paying for Water in Developing Countries
.
12
ESSENTIAL DEFINITIONS
capacity building: comprises three basic elements; creating an enabling environment with appropriate policy and legal framework, institutional development including community participation, and human resources development and strengthening of managerial systems “champion": “driving force" or “prime mover” of a water association, his or her role is decisive in the initiation, promotion and establishment phase, the “champion” often is a voluntary, part—time or full-time manager of the association charge = price asked for goods or services
constraint : barrier that prevents, hinders or controls development consumer commitment : an agreement to assume a financial or application at a future date
in-kind
consumer-managed cooperative : a cooperative where consumers as members
have the direct decision-making power; daily routines are normally administered by the board and manager contingent valuation method : direct enquiry about households’ or consumers’ willingness to pay or their likely reactions to price changes cost recovery = regaining the costs of, e.g., supplying water cross-subsidization : subsidization of smaller consumers of a utility by the larger ones
delphi-survey= methods based on utilizing the opinions and views of experts in a certain field, e.g., through questionnaires developing countries: including three major groups; the poorest countries designated by the United Nations as least developed countries (LDCs), non-oil exporting developing countries, and petroleum-rich OPECcountries; newly industrialized developing countries (Nl) diffusion of innovations: spread of innovations economies of scale: a decrease in unit costs accompanying an increase in output exit = public’s ability to exit, if dissatisfied with the service
gross national product (GNP) = measures the total domestic and foreign output claimed by residents of a country. It comprises gross domestic product plus factor incomes accruing to residents from abroad, less the income earned in the domestic economy accruing to persons abroad in-kind payment = payment in non-monetary form institutional development =development of various
organisation, such as planning, procurement, administrative functions
functions within
an
service, financial and
payment = contribution in cash or in—kind for a good. service rendered price =sum of money for which something is bought or sold
price elasticity of demand: the percentage change in quantity demanded divided by the percentage change in price reselling:
selling
of
water
to
customers who come and fetch it by the
owner of the water connection
Katko. I Paying for Water in Developing Countries
13
spot cash payments = paying for service on spot sustainable development = development that meets the needs of the present without compromising the ability of future generations to meet their own needs tariff = a schedule of charges or rates
vending: selling water as a hawker or peddler; a vendor transports small quantities of water to the user as adoor-to-door service; in wholesale vending water is supplied in bulk voice = beneficiaries‘s ability to make their voices heard, it dissatisfied with the service willingness to pay = maximum amount that a person would be willing to pay for a service rather than do without it
Katko, 7i Paying for Water in Developing Countries
1 1 .1
15
INTRODUCTION Background
in 1980 The United Nations General Assembly launched The International Drinking Water Supply and Sanitation Decade 1981—1990 which had the goal of supplying safe water at a reasonable distance and proper sanitation for all
mankind. in spite of many efforts by developing countries and external support agencies (ESAs), the goal proved to be very ambitious, the results have fallen short of expectations and coverage has not kept up with pOpulation growth (Global Consultation...1990). Many of the systems constructed have for various reasons quickly ceased to function. The record is, in fact, quite disappointing.
Many developing countries have considered water supply as a social service which should be free or very cheap from the time they gained independence. Before the mid-1980$ this unrealistic policy was hardly criticized and it was accepted by most of the ESAs. in the late 19703 the concept of “appropriate technology” was introduced. The idea was to develop and use the technology
appropriate to local conditions. This was often misinterpreted as low-cost technology.
in the late 19705, the concept of “community participation” was introduced. Some researchers believed that purely by participating in projects communities were fulfilling their role. Other issues addressed in the beginning of the Water Decade were rural emphasis, education and communication support, training, choice of the right technology and maintenance (UNDP
1981). The role of women, the main drawers of water, was also emphasized. Towards the end of the 19803 the issue of “capacity building” was stressed. At that time the World Commission on Environment and Development (1987) made
the concept of “sustainable development” commonly known.
The concepts have in many ways remained slogans rather than become practical tools for implementing water supply and sanitation policies. it was not until the latter part of the Decade that discussion started on the issues of cost recovery, water pricing and consumer commitment. This contradicts the historical development of the sector in the home countries of ESAs where consumers have covered the costs of water services. Surprisingly, these experiences have hardly been analysed. it has been taken for granted that conditions of the developing countries are too different to make use of these experiences.
1.2
Objectives of the Study
The primary objective of the study is to determine the possibility of making consumers pay for their water in developing countries. The aim is to produce a cost recovery model for water supply with emphasis on developing countries. The secondary objective is to find out the applicability of consumer-managed water supplies to developing countries. This is to be verified by studying the evolution of consumer-managed water cooperatives in Finland with implications for the developing world, and by presenting evidence from other countries.
Katka, T. Paying for Water in Devea Countries
~
16
To fulfill the objectives historical and present evidence both from developed and developing countries are to be surveyed. in addition of being an academic dissertation, the study's most potential readers are among the policy-makers and sector professionals in development cooperation.
1 .3
Structure and Methodology
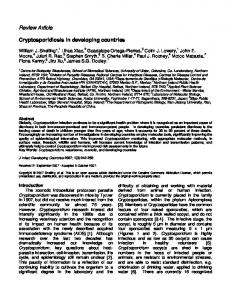
First. the objectives and the structure of the study are presented. Theoretical considerations form the background for problem formulation and the analysis of paying for water services. After focusing on the study area, the hypotheses are presented. Based on present and historical evidence, together with field surveys and practical experience analogies are drawn between developed and developing countries. Finally conclusions and recommendations are made for developing countries and external support agencies (Figure 1.1).
BACKGROUND. OBJECTIVES
i PROBLEM FORMULATION A + B
FOCUS AND HYPOTHESES
THEORETICAL CONSIDERATIONS
i m
t
HISTORICAL ANALOGY
EVIDENCE A
l FIELD SURVEYS \
|
t ZSFSSNNJE B l
ANALYSIS
FIELD SURVEY, / PRACTICAL EXPERIENCE
i DISCUSSION, EVALUATION I CONCLUSIONS. RECOMMENDATIONS
Figure 1.1
The structure of the study.
A = DEVELOPED coumntes B = DEVELOPING COUNTRIES
Katko, I Paying for Water in Developing Countries
17
The study has an interdisciplinary approach emphasizing technical, financial and institutional dimensions. The technical dimensions permeate the whole study, although the major focus is on financial and institutional issues. These questions are mainly seen from the pragmatic point of view of engineering sciences. individual sub~studies are based on literature surveys including internally distributed material, plain questionnaires and delphi—surveys, open-ended and semi—structured interviews, field surveys and missions, three workshops, and one short~term consultancy. From 1987 to 1990 the author has participated in the work of an informal task force of the World Health Organization (WHO) on institutional development.
The research topic is based on the author’s field experiences, as well as research and training in and for developing countries since the late 19703. Papers | and II are based on the author’s licentiate’s thesis. They form the basis of the research and the hypothesis. The dissertation is divided into two parts: the summary and the papers. Figure 1.2 shows the linkages between the study, the theories applied, and the real world in developed and developing countries. The theories applied are of supportive nature. The main result of the study is the developed model on cost recovery. The study also includes evidence on the merits of consumer~managed water supply: examples on the diffusion of water supply innovations, the development process of water cooperatives, limits of economies of scale, an exit/voice model for water supply in developing countries, and policy implications for development cooperation.
THEORY
THE STUDY
REAL WORLD W
DEVELOPED
DEVELOPlNG
COUNTRIES
COUNTRIES
MAJOR CONSTRAINTS
MODEL ON COST
I: 1'
RECOVERY
\ (3 I-{DEVELOPMENT THEORIES
\
I||,IV V ADVANTAGES OF CONSUMER MANAGEMENT
3)
TECHNOLOGY
' INNOVATION DIFFUSION
INSTITUTIONAL DEVELOPMENT
1" L/
- WATER COOPERATIVES
\
(a)
WATER PRICING
ECONOMIC THEORIES - CLASSICAL
‘INSTITUTIONAL
/
- ECONOMIES OF SCALE - EXIT/VOICE MODEL
0 POLICY IMPLICATIONS
Figure 1.2 The relationships between the study, theory, and the real world. The Roman numerals refer to individual papers and the arabic numerals to the respective chapter of the report.
Katko, T. Paying for Waterin Developing Counties
2
2 .1
18
PROBLEM FORMULATION
Water Supplies in Developing Countries
At the first stage of the study the author developed a framework for technical and non—technical dimensions of externally supported rural water supply (Figure 2.1). After the justification of improved water supply and sanitation, the three key elements are identified. These elements contain the development of human resources, appropriate technology as well as organisation and management.
JUSTIFICATION OF IMPROVED WS&S
HUMAN RESOURCES DEVELOPMENT
Figure 2.1 1987bL
MAJOR
EXTERNAL
CONSTRAINTS
SUPPORT
DIMENSIONS OF APPROPRIATE TECHNOLOGY
& MANAGEMEN
ORGANIZATION
0 TECHNICAL ‘ ENVIRONMENTAL I FINANCIAL 0 ECONOMICAL 0 SOCIAL o CULTURAL
Key dimensions of externally supported water supply (Katko
Appropriate technology depends on technical, environmental, economical, financial, social and cultural conditions. Appropriate technology is not necessarily low-cost and the level of technology must be considered separately in each case. High-level technology is needed especially in water resources inventory. Low-level technology is often feasible in implementing rural water supply systems. Appropriate materials may represent high-level technology. A direct—action pump, produced of the best materials represents high technology to the manufacturer. Yet, for the user this technology is simple (Katko 1987b).
Katko, T. Paying for Waterin Developing Countries
2.2
19
Constraints on Water Supply
Developed Countries Murdoch Jr. (1956) was critical that water supply utilities had educated consumers to consider water cheap. His view was that this attitude is based on the
conditions prevailing at the beginning of water supply development in the late 1800s. Then wells and cisterns were generally preferred, and water works were able to attract customers only by supplying water at low rates. ln 1984 the American Waterworks Association (AWWA, cited by Grigg 1986) made a survey on the most severe constraints in water supply industry. The survey used one application of the Delphi method (e.g., Linstone and Turoff 1975) to find out the expert opinion. Out of the 24 constraints, inadequate rates were considered the most severe one, and several other cost recovery related constraints were identified. In the late 19805 water supply and sewerage systems
were privatized in England and Wales. One reason for this was that publiclyowned water supply departments were restricted the amount they could borrow for rehabilitation and new investments. Sweden seems now to face with similar development, although in a less drastic manner. The examples show that cost recovery-related constraints by no means concern only developing countries.
Developing Countries
As a first step a study was made on the major constraints of water supply in developing countries (1). The study concentrated on Kenya, Malawi, Sri Lanka and Tanzania. Malawi was chosen, as she had developed a number of interesting strategies for rural water supply. The other countries have been main recipients of the Finnish bilateral development cooperation in the sector. The author has worked in Malawi and Tanzania, and gone on short-term missions to Kenya and
Sri Lanka. The study was based on a questionnaire which required that the severeness of presented potential major constraints were to be ranked. The form was originally developed by WHO for analysing the constraints by the Governments of developing countries. The form was sent to persons familiar with the sector development in each country. In addition, some respondents were interviewed.
The findings revealed remarkable differences between the views of the developing countries and those of external experts. Both groups considered operation and maintenance combined with logistics the most severe constraint in all four countries. The developing countries emphasized more the lack of trained personnel and funding, whereas foreign experts were more concerned about inadequate cost recovery. Dabbagh (1991) analysed further the data on the major constraints reported by WHO in December 1990. This revised analysis by Dabbagh rated "inadequate cost recovery framework" as the most severe
constraint in Africa, whereas the WHO analysis placed it sixth. Operation and maintenance as well as logistics problems followed as the next most common
constraints. This is in line with the author's findings (l, Figures 2, 4 and 5).
Katko, I Paying for Water in Developing Countries
20
In 1938, Bunher (cited by Donaldson 1984) already pointed out the poor operation and maintenance of water supply systems in Latin America. He also noted that organisational problems were more common than technical ones.
Robinson (1990) pointed out that in developing countries maintenance has traditionally been considered to be an unglamorous activity. in many organisations it is the duty of those lacking competence or motivation. Maintenance has received limited facilities and low budget allocations. Compared with the cost of new investment, maintenance is relatively cheap. The lack of maintenance results in reduced service level or complete breakdown and an inadequate economic return on investment.
Constraints on Externally Supported Projects
in 1986-1987 a comparative study was made of the four Nordic-supported rural water supply projects in Tanzania (ll). These projects have been supported by Denmark (DANIDA), Finland (FlNNIDA), Norway (NORAD) and Sweden (SlDA). The study included literature and project document surveys, a questionnaire that drew 120 respondents, and structured theme interviews of 20 persons, mainly in Tanzania. The study showed that the donors’ share of the implementation costs of each project was over 90 percent, in some cases close to 100 per cent. The study pointed out that putting a price on water was becoming absolutely necessary to raise funds for operation and maintenance. By 1986, improved water supply covered officially as much as 42 per cent of consumers, but the author estimated that less than half of the systems were operating (Katko 1987c).
Therkildsen (1988) studied the approaches of five donor-supported rural water supply projects in Tanzania. The study criticized strongly the control-oriented approach of these projects with detailed planning and fast implementation rates. An adaptive approach was suggested, because of the uncertainty and complexity of the rural water sector. This would mean, e.g., active user participation and would make it possible for users to commit their own resources.
In 1983 WHO made a monitoring survey of the Water Decade activities. Out of 63 countries responding, half reported that over 60 per cent of the sector investments are covered by external support. This share was relatively highest in the Africa region (WHO 1986). Often the ESAs expect that the governments of developing countries will take charge of maintaining and running the schemes. The maintenance organisations in developing countries may be able to generate local revenue to cover maintenance costs, but are often unable to obtain foreign currency to purchase imported items. Thus, externally supported projects have increased the burden on national institutions.
Many typical constraints in developing countries are management-related. Nepotism, corruption, misuse of resources and informal economies were hardly discussed in the 19603 and 19703. These were the decades of strong belief that development could be implemented merely by external support. Dumont (1966) criticized the lack of economic incentives and the scale of management problems in developing countries. These and other related constraints exist also in developed countries but are not as visible because of more operative administration and infrastructure. Hofstede (1980) pointed out the differences in work-related values in different cultures. These differences were neglected for
Kalko, 7? Paying for Water in Developing Counuies
21
long in development cooperation.
Even in the 1980s the public discussion on development cooperation in Finland concentrated on criticizing the implementors of externally supported projects.
This is true with most of the research on development cooperation. It was not until the late 19805 that critical discussion started on the typical constraints in developing countries and on policy questions. Cost recovery and pricing was one such question.
2.3
Cost Recovery Policies
Developing Countries Many of the developing countries, especially those in Eastern Africa, have since achieving independence had the policy of supplying water totally or, almost, free of charge to rural and urban fringe consumers. One of the most striking examples is Tanzania, which became independent in 1961. The Government started financing all water supply investments in 1965, and in 1970 it even started to cover operation and maintenance costs. By 1970 all rural water supply systems gave free water (Rimer and Associates 1970). It took more than two decades to
realise that this policy is not sustainable. External support agencies have silently accepted this policy in spite of the fact that the experiences from their own countries could have suggested different approaches. Related to the Finnish support Viitasaari (1972) stated that it would not be possible to construct and maintain the continuously growing number of water supply systems just as a social service. He concluded that sooner or later cost recovery would be necessary. By 1990 methods of making consumers contribute at least part of the
costs were being seriously considered.
Many developing countries have water ministries or departments, district or provincial offices. These ministries are often in charge of all the sector activities, from water resources inventory to implementation and even operation and maintenance. Thus water pricing policy has an institutional linkage.
External Support Agencies
During the Water Decade of the 1980s, external support agencies started to discuss institutional and cost recovery issues and reconsider their policies. This period was preceded by high enthusiasm and general acceptance of the ambitious development goals of many developing countries (Malinen 1989). The Swedish international Development Authority (SlDA 1980) stated in its guidelines from 1980 that consumers should contribute some of the costs of rural water supply. in 1984 SlDA (1984) stated in its policy paper that the responsibility for the installations and their maintenance should preferably be with the consumers. The United States Administration of International Development (USAlD 1982) stated that consumers should pay at least the operation and maintenance costs. The Federal Republic of Germany (BMZ 1984) pointed out the need to cover at least all running expenses but hardly discussed the consumers' role. The Canadian International Development Agency (ClDA 1988) admitted that cost recovery has received very low priority in its support. ClDA pointed out that subsidies tend to bias the choice of technology, to remove basic incentive and lead to dependency on
Karko, T. Paying for Water in Developing Countries
22
government. FlNNlDA (1989) stated that one of its principles is to develop the water supply institutions so that they will be able to maintain and develop their services economically and efficiently.
in 1984 WHO and BMZ organised a consultation on the experiences of the first years of the Water Decade. Most of the agencies agreed that in rural water supply tariffs should cover at least operation and maintenance costs. The World Bank argued strongly that the costs should be covered fully to generate future resources (WHO and BMZ 1985). Soon after that, OECD (1985) stated that full cost recovery should be the long—term target. in 1987 the third consultation of external support agencies emphasized in all dialogue with developing countries the importance of cost recovery (WHO and SDCA 1987).
On the whole, there have been changes in the policies of, especially, bilateral agencies. The World Bank has traditionally insisted that all projects should be financially and economically viable. However, its water sector support has been mainly directed to urban areas, where cost recovery is easier to implement. The views of WHO have been between those of the World Bank and bilateral agencies.
2.4
Focus and Hypotheses
At the preliminary phase of the research the interest was focused on two questions. First, what types and levels of technology should be used in development cooperation projects in water supply and sanitation, so that they could be implemented under the responsibility of the national institutions? Second, what kinds of organisations would be needed to implement these projects (Katko 1987a, 1987b, 19870)? This phase is covered by papers | and ii. The study on the major constraints of water supply and policy changes in the sector aroused interest in cost recovery issues. Simultaneously, the disappointing experiences from the operation of implemented systems and other constraints stimulated interest in the historical development paths of water supply. The biggest problem in cost recovery in the rural water supplies of developing countries was found to be the lack of appropriate institutions which could enable consumers to contribute in alternative ways for covering the costs. This created the special interest on consumer—managed water cooperatives.
The constraints on water supply in developed and developing countries seem to have much in common. For alleviating these constraints and improving the service three main approaches can be distinguished. First, we can develop technology at different levels. Second, we can increase funds and other contributions for the sector. Third, we can develop organisations and institutions in charge of the sector and external support. improving any of these alone will not be sufficient, since they are closely interrelated.
Funds to the sector can be increased by additional allocations to central or local government budgets, by increases in external support or by direct payments by consumers. Any increases in government budgets based on taxation are unrealistic with the prevailing economic problems of many developing countries. Since the early 19803 external support to the sector has rather decreased than increased (Katko 1987a). Therefore, direct payments by consumers seem to be the only possible alternative.
23
Karim, I Paying for Water in Develeping Countries
The concept of sustainable development became well-known through the work of the World Commission on Environment and Development (1987), which defined the issue as follows: “Humanity has the ability to make development sustainable - to ensure that it meets the needs of the present without compromising the ability of future generations to meet their own needs".
From 1987 to 1990 WHO organised a series of informal consultations on institutional development of community water supply and sanitation with emphasis on cost recovery development. Agency-managed and community-
managed water supply were targeted partly by seperate working groups, since they are different by their nature related to cost recovery. Figure 2.2 presents a model of the approach to community-managed water supply.
RESOURCES COVERAGE IN COMMUNITY-MANAGED WATER SUPPLY
REQUIRED INPUTS
ELEMENTS OF SUSTAINABILITY
DEVELOPMENT
ICOMMUNWYlNSTUUflONS
I
1
l .-
I SKILLS
/
RESOURCES COVERAG E
INPUTS
I TIME
APPROPRIATE TECHNOLOGY
LABOUR
‘
1
[ACCEPTED SERVICE LEVEL
BO&MKREPLACEMENT
s o o
q .IVHAI'?
I [SUPPORTIVE ATTITUDES
RECURRENT INPUTS
“PUTS
SKILLS
'
9
MATERIAL & EQUIP.
CASH
o o
\fl
SELECTION OF "WHO FOR CW5
SUPPORTIVES RVI ESFIRO& ,
SHARING 0F COSTS
cemmuNéaounNE
‘ cam
WILLINGNESS TO PAY
I
[EXTENSION ACTIVITIES
REPLACEMENT OPTIONS
Framework
REGULAR CHARGES
ICOMMFUNDRMSWGI
.« Figure 2.2
WATER VENDING
—a AGENCY‘
I
L...—
IEXECUTION OF RESPONSIBILITY
of
l
WATER TAXES
sustainability
and
REINVEST
MENT
1
WHEN’
fekTERNALFUNDmG I
resources
coverage
in.
1990, community»managed water‘supply (Katko 1989 a, WHO 1988, WHO synthesized by the author)
Karko, I Paying for Water in Deveioping Countries
‘
24
The consultation identified ten key elements of sustainable water supply. There were only two elements, operation & maintenance and supportive services, requiring monetary inputs from the community. Therefore, the concept of resources coverage was introduced. This included the following inputs: time, labour, skills, material & equipment and money. The concept of cost sharing calls for the several potential sources of funding. As we move from routine maintenance gradually towards reinvestment, the relative share of communities decreases and that of agencies increases.
OECD (1988) pointed out several sustainability criteria that should be considered in appraising any development cooperation projects. Morss et al (1985) addressed the need to develop institutional capacity. A substitute is needed for foreign assistance, if the benefits of development cooperation projects are to be sustained after the external support has ended. This means that local funding must be developed.
The water supply systems constructed in developing countries have to a large extent fallen out of use because of operational problems. It is evident that unless proper water pricing policies are introduced to the water supply and sanitation sector, long-term sustainability will not be possible. if highly subsidized services are provided, only a few people will receive the service.
The “free" water policy has meant that highly centralized organisations have been solely responsible for providing water services: this policy has not allowed the creation of consumers' interest to contribute to the systems. Thus, the strategies used so far have to be rethought if we want to guarantee sustainability, to keep the systems operational, and to safeguard future extensions for the ever growing population. The governments of developing countries cannot make the required investments. Neither will the external support to the water sector increase. Therefore, the following two hypotheses are presented:
Hypothesis 1.
Water payments from consumers are a necessity in developing countries, as in the developed world, and they are possible to a larger extent than previously believed.
This hypothesis argues that water payments are a necessity if any sustainable development in water supplies are to be attained.
Hypothesis 2.
Consumer-managed water supply systems have many advantages that
could benefit the developing world.
Katko, I Paying for Water in Developing Countries
25
The hypothesis implies that it is possible to control and contain the costs of water supply services by more accurate technical design, more efficient implementation and by consumer-managed operation and maintenance. Therefore, economies of scale do not apply to small community-managed water supplies. The idea is to make better use of consumers as initiators and contributors.
Katko, T. Paying [or Waterin Developktg Countries
3 3.1
26
THEORETICAL CONSIDERATIONS Development Theories and Strategies
The concept of “evolution” refers to the spontaneous nature of, e.g., the spread of Improved water supply, whereas the term “development” is related to the change promoted by social policies. Conventionally “development" was considered to be synonymous with economic growth. The “stages of economic growth”
theories dominated in the 19505 and 19603, followed by the “structuralinternationalist ” theories in the late 19605 and the 19703 (Todaro 1982).
Development theories can be classified into three major groups: 1) modernization theories, 2) dependency theories, and 3) alternative theories (e.g., Hettne 1990). Modernization theories, born after WW II, point out that the development constraints of a country are typically internal. The theories favour the strengthening of economies and industry, often with the help of external support. Dependency theories, related to Marxist views, argue that the reasons for underdevelopment are caused by external forces. The supporters of such theories are concerned with the effects of imperialism in peripheral countries and the idea that underdevelopment must be understood in the context of world capitalism (Hettne 1990). These theories gained momentum in the 1970s. Modernization and dependency theories both stress the evolutionary nature of development, and try to explain, what “development” actually is.
Alternative theories do not try to explain, how development proceeds, but rather how it should proceed. This line of thought gained ground in the mid19705 (Hettne 1990, Max-Neef 1986). Instead of considering only the Third World, Hettne (1990) applied development theory to the “three worlds”: industrial capitalism, “real" socialism, and the underdeveloped areas. He further stressed that “there can be no fixed and final definition of development, only suggestions of what development should imply in particular contexts”. Development theory is especially concerned with cultural, political, social and economic change and therefore the theory is interdisciplinary.
Development theory is closely related to
development strategies, i.e.,
changes in economic structures and social institutions. These strategies are
usually worked out by the state (Hettne 1990). Jameson et al (1989) identified a three—ring circus of development strategies. The centre ring economists work on installing or removing price controls, on agricultural mechanization, debt restructuring, technology transfer, project evaluation or structural adjustment. The last factor means economic reforms in developing countries which limit the role of government and restore the role of markets. In one of the side rings mainstream economists expostulate on the working of the markets, the effectiveness of export promotion, the desirability of growth versus basic needs, and the centralicity of freedom. In the other side ring political economists are concerned about planning, the role of peasantry, gender and development, surplus value, social articulation, accumulation, and classes.
Water and sanitation has often been considered as one of the essential basic needs. Yet, water authorities seek to meet financial targets and consider customers, not needs, as pointed by Kirke and Arthur (1984). The risk with the basic need approach is that “the needs" would be satisfied for “free” or at a low price. if the same approach was applied to all basic needs huge amounts of funds
Katko, 7i Paying for Water in Developing Countries
27
would be needed. Besides, the basic need approach would not sufficiently consider demand. According to Max-Neef (1986) ”fundamental human needs are finite, few and classifiable, and they are the same in all countries and all historical
periods”. Max—Neef identified nine such needs: permanence (or subsistence), protection, affection, understanding, participation, leisure, creation, identity (or meaning), and freedom. From this it follows that housing, food and income should not be seen as basic needs, but rather as satisfiers of the fundamental human need of permanence.
Development strategies can be viewed from the grassroots or the central level: these views are seldom in agreement. Yet, in water supply the views of consumers and utilities need not be contradictory. Since the beginning of the lDWSSD the importance of community participation has been stressed: the
active involvement of the local population in the decision-making concerning development projects or their implementation (White 1981). Since the 19803
the role of women in development, were emphasized. These WlD issues are important to water supply and sanitation, since women are the main drawers and users of water (e.g.; Roark 1984, van Wijk-Sijbesma 1985).
UNESCO (1980, cited by Hukka 1991) used the term of the Fourth World, relating to the overgrowing problems of urban slums in developing countries.
Hukka further points out the acute need for improving infrastructure in peri~ urban areas, something that has been neglected by many ESAs. The primary problem is the high rate of population growth, especially in the developing world.
Malinen (1991) pointed out that in the long run, population growth lies on an unsustainable path and will lead to large migratory movements of people. Thus in the 19903 ESAs should actively promote population control measures.
Development theories may, however, be misleading, if they do not take into account barriers to development (Malinen 1989). Trudrill (1990) presents a sequential model on barriers to finding solutions for environmental problems. The barriers of agreement, knowledge, technology as well as economic, social and
political barriers must be overcome to reach a solution. The barriers will often, but not always, come up in this sequence. These can certainly be applied to water and sanitation, the oldest sector in environmental protection; appropriate development cooperation requires also that political and policy issues be discussed. As Malinen (1989) noted, development theorists tend to favour approaches that are in line with their political views. Malinen concluded that management of development is, above all, a political question.
The recent development in Eastern Europe has proved the limits of Marxist approaches (Hettne 1990). In water supply and sanitation the policy of “free" or highly subsidized water has failed. A high proportion of produced water goes to waste as is shown by the high per capita consumption figures, while the service standard of ultimate consumers may remain low. Many watercourses have also become polluted. This results from the lack of proper pricing of water and sewage services and the lack of rates based on actual consumption, e.g., in Estonia (Juhola 1989), the former German Democratic Republic (lWSA 1991) and Hungary (Katko et al 1981).
The approach of this study 'can be classified under the alternative development theories. Yet, the study tries to answer, what “water supply development" actually is rather than what it should be.
3.2
28
.
Katko, I Paying for Water in Devebping Countries
Basic Concepts
Scarcity and Pricing
A commodity or resource is economically scarce when it is not free, i.e., when money or some other scarce commodity has to be given up to obtain it. Therefore, scarcity gives rise to price. In any economy it is the scarce resources that are the limiting factors or constraints on development. in rich nations capital goods such as machinery and equipment are in abundant supply while human labour is relatively scarce. These nations attempt to develop labour-saving machines while in most poor nations production should be capital-saving or labour-intensive (Todaro 1982).
Price Elasticity of Demand Whether actual money prices are used the concepts of supply and demand are fundamental to all of economics. When the price of a commodity falls, people will purchase more of it. Consumers'responsiveness to price changes is described by the price elasticity of demand (9) as (United Nations 1980)
e=peLQeuLchauoeiuuamitx
(1)
=A_QLQ A P/P
per cent change in price
For a single linear demand curve (Figure 3.1) elasticity has a value equal to one
(e=1) along a locus of points at equal distances from the two axes. Elasticity value is more than one in the upper half of the quadrangle and less than one in the lower half. ln water supply the values are typically between 0 and 1, Le, in the inelastic range.
Price
e >1 (elastic) P1——--—u
l
9 '
.
decisions . and actions
[in
The natural envir—
onment
ll
production and exchange
35
individual tastes and preferences
The socio-economic system
é.
——-> I
Figure 3.4 The projected domain of institutional economic theory (Hodgson 1988, reprinted with the permission of Polity Press).
institutional economics has, according to DeGregori (1980), tried to create a logic of economic change. Technology development is not static, but brings change, the basis of future change. Thus it is argued that development and technological change must be deeply rooted in historical understanding.
Miller (1978) divided economic science into (1) resource allocation, (2) levels and rates of growth of employment, income, production, and prices, (3) income distribution, and (4) the structure of power. Normal economic science traditionally deals with the first three categories, institutionalism with the last. Since institutionalists view technology as the dynamic element in society, human intelligence is seen as the basic directive force. Hirschman (1970) introduced the concepts of exit: and voice into public services. The first concept is related to the pubiic’s ability to exit if dissatisfied with the service. The second one is concerned with whether public services differ in the degree to which beneficiaries can make their voices heard, if dissatisfied with the service. Paul (1990) developed the approach further and classified various public services into four combinations according to their level of exit and voice. His argument was that “public accountability can be sustained only when hierarchical control over service providers or agents is reinforced by the public’s willingness and ability to exit (alternative sources of supply) or to exert pressure on agents to perform (voice)”. His view was that rural water supply has low exit and low voice, whereas urban water supply has low exit but high voice.
Kat/100 HOUSEHOLDS
33
2011
1880
1900
1920
1940
1960
Figure 4.6 The diffusion of piped rural water supplies in Finland from the 1870s to the 19405 (were 1951, compiled by the author).
In today’s developed countries, the diffusion of urban water supply and sewerage has followed the same pattern. The development started in the largest urban areas and highest population densities. Demand was highly related to public health requirements. New systems were gradually extended to smaller urban centres. On the contrary, in rural areas the evolution started from small private point source systems and grew gradually into common piped systems (Table 4.1).
The Finnish Water Cooperative Model
Finnish water associations include partnerships, cooperatives, stock companies and bulk supply companies (Vii, Chapter 3). Of these, cooperatives are the most important and typical form of consumer—managed systems. The development of water cooperatives in Finland (Vll) is classified into three stages: before 1950, 1951 to 1975, and 1976 to present. Figure 4.7 summarizes the relative roles of the different parties involved in developing water cooperative-based water supply (compiled from Vll, Figure 5.1 and Appendix 4).
Karim, I Paying for Water in Developing Countries
Table 4.1
51
Development paths of rural water supply from private and
common point source systems to common piped systems.
System
Size
Technology
Managing institution
External support
Well,spring
Household Households
None None
Wellspring
lnformal
None
Piped g ravity Piped gravity/pumped Piped pumped
lnformal association Association
None
hh
E'
E‘E
3
Household One Neighbourhood A few
Well,spring
WW Many
Village
system
Wm Part of village
Several
Village
Many
Several villages
Numerous
None/Little
Association/ Governmental, Municipality municipal of varying extent
hh=household(s)
RELATIVE RESPONSIBILITIES IN ASSOCiATEGI‘éwBASED Ve’ii's’ER SUPPLY IN FINLAND % 80"
L ‘3“ \\\\ _\\\
WATER AND HEALTH AUTHORITIES MUNICIPALITY
60—
"CHAMPION" BOARD
40"
ASSO— CIATION
f CONSUMERS 20—
PRIVATE SECTOR
STAGE YEAR
18T 20000
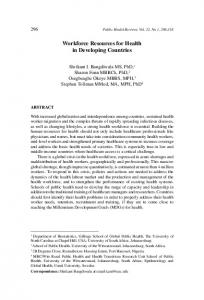
Population served
Fig. 6. Average water charges (including water consumption, meter, fixed and connecting charges for a medium size one-family house) and effluent treatment charges in Finland 1. 1.1987. The economies- of -scale seem to apply to works sewing more than 20 000 people (National Board of Waters and Environment 1987; compiled by the author).
In Finland people are used to buying spring water in plastic bags available in shops particularly in areas supplied with less tasty water. The retail price of this water which is generally believed to be of very good quality is about 2—3 FIM/l. Naturally the amount bought is fairly small. However, this indicates that people are willing to pay more for better quality water than they do at the moment. One bucket of water (10 l) supplied by a public works in Finland costs on the average only 0.06 FIM or 6 - 10—3 FIM/l which indicates the low price of water.
prices were in Sweden, the United Kingdom and the United States. In Canada and Finland the price was roughly two thirds of that in the above mentioned three countries. This survey made by National Utility Services (1987) is based on a limited sample of larger cities in the ten countries. Therefore, the comparison is only indicative. In developing countries people often pay 20 to 30 times more for vended water (transported and sold) than publicly supplied water would cost if it were available (WHO 1987).
International comparison of water prices
Cost calculation methods
In Finland the average water price including consumption, meter and fixed charges but excluding connecting charges was 2.90 FIM/m3 at the end of 1986. In Sweden the roughly respective average water price was 4.95 FIM/m3. International comparison of water prices in selected countries in 1986—1987 (Fig. 7) shows that Australia and the Federal Republic of Germany had the highest prices. The next highest
In Finland a committee for the development of municipal accounting systems called ”KULAUS” made a recommendation for public works including water supply and sewage. The recommendation is summarized in Table 4. The economic life of a water and sewage network is 30 years and declining depreciation is 10 per cent. The economic life'of the water and sewage treatment machinery and equipment is 15 years with declining depreciation
118
Kalko, Z Paying for Water in Develapbg Countries
60—
7/). 1986
7
1:} 1987
Pence per cubic
metre
so— 7 40—
so?
20-
Australia
Belgium
Eire
Canada
France
Germany
Sweden
Italy
United
USA
Klngdom
Source National Utility Services
Fig. 7. International comparison of water prices in selected developed countries from July 1986 to July 1987 based on a sample of larger cities in the countries. The prices mainly include only consumption charges (National Utility Services
1987),
Table 4. The recommendations on depreciation and economic life by the municipal accounting system ”KULAUS” for water supply and sewage works (KULAUS
eeo~
32 C:
1974).
.50.
Component
Straight line Economic Declining depreciation depreciation life
years Water supply network Sewage network Equipment and machinery of water‘ and wastewater treatment plants
percentage
percentage
40
mo~
20
fl
‘20—
30 30
10 10
3.5 3.5 -20—
15
10
share 01 overpriced works ('36)
U
1—7-1
16
6.5 ‘40. 53
.50-
tag.
at 18 per cent. The value of the capital assets is adjusted every 1—3 years due to inflation. Originally the annual interest rate of 6 per cent for investment calculation was recommended but later it was lowered to 3 per cent (Association of Finnish Cities 1982).
a
share 0! undermined works (‘19) 93
Typeol electricity plants
worksl
Number of
[works I
district heating works
water supply works
sewage works
N: 43
64:15
N=78
53:83
"(i=1
Ne“
NB=2
Nn=°
N total number 0' works N number of works with balanced income/cosmetic
Underpricing of water services
Fig. 8 presents a sample of under- and overpricing of public services (electricity, district heating,
Fig. 8. A sample of under- and overpricing of municipal services in Finnish cities in 1982. Water supply and particularly sewerage services were underpriccd (Association of Finnish Cities 1984; compiled by the author).
119
Kalko, 7C Paying for Water in Developing Coma-1‘95
69 water supply, sewerage) in Finland in 1982. The figures are based on the recommended accounting method ”KULAUS”. According to this method the vast majority of electricity plants and close to half of the district heating plants made a profit. About 80 per cent of the waterworks and over 90 per cent of the sewage works underpriced their services. The result indicates the common difficulty of achieving full cost-recovery for water services. This is, however, highly dependent on the calculation method used. If the depreciation method applied, e.g. to stock companies were utilized, the result would be more positive (Kalliomaki 1988). According to Lindblad (1987) the rate of costrecovery in Swedish water and sewage works has been 70—80 per cent during the last decade. In Finland and probably in most of the developed countries, the underpricing of water is caused by municipal political decision-making. In the developing world this constraint is often much more severe due to the policy of supplying water free of charge at least to some consumers. In Finland district heating plants are mostly owned and managed by municipalities. However, they typically recover their costs fully. The economy of water supply and sewage works can also be studied by cash flow calculations. Annual fluctuations can be quite big e.g. due to investments. Kalliomaki (1988) noticed that cash flow calculations give a more favourable result than other cost calculation methods except for the years of highest investments. Particularly in the case of developing countries van der Mandele (1987) pointed out that liquidity should be held as the basic criterion for determining appropriate rates.
Costs and income of water supply and sewage works Fixed and variable costs Gundermann (1986) has estimated the proportion of fixed and variable costs in water supply in the Federal Republic of Germany (Fig. 9). In water intake the share of variable costs, i.e. the costs
depending on consumption was under 10 per cent. In water treatment the share of these costs is about 15 per cent but in water distribution only 1—2 per cent. Thus the vast majority of the costs are fixed i.e., they do not depend on the amount of water consumed. According to Kiuru (1987) the share of
water intake
water treatment
distribution
7 150/
1‘2%
85°
[:3
variable costs
[2:3
fixed costs
Fig. 9. Relative proportions of fixed and variable costs in water intake, water treatment and water distribution in
the Federal Republic of Germany (Gundermann 1986; modified by the author).
fixed costs in water supply in Finland is 70—90 per cent. In Sweden Lindblad (1987) has estimated the respective average of 80 per cent.
Investment, running and use costs of water Table 5 shows a hypothetical calculation of the annual costs of water supply, sewerage and water use in an typical municipality of 20 000 inhabitants in Finland. Three-fourths of the total costs are created in the buildings themselves when taking into account the pipelines, equipment and devices in the buildings as well as the use of water. The latest component is mainly caused by the work (15 FI'M/h) (Peltokangas 1988). According to Korhonen (1988) in Finland investment costs’ share of the total (excluding the costs of water use) is 50—60 per cent in water supply works and about 70 per cent in sewage works. However, there is wide variation in these figures under different conditions. For example, in
japan the share of investment costs is on the average much lower than in Finland. This can be partly explained by the higher population density in Japan.
Katina, T. Paying kw Water in Dewbpmg Comtn'es
120
Table 5. Distribution of the annual costs caused by water supply, sewerage and use of water in a hypothetical, typical municipality in Finland 1.1.1986. The population is 20 000 and the water consumption is 300 l/c-d. The economic life of the buildingslis 30 years and that of machinery and equipment 10 years. Interest rate is 6 per cent (Peltokangas 1988).
(1+2+3)t
7. Pipelines in buildings 8. Water use devices 9. Operational costs related to water use (washing powder, energy, work)
(7+s+9)
Total
%
ills
Water intake (surface water) Water supply network Elevated reservoir Sewers Sewage pumping station Wastewater treatment plant (simultaneous precipitation)
a...
1. 2. 3. 4. 5. 6.
Annual cost FIM/c‘a 90 305 20 310 5
h‘(3"‘\Ol\>
Component
sale to other water
consumption charge
supply works
connectina charge no! avaanble
:3
other charges
3
100
(830)
(26)
90 230
2 7
2190
7S
(2420)
(34)
3250
100
" the share of public water supply and sewerage (note by the author)
Consideration of the cost and income structures
The varying share of the volume-based consumption charge in the income structure of water supply works in Finland has increased on the average (Fig. 10). The figure includes both the works of cities and rural municipalities. This trend exists in spite of the increasing relative amount of connecting and fixed charges (Fig. 2). Before 1974 specific water consumption was increased continuously and the present income structure was justified. Kiuru (1987) suggested that the income structure should be developed by increasing the share of non~volume based charges. This would mean increasing the relative share and level of fixed charges for water supply works. For sewage works fixed charges would demand changes in legislation. According to KUVENE (1982) the reliance on water consumption and effluent treatment charges are appropriate if the investment level or the supply area of the water works is stable. In Sweden the non-volume based charges by g water works were, on the average 11 per cent of the total in the early 1970s but in 1987 they were 26 per cent. IWSA (1982) reported respective shares of 30—40 per cent in Switzerland and 50 per cent in Italy. The Association of Finnish Cities (1982) and Lindblad (1987) have suggested that the share
Fig. 10. Trends in the income structure of Finnish water supply works in 1978-4986. The figure includes both the works of cities and rural municipalities (National Board of Waters 1979, 1981, 1983, 1985; National Board of Waters and Environment 1987; compiled by the author).
of fixed charges should not exceed one—third of the total. Gundermann (1986) has suggested a respective increase of fixed charges for the water works in the Federal Republic of Germany. The more complete the water supply and sewage networks and the wider area they cover, the less important the connecting charges. In Finland the water supply and sewage systems are mainly built already and the emphasis is now shifting more to renovation. Therefore the non—volume based char~ ges could be based, e.g. on the quantity and quality of apartments and number of occupants per apartment. Rental charges could be combined with annual fixed charges.
Subsidies or full cost-recovery? In Finland the Government has supported water supply and sewerage via low-interest loans and partial grants. The Government support is seen as important for developing large areal systems as well as for schemes in sparsely populated rural areas. In areal systems it has been typical that the longdistance water and sewage transfer mains have been partially financed by grants. This is deemed justified for controlling the need to raise water prices as well as for supporting water pollution control programmes. However, there is no direct subvention of less profitable works by more prosperous ones. Neither are there any regional or national charges
121
Kalko, I Paying for Water in Developing Countries
71
but each public water and sewage works has its own tariff system and rate. In the OECD-countries subsidies have varied greatly being, surprisingly, generally higher in Australia, japan and North America. Waste water service subsidies are, in general, higher than in water
supply. The highest subsidies exist for irrigation projects. The general trend is to decrease subsidisation (OECD 1987). In the European countries ECE (1986) noticed that as the water supply and sanitation sector develops further, it tends to become self~sup¢ porting. In Finland this situation is close because support in the form of low interest loans is only a few per cent of the total investments (Liimatainen 1988). ECE (1986) recommended that in countries with a rather incomplete infrastructure, governments should continuously support the sector. Piippo (1984) discussed the role of taxation in the sector. In Finland the private households consume 50-60 per cent of water supply, sewerage, electricity and district heating services. If these services are paid for by local tax revenues the share of costs to be covered by private households rises up to 90 per cent. The sharing of costs based on pricing water for private, industrial and institutional users would be much more appropriate. The World Bank has pointed out that subsidies do not often benefit the original target group. According to OECD (1987) the Australian and Canadian views were highly critical of subsidies because of their inefficiency. WHO (1987) concluded that the typical policy in developing countries of supplying water free of charge means in practice that service cannot be extended to others.
How to increase water charges?
In developed countries such as Finland there is a trend toward regional and national management of local water supply and sewerage systems. Hanke (1981 b) noted that in that kind of situation intersystem equalization policies are developed. It means that all customers in a certain customer class pay the same price per unit volume regardless of their location. Hanke’s view is that equalization discriminates against systems that control their costs and favour those that do not. According to National Utility Services (1987) there are plans in the United Kingdom to do away with general rates which have involved equalization within regional water authorities. The author’s view is that in most cases con~ sumer prices based on full cost~recovery are the
most efficient and also the most equitable alternative. There still exist several instances where partial subsidization can be considered beneficial. The author agrees with Daily et a1 (1988) who have found that people are willing to pay a fair price for something they value. Daily et al introduced a public education campaign to promote the acceptance of rate increases. There were three distinct groups: direct consumers, elected officials and the media. Each group had its own unique requirement for information. With this approach a 45 per cent increase in rates was achieved without public opposition. Particularly in the developing world it is often difficult to raise or even introduce water prices. Politicians often tend to use water services as a means to get votes. Thus the need for public education in those conditions is even higher. About thirty years ago Murdoch Jr. (1956) did a historic review of water pricing in the USA. His conclusion was that water has traditionally been too cheap. Low rates and poverty of water works have meant that customers have not been able to get service when wanted. The author’s view is that the criticism is still partly true. In developing countries this problem is very serious.
DISCUSSION AND CONCLUSIONS
Water pricing in developed countries The following conclusions can be drawn on water and sewage charges in Finland and some other de» veloped countries: (i) Water and sewage charges have some effect on water consumption patterns and wastage. Water metering for individual houses is (ii) getting more popular. In this respect Fina land is quite advanced. (iii) In 1977—4986 the water charges in Finland stayed practically the same whereas sewage charges increased in real terms. (iv) In Finland the maximum water consump tion charge is about 20 times the minimum charge. The respective variation in sewage works is about 10vfold. (v) Volume-based water prices in Finland are lower than in most other OECD-countries. (vi) Three—fourths of the total costs of water are created in the buildings themselves when taking. into account the pipelines, equipment and devices in the buildings as well as the use of water. From this viewpoint water is a very cheap commodity in Finnish conditions.
122
Katko, T. Paying Ior Warer in 08W Countries
72
(vii)
Water supply and particularly sewerage services have been underpriced in Finland, whereas electricity and district heating have been overpriced. Cost-recovery is, however,
(viii)
(iX)
highly dependant on the calculation method (interest and depreciation). In Finland and a number of other OECDcountries about 80 per cent of the total costs are fixed, i.e. independent of water consumption. Increasing the share of fixed charges in Finland should be considered although the local conditions should be decisive.
tered water. However, when applied to the poorest users in the urban fringe and rural areas regional tariffs can be considered jus~ tified. (xii) Charges based on consumption decrease wastage of water which is important particu~ larly in areas with scarce water resources. (xiii) Seasonal and increasing block tariffs could be considered for the dry season. (xiv) Municipal and industrial sewage charges should be taken into use also in developing countries.
In areas with scarce resources, a tariff
structure of increasing blocks should be considered to avoid water wastage and to secure efficiency. In Finland water and sewage charges will be fairly low also in the future due to the general availability of water resources. It is, however,
evident that consumers would be willing to pay more for better quality water.
ACKNOWLEDGEMENTS This paper is part of a research project financed by the Finnish International Development Agency (FINNIDA). The author wishes to thank Prof. Matti Viitasaari and the colleagues from Tampere University of Technology as well as several Finnish experts for their contribution and comments on the paper. Special thanks go to Mr. L. Laugeri from WHO, Geneva and Mr. P. Jalkanen from the
Implications for the developing world In the developing countries it has been common to try to supply water free of charge for some categories of users. Laugeri (1987) noted that the problem is generally no longer whether to charge but of deciding to what extent the costs should be covered. Everyone should pay their share but not necessarily the same amount, in the same form or at the same time. The experiences of developed countries cannot naturally be directly transferred to the developing world. In fact Warford 8C julius (1979) pointed out that there is much that technologically advanced countries facing the problem of scarce water resources can learn about water pricing in the developing world. The author agrees but also believes that the findings of this study on the experiences in Finland and other developed countries indicate some of the key constraints and possible paths of development such as: (x) In general, water is not a free commodity in developed countries and consumers pay at least a part of the costs. Taxation is often less equitable than direct consumer charges. (xi) The rate of water charges should be related to the real costs of water production. A national or regional tariff does not take into account the differences in local conditions and is therefore not recommended for me—
Association of Finnish Municipalities for reviewing the article.
TIIVISTELMA Artikkeli kasittelee vesi— ja jatevesimaksujen kehi— tysta’ Suomessa ja eriiissii muissa kehittyneissa' maissa. Tami osaselvitys liittyy kirjoittajan laajempaan tutkimushankkeeseen, joka tarkastelee kus-
tannusvastaavuuden merkitysta vesihuollon toimivuudelle kehitysmaissa. Suomen, kuten monen kehittyneen maan, olois-
den kulutusta. Suomen kaupunkien vesilaitosten tulot perustuvat la'hes yksinomaan vedenkulutus~ maksuihin ja jateveden kayttomaksuihin. Kuntien vesi- ja viema'rilaitoksilla saadaan noin kolmannes tuloista liittymismaksuilla. Vedenkulutus- ja kayt— tomaksut ovat Suomessa nykyisin kaytannollisesti katsoen kulutusma'arista riippumattomia. Viimeisen vuosikymmenen aikana vedenkulutusmaksut ovat pysyneet reaalisesti samalla tasolla. Jateveden hiyttomaksut ovat reaalisesti kasvaneet. Suurimman ja pienimman vedenkulutusmaksun ero Suomessa on noin 20-kertainen ja ja'teveden kayttomaksun ero vastaavasti noin 10~kertainen. Useimv missa tapauksissa vesilaitokset ja erityisesti viemariv laitokset ovat alij amaisia'. Tami riippuu kuitenkin ratkaisevasti kaytetyist'a koron ja poiston lasken— tamenetelmista‘. Suomessa vedesta’ peritta'va't mak-
Kafka, T. Paying for Water in Developing Countries
sut ovat alhaisempia kuin useimmissa OECD-maissa. Kehittyneiden maiden kokemukset veden hinnoittelusta eivat sellaisenaan ole siirrett'avissa‘ kehitysmaihin, mutta ne antavat kuitenkin pohjan mahdollisille kehityspoluille.
REFERENCES Association of Finnish Cities. 1982. Liikelaitostyoryhmiin loppuraportti. (Final report of the committee on municipal enterprises.) Publication C 47. (Original in Finnish). Association of Finnish Cities. 1984. Kaupunkien maksupoliittiset tavoitieet. (The financial policy objectives of cities.) Publication C 63. 24 pp. + 12 Appendices. (Original in Finnish). Association of Swedish water and sewage works. 1987. Va— taxor 1987. (Water and sewage charges.) Report VAV TX87. 48 pp. (Original in Swedish). AWWA (American Water Works Association). 1984. Rates, health research top list of national water
problems. Mainstream, Nov. 1984. Cited by Grigg, N. S. 1986. Urban water infrastructure: planning, management and operations. John Wiley 86 Sons. 328 p. Carver, P.H. 8: Roland, J.J. 1980. Short- and long-run effects of price on municipal water use. Water resources review. 16.4: 609—616. Daily, J., McKinley, L. 8L High, T. 1988. Educating the public about sanitation rate increases. Journal WPCF. 60.2: 180—183.
Katko, T. 1986. Major constraints in water supply in developing countries. Aqua Fennica. 16,2: 231—244. Kiuru, H. 1987. Vesi- ja viemirilaitosten taloudenpito.
(Financial management of water supply and sewage works.) Rovaniemi 10.12.—11.12.1987. Vesihuoltoliit— to. 6 pp. (Original in Finnish). Korhonen, M. 1988. Personal communication. KULAUS (Kunnallisen laskentatoimen uudistamistoimi— kunta). 1974. Paaomakustannuslaskentasuositus. (Recommendation on investment cost calculation.) Re» port no. 2174. 47 pp. (Original in Finnish). KUVENE (Kunnallisen vesihuollon neuvottelukunta). 1978. Vesi- ja viemarilaitosten kuluttajamaksut ja talous 1976—77. (Consumer charges and economy of water and sewage works in 1976—77.) 86 pp. + S Appendices. (Original in Finnish). KUVENE (Kunnallisen vesihuollon neuvottelukunta). 1982. Vesi— ja viemiirilaitosten taksat ja taksarakenne. (Tariffs and tariff structures of water supply and sewage works.) 32 pp. (Original in Finnish). Laugeri, L. 1987. Water for all~who pays? World health forum. Vol. 8: 453—460. Liimatainen, J. 1981. Vesi- ja viemfirilaitosten maltsuista ja taloudesta. (On the charges and economy of water supply and sewage works.) Suomen kunnallislehti. 66.17: 8—9. (Original in Finnish). Liimatainen, J. 1988. Personal communication. Lindblad, N. 1987. Va‘taxor. Trender och problem.
(Water and sewage charges. Trends and problems.) In: Svensson, H. (ed.) 1987. Ekonomi i VA-verksamheten. (Economics of water supply and sewage works.) Association of Swedish water and sewage works. Report VAV M57. 75 pp. (Original in Swedish). Lobb, PL]. 1975. Demand-rate economics. Journal AWWA. 67.5:246—250.
ECE (Economic Commission for Europe). 1986. Water supply and waste water management in changing economies. Committee on water problems. ECE/ Water/45. 11 pp.
van der Mandela, H.C. 1987. Liquidity maintenance as a basic criterion for the determination of appropriate potable water rates. Background paper. In: WHO.
Erki'o, E. 1983. Lampiman kayttoveden huoneistokoh-
Mann, RC. 1987. Reform in costing and pricing water. journal AWWA. 79.3: 43—45. Miller, J.W. 1984. Old water — new water: setting equitable water rates for suburban customers. Journal
tainen laskutus. Kokemuksia perusparannuskohteista. (Experiences on charging for hot water consumption in renovated buildings.) Energiataloudellinen yhdistys. Raportti 9/1983. 33 pp. + Anneces. (Original in Finnish, Abstract in English). ETLA (Elinkeinoela'man valtuuskunta). 1987. Suhdanne. (Economic prospects.) 1987/3. 158 pp. (Original in Finnish). Gibbs, K.C. 1978. Price variable in residential water
demand models. Water resources research. 14.1: 15— 18.
Gundermann, H. 1986. Water tariffs as an instrument to influence demand. 18 pp. Hanke, S. 1981 a. On the marginal cost of water supply. Water/engineering 8: management. 128.2: 60—63. Hanke, 3.1-1. 1981 b. On water tariff equalization policies. Water/engineering 8?. management. 128.8: 33—34. IWSA (International Water Supply Association). 1982. Cost structure and charges. General report 4. IWSA conference in Zurich, Switzerland. Kalliomaki, M-L. 1988. (Draft). Kuntien liikelaitostoiminnan ja kiinteistonhoidon tavoitteellinen kehitt'a— minen. (Development of activities of municipal enterprises and building management.) (Original in Finnish).
1987.
AWA. 76.9: 34—41.
Murdoch Jr., J.H. 1956. 75 years of too cheap water. Journal AWWA. 48.8: 925—930. National Board of Waters, Finland. 1979—1986. Vesihuoltolaitokset. (Water supply and sewer systems.)
Reports no. 163, 180, 195, 214, 223, 240, 249, 261, 279.
(Originals in Finnish, partly in English). National Board of Waters Finland. 1986 b. Vesi« ja viemarilaitosmaksut. (Water anad sewage charges.) 1.1.1986. Vesihallituksen monistesarja no. 441. 38 pp. (Original . in Finnish). National Board of Waters, Finland. 1986 b. Vesi« ja vie— mirilaitosmaksut. (Water and sewage charges.) 1.1. 1986. Vesihallituksen monistesarja no. 441. 38 pp. (Original in Finnish). National Utility Services. 1987. International water price comparison. 12 p. OECD, 1987. Pricing of water services. Paris, France. 145 pp.
Peltokangas, J. 1988. Vesihuollon talous. (Economics of water supply and sanitation.) Tampere University of
124
Kafka, T. Paying for Water in Developing Countries
74
Technology, Construction economics. Publication no. 1988/3. 93 pp. + Appendices. (Original in Finnish). Piippo, R. 1984. Maksu- ja taksapolitiikan vaihtoehtojen vaikutukset. (The effects of alternative tariff policies.) Teknisten lautakuntien tiydennyskoulutuspiiviit. Sa— vonlinna 6.——7.3.198{r._ 4 pp. (Original in Finnish). Rosengrén, R. (Unpublished). 1981. Veden kulutuksen ja asukasluvun kehitys Turussa vuosina 1977—4980. (Trends of water consumption and population growth in the city of Turku in 1977—4980.) Tutkimustiivistelmfi. 3 pp. (Original in Finnish). Schlenger, D.L. 1986. The application of zonal pricing to a metropolitan water utility. Doctoral dissertation. University of North Carolina at Chapel Hill. 247 p. Turvey, R. 1969. Marginal cost. Economic journal. June
1969.
United Nations. 1980. Efficiency and distribution equity in the use and treatment of water: guidelines for pricing and regulations. United Nations. Natural resources/Water series no. 8. STIESA/103. 175 pp. Warford, J.]. 8i Julius, D.S. 1979. Water rate policy: lessons from less developed countries. journal AWWA. 71.4: 199—203.
WHO. 1987. Cost recovery in community water supply and sanitation. Report of the second informal consultation on institutional development. Geneva, 5.-—9. October 1987. WHO/CWS/SZS. 41 pp. Received 25 july 1988 Accepted 5 August 1988
Karko, I Payinn Water in Developing Countries
125
IV
PUBLICATION IV Katko, T., 1990. Cost Recovery in Water Supply in Developing Countries. Water Resources Development. 6,2:86-94.
This article was first published in the lmerngflgnal nrnal pf Wager Re§our§e§ Develgpmem, Vol 6, No 2, June 1990. pp 86-94, and is reproduced here by kind permission of Butterwor’th-Helnemann Ltd, Oxford,
UK.
127 s Kama, I Paying for Water in Developing Countrie
Cost recovery in water supply in developing countries Tapio S. Katko
This article discusses trends in cost recovery policies, costs, consumers’ ability and
willingness to pay, water tariff structures, fee collection andfinancial management. Cost recovery, operational technology and appropriate institutions are the key requirements of sustainability. Commonly practised water vending and reselling, while a good indication of actual willingness to pay for water, is a very costly system. In practice free water supply benefits the rich. Progressive tariffs and innovative collection methods should be used instead.
Many developing countries have considered water supply a social service since their independence. This has meant adopting a policy of supplying water free or almost free of charge. External support in water supply has concentrated on constructing new schemes, an attractive option in many respects but one which has meant that the operative level of existing schemes has deteriorated. If already constructed schemes were kept operative, many devel— oping countries would have no funds left for new investments. To be able to introduce cost recovery, some basic conditions must be fulfilled. Firstly? prices must be affordable to consumers but they should also reflect the state of the national economy. Secondly, con— sumers must be willing to pay for water services. Thirdly, appropriate water charges and tariff structures must be developed. Fourthly, the charges must be collected and channelled into the intended uses (see Figure 1).
Tapio Katko is a Research Fellow at the Institute of Water and Environmental Engineering (IWEE), Tampere University of Technology (TUT), Box 527. 33101 Tampere, Finland.
This paper is based on the author’s recent study funded by Finnida. He expresses his sincere gratitude to Professor M. Viitasaari (TUT) for continuous encouragement and supervision
of the study. He wishes to thank Dr C. van Wijk-Sijbesma from the IRC and Mr L. Laugeri from the WHO for reviewing an early
draft of the paper.
86
KEY ELEMENTS OF COST RECOVERY
COSTS OF WATER SUPPLY
i
WHAT '2
)
PREDICTABILITY OF CONSUMER CONTRIBUTIONS
i WATER CHARGES AND TARIFFS
FEE COLLECTION AND FINANCIAL MANAGEMENT
FROM WHOM '2 -——( WHEN ?
)
~——( HOW 7
)
Figure 1. Approach to cost recovery with sequential key elements,
At the beginning of the International Drinking Water Supply and Sanitation Decade cost recovery issues were given little attention. In 1980 the United Nations prepared guidelines for water Charges and regulations. They recommended the ‘users pay cost of service’ principle for household and industrial water. In 1984 a consultative conference on the experiences of the first years of the Water Decade was organized. Most of the participants agreed that in rural areas water supply tariffs should cover at
0790-0627/90/020086-09 © 1990 Butterworth & Co (Publishers) Ltd
Katha, 73 Paying ax Water in Der/emery Cmmuies
128
Cost recovery in water supply in developing countries: Tapio S. Karko
least operation and maintenance costs, whereas the
World Bank argued strongly that costs should be covered fully to generate future resources. During the first part of the decade some bilateral agencies such as the Federal Ministry for Economic Cooperation (BMZ) of FR Germany, the Swedish International Development Authority (SIDA) and the United States Agency for International Development (USAID) stated in their sector policy papers that at the least all running expenses should be covered. However, by 1988 the Nordic bilateral agencies had implemented this policy only to a minor extent, if at all. As regards non-governmental organizations (NGOs), missionary organizations have a long tradition of requiring initial contributions from consumers before starting any develop»
ment projects. The third international conference of external support agencies was held in lnterlaken, Switzerland, in October 1987. About 30 external agencies attended, and six key concepts were identified, cost
recovery being one of them. It was agreed that in urban areas full cost recovery is a long-term objective and in the short run operation and maintenance costs, including replacement of equipment, should be recovered, at least. in rural areas the beneficiaries should gradually assume responsibility for operation and maintenance and in the long run for the replacement of equipment (WHO and SDCA,
1987). Since 1985 the WHO has organized a number of conferences on institutional development with the focus on cost recovery. Principles and models have been presented separately for agency—based and community—based systems (WHO, 1989). As point— ed out by Laugeri (1987), the problem is no longer whether to charge but deciding to what extent costs should be covered by consumers. During the last few
years many external support agencies and governments in developing countries have reconsidered their cost recovery policies and started seriously searching for means of implementing cost recovery in practice. In a way this can be regarded as one of the main achievements of the Water Decade.
What costs should be covered?
The WHO (1986) gathered per capita construction and operation data for several types of technologies in different regions of the world. The individual countries’ per capita and per unit costs showed very large variations. The median construction cost of rural schemes was about $40 per capita compared to
figures of $55 per capita in urban standposts and $80 in urban house connections. Based on different
sources Okun (1987) concluded that a system with public standposts and pit privies costs $5~10 per capita annually. The large variation in costs can be partly explained by different conditions and partly by different calculation methods. The actual costs may be underestimated since not all the compo— nents, eg personnel costs, are included. Cost data must therefore be regarded sceptically. Selection of service standard determines costs. The selection depends on overall development tar~ gets. in a technical sense the design criteria and the level of technology are decisive. In rural areas water consumption is often far less than the commonly used design value of 30 l per capita per day in handpump and public standpost systems. The same is often true with a higher service standard. Since 50—80% of the costs of construction are attributable to the network, it' should not be overdimensioned.
On the other hand, due to leakage and other wastage the values have to be on the safe side. The costs of the selected technology can be con« tained by (i) intersectoral action, (ii) decentraliza‘ tion, (iii) privatization and divestiture, (iv) metering and minimizing non>revenue water, (v) preventive maintenance, and (vi) community-managed oper~ ation and maintenance. The concept of preventiv' maintenance can be difficult to introduce in developing countries due to the lack of a ‘future orientation’ among consumers. Through community management it is possible to save some costs due to the decrease in the need for professional staff and mobile transportation.Besides, community management can increase the sense of ownership and responsibility among the users, thus improving their willingness to maintain the system.
Affordability and willingness to pay It has often been stated that the cost of water supply should not exceed 5% of family income. Yet there is no actual evidence for the feasibility of this ‘rule of thumb’; moreover, the use of such a figure is queSo tionable, as noted by Saunders and Warford (1976). The ‘ability to pay’ criterion can, at best, be only a broad guideline and represents an external assess— ment (WHO, 1989). Detailed socioeconomic surveys are too laborious for practical water supply planning, but quick hous— ing and housing material surveys could at least be made. The market value of a house in developing countries correlates roughly with the average annual income of an extended household. In developing countries such as Kenya and Tanzania agriculture and livestock raising increase the potential ability to pay for water. Affordability and payment of water
WATER RESOURCES DEVELOPMENT Volume 6 Number 2 June 1990
87
129
Katko, I Paying for Water in Developing Countries
Cost recovery in water supply in developing countries: Tapio S. Katko
rates are closely related to income generation by women. In economics a consumer’s willingness to pay is defined as the maximum amount he or she would be willing to pay for a service rather than do without it. Recently it has been strongly argued that it is not affordability but consumers’ willingness to pay for water that is crucial.
Vending and reselling The widespread practice of water vending in today’s developing world indicates a high level of affordability and willingness to pay for water. Although vending (transporting water and selling it to consumers door-to—door) is an old tradition all over the world, fairly little attention has been paid to its role in water supply. Recently the Water and Sanitation for Health (WASH) project has carried out studies on water vending in a number of countries. These studies show that substantial amounts of money are spent on vended water. Vendors do not, however, earn large profits (Whittington, Briscoe and Mu, 1987;
Whittington et al, 1989). Reselling of water in this context means selling water from a private connection or source without any controls. Customers typically come and collect their water from resellers. The prices of resold water are high enough to cover the costs of the resellers but typically lower than those of vended water.
Other methods of predicting user payments Consumers’ willingness to pay for water can be predicted by: (i) asking consumers in advance about their own estimate of their future willingness; (ii) looking at the previous actual behaviour of consumers in similar or related fields; or (iii) monitoring consumers’ actual behaviour in real situations. The first option can investigate general willingness or use specific preplanned questionnaires such as the con-
tingent valuation (CV) method. The second option
can include: improvement of housing facilities by inhabitants (part of the affordability criterion), tra— ditional water vending and reselling, source selec~ tion criteria, or services in similar geographic areas, eg parallel surveying. Contingent valuation method This method asks households or consumers directly to state their willingness to pay for water, or their likely reactions to price changes. It has commonly! been asserted that this kind of questionnaire approach in estimating an individual’s willingness to 88
-
pay is useless (eg Saunders and Warford, 1976). According to Whittington, Briscoe and Mu (1987) a study in Haiti was the first systematic attempt reported to apply the CV method to estimating willingness to pay for a public service in developing countries. The method was still in 1989 being tested in Nigeria and Brazil. It has several advantages compared to other methods. It is inexpensive and quite fast, which is particularly important in developing countries. Nevertheless, a number of studies support a fairly critical view of the reliability of the CV method. There has been and still is a fair amount of scepticism about whether consumers are able and willing to give reliable answers. In rural areas with only communal water points, decisions are made by the community rather than by individual households. However, the reliability of the method should be
compared with that of other tools of water supply planning. For instance, design criteria for specific water consumption are often overestimated. By accumulating experience of the CV method and comparing the results with actual consumer behaviour, it may be possible to make limited indicative
predictions.
Actual behaviour
There is some evidence that people are more willing to pay for a piped than a point~source water supply. The level of service and the willingness to pay have probably quite a lot to do with the cultural and social values of a given community or individual consumers. In many cases consumers’ willingness has more to do with attitudes than their ability to pay. In the developing world, even in quite primitive conditions, people are willing to pay a lot for different types of rituals which they find important. The author’s view is that an individual’s willingness to pay changes with time and is difficult to predict in changing situations. Overall willingness to pay increases with time along with practical exper~ ience gained. Decision making by an individual does not necessarily follow externally rational economic rules; consumers have their own criteria in source selection. Reviewed against their own background and values their decisions can, however, be regarded . as rational. There are a number of possible factors which can affect an individual’s willingness to pay (see Figure 2). These can include policy, environment, techni— cal, economic and financial, social and cultural,
personal as well as administrative and organizational factors. The impact of each factor can vary a great deal and is subject to prevailing conditions. In practice, the consumer applies only one or two criteria to
WATER RESOURCES DEVELOPMENT Volume 6 Number 2 June 1990
Katko, T. Paying for Water in Developerg Countries
130
Cost recovery in water supply in developing countries: Tapio S. Katko
Range of effect
Factors
2
3
4
5
Encouraging factors
Reliable water supply.
T
Introduction of house connection...................................... T
Availability of water for productive use
T
Reliable fund collection.................................................. F
Consumer involvement.................................................... 5 Sense of ownership regarding water pomt
C
VIII/Ill
M W W W. W
Strong community leadership........................................... A
Distance to improved source less than to traditional ones... E
Piped supply to courtyard................................................ T
S
Privacy of water drawmg
Relatively neutral factors
High quality of supplied water
T
Handpump wells and similar systems................................ T
Women as fee collectors.................................................. 5
Religion.........
.
Formal education level.
5 C
Factors strongly dependent on conditions
Household income
F 1
Tradition of fund raismg
S
Earlier personal experiences............................................. C 3
Discouraging factors
Earlier or present "free water policy"............................... P Distance to improved source more than to traditional ones. E
Intermittent, unreliable supply
T 13
Unreliable fund management........................................... F ” Time delays between fee collection and working servicem. T Non—involvement of consumers......................................... S
Lack of sense of ownership regarding water point............. C‘ Weak community leadership............................................. A Figure 2.
A list of factors and the possible range of their effects on consumers’ willingness to pay for water in rural
areas of developing countries. Key: 1 very discouraging, 2 discouraging, 3 neutral, 4 encouraging, 5 very encouraging.
Type offactor: A = administrative, C = consumer-dependent, E 2 environmental, F 2 economic and financial, P a policy,
S = social and cultural, T = technical. Source: Katko (1989), based on open-ended interviews of 30 persons.
WATER RESOURCES DEVELOPMENT Volume 6 Number 2 June 1990
89
131
Katko, T. Paying for Waten'n Del/show Countries
Cost recovery in water supply in developing countries: Tapio S. Katko
his or her decision, but these criteria are different in different cases (Rinne, 1989', Simon, 1958).
Consumers’ willingness to join the system Surprisingly, the willingness-to-pay criterion has often been considered to cover regular payments only. In the case of piped supply with individual connections, the decisive factor is the willingness to join the system. When people see that the system will be realized, their willingness to join increases. This typically happens during and after construction. Once people have joined the system by paying a connection fee, their willingness to pay for actual consumption is self~evident. Thus the willingness-to' pay criterion is more valid for covering recurrent costs on a regular basis whereas the willingness—t0join criterion involves investment costs.
Charging and fee collection in agencymanaged systems Water charges are meant to improve or guarantee
general trend is away from decreasing block pricing in the developed countries. Experiences from Japan and Italy show that progressive tariffs have reduced water consumption quite dramatically (OECD,
1987). In 1983 the WHO (1986) made a study of the use of tariffs in developing countries. In the Americas over 80% of countries used progressive tariffs. In the Eastern Mediterranean and Southeast Asia the figure was about two thirds. In Africa more than half of the countries and in the Western Pacific region about 40% used progressive tariffs. In the late 1970s Chappey (1980) made a survey of water tariff systems, mainly in Francophone Africa. In eight of 23 countries increasing block charges, and in five countries declining block charges, were used. The two surveys indicate the increasing trend towards progressive tariffs in Africa. They also indicate that tariff structures in developing countries apply efficiency criteria relatively more than in developed countries.
allocative efficiency, equity, financial'requirements, public health, environmental efficiency, acceptability and understanding, simplicity, employment, etc. These objectives are at least partly contradictory, therefore some compromises are evidently needed. Charges can be levied according to the capacity reserved for each customer or according to actual water use. The first option means charges based on property values whereas the second typically involves metering of actual water consumption. In the first case fiat~rate charges are used. The second case can include a uniform consumption charge, a declining or increasing block tariff, a minimum charge or fixed charge and different combinations of these.
Minimum block consumption In the case of progressive tariffs the minimum con— sumption of the lowest block is of special interest. The author’s view is that in developing countries the minimum charge should be based on consumption of about 3—5 m3 per household per month, which in the case of a ten~member household corresponds to a per capita consumption of 10—15 1 per day. This is valid mainly for consumers relying on public stand— posts. However, examples from different developing countries (eg Chappey, 1980) show that the mini— mum consumption criterion is often much higher. It is probably based on design criteria instead of actual consumption. In practice no water tariff should cone sist of too many blocks, otherwise the calculations and administration will be too complicated and
Flat rates
costly.
Since flat rates are not related to the amount of water used, they typically lead to wastage. However, flat rates are simple to administer and revenue collection is fairly easy.
Declining and increasing blocks In the USA declining block rates have been most popular. This tariff structure was aimed at giving an incentive to industries which use large quantities of water. Since large water users have lower peak factors, decreasing block rates have been considered justified. The relative share of declining block rates has fallen, but the method is still overwhelmingly used in the USA. In Canada fixed charges and decreasing blocks are almost exclusively used. The 90
Level of water charges The low level of water charges and the lack of continuous adjustment of tariff level are big constraints in developing countries. Any increase in water charges must typically be decided at cabinet or other high level. Water agencies should have adequate autonomy to adjust tariffs when necessary. Such an arrangement has been achieved by the Zairean water supply authority, for example. In developing countries geographically uniform national tariffs are typically used. Saunders and Warford (1976) noted that the pressure towards these charges is caused by emotional appeals and by the consolidation of the water authorities into large
2 June 1990 WATER RESOURCES DEVELOPMENT Volume 6 Number
Karat Whammoevmym
132
Cost recovery in water supply in developing countries: Tapio S. Katko
regional or national water boards. Thus we face institutional questions. However, geographically uniform tariffs do not take into account differences in local conditions and the production costs of water. If less efficient systems were cross-subsidized by the more
efficient
ones,
total
tariff
levels
would
increase. Yet in the case of the minimum consumption category geographically uniform tariffs are justifled. Tariff structures should be such that the minimum consumption by the urban and rural poor is cross— subsidized by other consumer groups. Water should not be free to any group of consumers except in emergency cases. Even a small charge can be important to avoid wastage of water. For higher consumption progressive tariffs should be favoured.
Metering Today’s developed countries show interesting trends in water metering. The International Water Supply Association (IWSA) made a study of water prices in their member countries. A clear majority of water charges were based on metering of individual connections. Norway and the UK are exceptions where 95% and 99% of the charges are based on estimates instead of metering (Stadtfeld and Schlaweck, 1988). Due to intermittent supply, metering is often difficult in developing countries. In water intakes and treatment plants master meters should be used. For the waterworks it is important to know, at least, the
biggest consumers (macro»metering). Metering of individual connections is a further step in develop—
ment. Fee collection and financial management
In agency—managed water supply systems banking facilities are normally available, and thus payments can be regular, mostly on a monthly or bimonthly basis. Instead of actual fee collection the problems are more often related to inefficient billing, meter reading and accounting management. In billing cubic metres and gallons can be mixed up. Moreover, there are a number of examples where highly paid officials do not pay their own water bills. This can be explained either by their powerful position or by the lack of a disciplinary management and disconnection policy.
Charging and fee collection in communitymanaged systems In community-managed systems the biggest con— straint upon cost recovery is often the non—existence of banking facilities and the non—applicability of ‘conventional’ fee—collection systems. The primary options for fee collection include community fundraising, regular charges, spot cash payments and down payments. Figure 3 gives a summary of these options. The approach is a modification of the one presented by van Wijk-Sijbesma (1987).
PRIMARY OPTIONS FOR FEE COLLECTION COMMUNITY FUND RAISING
REGULAR CHARGES
SPOT CASH PAYMENTS
° VOLUNTARY FUNDS
' ANNUAL
I GENERAL COMMUNITY REVENUE
' SEASONAL
COMMUNITY MANAGED WATER POINTS
- QUARTERLY - MONTHLY OR
INSTITUTIONALIZED
' PRODUCTION COOPERATIVES I WATER SUPPLY COOPERATIVES
BI-MONTHLY
DOWN PAYMENTS ' LUMP SUM
° MEMBERSHIP FEE
WATER KIOSKS
I WEEKLY
VENDING COIN-OPERATED
0 DAILY
KIOSKS
‘ REVOLVING FUNDS
SECONDARY OPTION INDIRECT TAXATION
Figure 3. Primary options for financing community-managed water supply in developing countries include community fundraising, regular charges, spot cash payments and down payments. Taxation is regarded only as a secondary option. WATER RESOURCES DEVELOPMENT Volume 6 Number 2 June 1990
91
133
Katko, I Paying fix Water in Develoy'ng Countries
Cost recovery in water supply in developing countries: Tapio S. Katko
Community fund-raising Community fund-raising can be realized through voluntary activities or the use of general community
revenue, production cooperatives, water cooperatives or community revolving funds. Community contributions in the form of time, labour, skills and
materials are important. However, this paper concentrates on the monetary contributions. Voluntary funds can be raised by local leaders,
community groups or a water committee. Consumer contributions are in principle voluntary, but success can vary a great deal. The methods used can include,
for example, lotteries and entertainment. In some cases voluntary fund-raising has been used for political purposes and due to misuse has decreased consumers’ willingness to contribute. Besides, these funds may create a problem of continuity. In some countries communities are used to managing their own enterprises such as the communal field, village shop or flour mill. Because water is not necessarily considered a high priority, this reve— nue tends to be used for other purposes. The reve— nue may fluctuate and be quite uncertain. Production cooperatives are typically based on the production of one or a few products such as tea and coffee. Their management and organizational exper— ience could be utilized in water supply development at a later stage. The disadvantage of this approach can be that cooperatives function on the basis of shared economic interest, and therefore the service
might not necessarily be extended to everyone in need of it. In water supply cooperatives each member has one vote and contributes accordingly. The cooperative board takes care of practical management, possibly assisted by a part-time manager. Each member pays a membership (connection) fee, an annual fee and a metered or estimated consumption fee. It has been reported that water supply cooperatives in developing countries are common at least in Argentina, Bolivia and Chile, in the Philippines and in the Middle East. A revolving fund is formally defined as a fund that is continually replenished as it is used by income generated by the activity that it finances. A revolving fund can be established at the national, regional or community level. It aims at financing individual community projects. The funds that are loaned out are recovered by the beneficiary community. The repayments are reloaned for financing other projects.
paid for once a month. In community-managed systems meter reading and billing can take place less frequently. In the rural areas of developing countries the cash available to consumers, farmers and cattle
owners often depends on the time of year. In such cases seasonal charges could be considered. However, once unpaid charges accumulate into a large sum there is the risk that consumers will come to regard the total as beyond their means. Instead of individual house connections consumers can have a common connection. A group of users is collectively responsible for paying the bill and decides how to divide the costs. Spot cash payments Spot cash payments are charged by systems based on vending, reselling, water kiosks or coin—operated
standposts. In spite of its wide use in developing countries, the existence of vending is often underes— timated. The existence and limitations of vending should be honestly admitted. Water kiosks can be run on a commercial or a community basis. For instance, in Burkina Faso the urban water company has introduced a strictly managed system where non~ payment will be immediately punished. In many countries public toilets and baths are managed by permanent caretakers who maintain the facilities and collect the spot fees paid by customers. Toilets are located near railway stations, bus stops, markets, hospitals and other busy places. In Thailand the Provincial Waterworks Authority had a pilot project on developing coin—operated stand— posts. Instead of coins some countries have introduced ticket systems. There are also a number of examples of vandalism against these selling units. These machines are viable if maintenance and control at a reasonable distance can be organized. Down payments Initial contributions by consumers or communities can be monetary or non-monetary. The first types are here called down payments. They can be lump sums, for instance, for maintenance or spare—part purchase. They can also be membership or connec~ tion fees such as those charged by cooperatives. However, down payments can cause problems. The government is not necessarily able to give support to all those who have paid lump sum contributions. Another drawback could be that down payments do not introduce the idea of permanent payments to
consumers.
Regular charges
Taxation
The convention has been that water is billed for and
A taxation system is simple to use if all households
92
~
WATER RESOURCES DEVELOPMENT Volume 6 Number 2 June 1990
134
Katko, T. Paying for Waterin Developing Countries
Cost recovery in water supply in developing countries: Tapio S. Katko
receive the same level of service. Typically this is not the case. Although taxpayers and customers are often the same people, the effects of direct charges and taxation are very different. Because taxation is not based on the actual use of water services, it is considered only as a secondary option.
Discussion We find that cost recovery is one of the key requirements in developing reliable water supply services. Cost recovery is also highly dependent on opera— tional technology and appropriate institutions in the sector. Together these three elements form the basis of a sustainable water supply. Water supply systems will be sustainable only if sufficient resources are recovered to keep them operational. In the long run it is absolutely necessary to generate resources for repair, rehabilitation,
replacement and investment. Covering only oper— ation and maintenance costs is not adequate. If, and when, sustainable development becomes a generally accepted goal, full cost recovery should be achieved in water supply and sanitation. The need to implement sustainability and cost recovery leads to
the fundamental question: what roles should each of the main parties in water supply development play? The parties are the central government, the local administration, the water agencies, the consumers and the private sector. Each party should take care of those activities it is best at. In the home countries of the supporting agencies the role of the central water authority is quite limited. It concentrates on the most important policy issues, guidance, promotion and monitoring. The systems are run by more—ordess autonomous munici— pal, private, public or otherwise-owned water utili— ties. Tariff levels can be set either by the utilities themselves or by local municipal councils. The general principle is that tariffs are designed and set separately for each system. This means automati~ cally that, for instance, geographically uniform charges are not used. Thus there is a lot that devel— oping countries could learn from the experiences of the more developed ones. However, as the examples on progressive tariffs show, developed countries also have interesting lessons to learn from developing
ones. Some external support agencies regard water sup— ply purely as a social service, stressing the important issues of equity, basic need and health, but forget—
ting the actual costs involved. Other agencies regard water supply as a social—infrastructural service where both social and infrastructural issues are stressed.
The author’s view is that, by proper formulation of water tariffs and charges, it is possible to supply the minimum basic amount of water for the rural and urban poor at a highly subsidized price. However, water service should be free only in exceptional circumstances. Any volume exceeding the minimum consumption level should be charged in accordance
with a progressive tariff so that the total collected revenue will cover costs fully. Therefore the appli— cation of economic principles is not, as often erroneously believed, socially unjust. Conclusions
The following conclusions on cost recovery in water supply in developing countries can be drawn:
Cost recovery, operational technology and appropriate institutions are the key require— ments for any sustainable development in water supply and sanitation. @ The policy of supplying free or almost free water has often produced very inequitable results. Governments have been able to arrange water supplies only to some consumers. This service benefits mainly the better—off consumers instead of the urban and rural poor. A better and more equitable method wouldl: 3 to collect water fees from middle-level and large consumers via progressive tariffs and cross—subsidize the poor con— Q
sumers. @
6
The best evidence of consumers’ actual willingness to pay for an operative service is the commonly practised vending and reselling of water. This door-to-door service is a challenge to water suppliers. Innovative fee collection is needed. In addition to monthly billing many alternatives exist, from spot cash payments to seasonal ones. In rural areas consumers can make largely non-cash con— tributions. In rural areas community-managed institutions should be developed.
References
Chappey, M. (1980). ‘Systemes de tarification en Afrique’, Aqua, Vol 29, No 2, pp 13—26. Katko, T. (1989). "The role of cost recovery in water supply in developing countries’, paper A41, Institute of Water and Environmental Engineering, Tampere University of Technology, Finland. Laugeri, L. (1987). ‘Water for all - who pays?’ World Health Forum, Vol 8, pp 453—460. OECD (1987). Pricing of Water Services, OECD, Paris. Okun, D.A. (1987). The Value of Water Supply and Sanitation in Development: An Assessment of
WATER RESOURCES DEVELOPMENT Volume 6 Number 2 June 1990
93
135
Katko, T. Paying for Water in Developing Countries
Cost recovery in water supply in developing countries: Tapio S. Kat/co
Health-Related Interventions, Technical Report No 43, WASH, USAID, Washington, DC. Rinne, S. (1989). “The negation selection model and its impact on the product development of an investment
good’, Doctoral Dissertation No 59, Tampere University of Technology, Finland. Saunders, R..l., and JJ. Warford (1976). Village Water Supply Economics and Policy in the Developing World, Johns Hopkins University Press, Baltimore, MD. Simon, HA. (1958). Administrative Behaviour. A Study of Decision-Making Processes in Administrative Organization, Macmillan, London and New York, 2nd
edn. Stadtfeld, O.R., and KL Schlaweck. ‘International com— parison of water prices‘, Aqua, Vol 37, No 4, pp 173—
177. van Wijk~Sijbesma, C. (1987). Occasional Paper Series, IRC.
94
What Price
Water?,
Whittington, D., I. Briscoe and X. Mu (1987). Willingness to Pay for Water in Rural Areas: Methodological Approaches and an Application in Haiti, Field Report No 213, WASH, USAID, Washington, DC. Whittington, Dale, Donald T. Lauria, Daniel A. Okun and Xinming Mu, ‘Water vending activities in develop— ing countries: a case study of Ukunda, Kenya’, Water Resources Development, Vol 5, No 3, September 1989,
pp 158—168.
WHO (1986). The International Drinking Water Supply and Sanitation Decade: Review of National Progress (as at December 1983), WHO, Geneva. WHO (1989). Water Supply and Sanitation, Report of the
Fourth Consultation on Institutional Development, CWS/89.5 and 89.6, WHO, Geneva. WHO and SDCA (1987). International Drinking Water Supply and Sanitation Consultation, Interlaken, Switzerland, 13-16 October 1987, WHO, Geneva.
WATER RESOURCES DEVELOPMENT Volume 6 Number 2 June 1990
Kalko, T. Paying for Water in Developing Countries
137
PUBLICATION V 83. Katko, T., 1991. Reseliing and Vending Water. Journal AWWA. V01.
no. 6. p. 63-69. (revised).
© 1991, American Water Reprinted from Jggmai , Vol. 83, No. 6, (June 1991), by permission. Copyright ion. Works Associat
Karko, I Paying for Water in Developing Countries
139
lling
an
ending Water Tapio S. Kat/20
Consumers in developing countries may get their water from a number of places—pipe connections, vendors, resellers, public standposts, or kiosks or by fetching it themselves from alternative sources.
has largely been Untfi recently the reselling and vending of water in the developing world Owners of private ignond by utilities, governments, and external support agencies. transport water connections resell water to customers who come and fetch it. Vendors ’ ability and disarm-door or sell it wholesale. Reselling and vending indicate consumers suggest that these willingness to pay for water service. Recent examples and two case studies for peri-urban areas. practices can be used as design criteria for utility services, especially
Water utilities in developing countries are often unable to provide operative water services, especially to peri-urban areas. A variety of alternative systems has evolved, such as vending, reselling, and collection of water. The objective of this article is to show that even simple surveys of resellingand vending would be useful to water utilities JUNE 1991
as a basis for planning and improving their services.
Concepts of reselling and vending Consumers in developing countries typically collect their water on foot but may also use transportation, They may get their water from a pipe connection, vendors, wholesale vendors, resellers,
public standposts, kiosks, or other sources (Figure l).‘ In this article, reselling means that the owner of the water connection sells the water to customers who come and fetch it. Vending means mainly “selling water especially as a hawker or peddler."2 The vendor transports small quantities of water to the user as a door-todoor service or supplies it in bulk, i.e., wholesale vending. Wholesale vendors may transport the water or sell it to vendors or directly to customers at vending stations. The scope of the water sources is much larger than those of the conventional supply systems of water utilities. TAPIO s. KATKO 63
Km, T. Wkt
Vending and reselling may be officially
costs of standpipes or even house connections. In 1986 the Water and Sanitation for Health project supported by the US Agency for International Development started studying vending in developing countries. In Tegucigalpa, Honduras, with 540,000 people, about 80,000 people lived in shantytowns and got part of their water from vendors. The price of truck-transported water was 35 times the official rate. In the rural village of
forbidden. Vending of water has been practiced throughout the world since ancient times. Statues in ancient Greece show that water was carried in large jars. In the Middle Ages, water in Europe was typically supplied by vendors.3 In Paris
at the time of the French Revolution, about 20,000 water carriers used two pails, as is done in China today.4 In adeveloped country such as Finland, with fairly rich water resources, vending does not occur anymore. However, it used to be common practice in several townships before the introduction of conventional public water supply. Even today, in highly dispersed rural areas, some householders transport part of their domestic water. The bottled drink— ing water industry, e.g., in France, is an advanced form of reselling. Although the amount of bottled water consumed per capita is low, the unit price per litre and the total money flow can be considerable. At least it shows that people are willing to pay a substantial amount for groundwater perceived to be of good quality. Water is vended from any type of container available, such as oil drums, kerosene tins, and plastic containers of all sizes. Vended or resold water can be transported by foot, pushcart, wheelbarrow, ox cart, donkey, horse, camel, bicycle, or truck or other motorized vehicle. This shows the inventiveness of individuals to organize water supply in the absence of an operative water supply
Ukunda, Kenya, with 5,000 people, vendors sold about 45 percent of the water consumed. People spent about 9 percent
of their income on vended water. The studies in Honduras and Kenya show that vendors do not earn large profits.‘ In the town of Onitsha, Nigeria, with 700,000 people, close to 300 tanker trucks
delivered water from about 20 private boreholes and sold it to individual houses and businesses. Private firms manufac— tured large metal storage tanks for
140
pointed out that if the tariffs of public water supply are increased too fast, people tend to resort to vending. Jaglin and Koanda“ mentioned that vendors have quite flexible agreements on when the water should be paid for. Vended water is traditionally paid for on the spot in cash. Vendors also have individual agreements with their customers who can pay on a per-bucket, weekly, or monthly basis. Most of the reported experiences of water vending come from urban and peri-urban areas. However, there are a few reported examples of vending in rural areas such as Ukunda, a village in Kenya. Bishaw and Medhin12 made a socioeconomic survey of rural water use in Ethiopia. In some of the communities, water was vended at double the price collected by the water authority. McGowan and Burns13 found that in Sudan vendors played an important role in rural communities. Young boys with
In developing countries, men are typically mobile sellers, whereas women generally operate fixed-location enter. prises. In water vending, this difference can be clearly seen in all parts of the world. Individual vendors are typically men, but children also vend water transported, for instance, by donkeyfi’»6 Women are the main users and carriers of water.
ILLUSTRATION: J, HELMINEN
system.
Previous studies
This illustration depicts a water vending system using ox carts in a rural village in the Kwale district in Kenya.
In Lima, Peru, people without an on ganized water supply in 1974 had to buy water from tank trucks and store it in barrels. These people consumed from one third to one seventh of the amount of water that private connection holders did. However, they spent two to six times more money on the vended water.7 In 1976 Fass8 surveyed water vending in Port‘au'Prince, Haiti. Out of 640,000 inhabitants, almost half had to rely on water from private sellers. Because of a low, flat—rate tariff structure for house connections and the free water from standpipes, the city water board was able to earn barely one fifth the amount of money people spent on vended water. The study showed that households relying on a small amount of vended water could have used that money to pay the
individual houses and courtyards. These tanks were owned by the residents who resold the water to others. In the rainy season, the sales of vendors and resellers was about 24 times as much as the revenue of the water utility.9 Morel l’Huissier,10 as well as Jaglin and Koanda,” has studied water vending practices in Ouagadougou, Burkina Faso. Morel l’Huissier pointed out that in spite of the higher water prices for poorer service, the vending system is flexible. Vending protects consumers from uncertainties better than does a piped water supply system. In areas close to the city center, the price was 25 FCFA (Franc Communauté Financiere Africaine)/20 L, whereas in the squatter areas the price was 50 FCFA/ZO L. He further
64
MANAGEMENT AND OPERATIONS
donkeys sold water to homes for a price that was 500 percent higher than the fee at water yards. In three rural communities of Anambra State, Nigeria, households mostly used rainwater collected in the rainy season. During the dry season, most households bought at least some water from tanker trucks to avoid the 4 to 7 hours spent collecting water from springs. Households did not want to commit themselves, however, to fixed monthly fees. Instead they wanted the freedom to pay for water only when they use it. Thus the conventional fixed monthly fees for improved services are not appropriate.” The need for innovative cost recovery, especially in rural areas of developing countries, has also been pointed out.“'1 JOURNAL AWWA
Kalko, I Paying for Water in Developing Countries
Case studies
Horogoro, Tanzania. In 1988 the population of Morogoro was 120,000 people, out of which 3,660 had private water connections. Domestic water was also supplied via 80 public standposts, free of charge. Water source selection and consumption, especially reselling and vending of water, were studied in the un planned area of Chamwino with about 10,000 people. In the research area there were about 1,700 households. There were 90 private connections and three opera» tional public standposts, one of which had intermittent supply during the day, in the area.16 A research approach of integrating the official administrative structure was selected. The field work involved inter: viewing vendors, resellers, and consumers coming to collect water from resellers. A total of 15 owners of courtyard taps were found to resell water at the price of 1 Tanzanian shilling (TAS)/20-L bucket to individual customers and 2 TAS/ bucket to vendors (Table 1). The price stated by the resellers themselves was half that given by their customers. The study was conducted during the dry season, but according to the interviews, the amount of water consumed would have been the same during the wet season (from 25 to 30 cd). The interviews implied that the average daily water sales by a reseller would be about 80 buckets. Actual counts at reselling points revealed that the average sales are about four times higher.
Twenty-seven water vendors were
interviewed. The vendors used wooden homemade wheelbarrows. The size of the wheelbarrows varied, with the largest carrying up to ten 20-L containers. Most of the vendors worked from 6 to 10 hours daily. Those vendors working less than 5 hours were students, peasants, charcoal makers, and watchmen. Vendors usually owned their pushcarts and containers. The price of vended water to a few permanent customers was lower than that for normal ad hoc buyers. The normal price was from 4 to 6 TAS/20 L, being somewhat higher during the dry season than the wet season (Table 1). The estimated total money flow within reselling was 1.8 million TAS per annum (based on actual counts) and that within vending was about 1.5 million TAS (based on interviews with vendors). Together these flows were about 7 per cent of the collected annual revenue of the water utility. The monthly income of an average reseller was about 9,000 TAS compared with the minimum salary of 2,000 TAS (Table 2). The average water bill based on a flat rate was only 200 TAS. If the connection were metered, the bill would be several times higher. Thus the resellers made a good profit.
141
Vendors were able to earn about 12 TAS per hour, which roughly equaled the wage rate for unskilled laborers, when the average sales and cost of vending equipment are taken into consideration. Thus vendors did not make an excessive profit. It was determined, based on the interviews, that the average monthly household income was about 3,200 TAS. An average family relying mainly on resold water and using 20 cd thus spent about 5 percent of its income for water.
Suburban area of Beira, Mozambique. After independence and the exodus of Portuguese personnel in 197 5, the water supply system of the town of Beira deteriorated greatly as a result of the general unstability of the country. In 1990 network pressure was only 10 to 15 m of water head. Daily supply was intermittent: 4 hours in the morning and 4 hours in the afternoon. Out of 280,000 people, about 70 percent lived within the supply area. More than 100,000 people were estimated to live in unplanned suburban settlements. These areas were supplied by 75 public standposts, of which more than half were nonoperational. Owners of private connections commonly resold water. The suburban area of Chipangara was selected for the case study. The area was first mapped on an enlarged copy of an aerial photograph. Major roads and paths, schools, bars, shops, and existing public standposts were marked on the map. The operational level of the standposts Was checked. A simple question naire with 12 questions was developed and tested by two enumerators. They interviewed 52 randomly selected house. holds without a water connection. The actual survey was done by one enumerator during the morning hours of four days. The procedure and results were
evaluated daily.
Households collected water from three main sources: resellers, public stands posts, and open wells. The average amount of water purchased from re: sellers and public standposts was about 10 cd. The use of open well water amounted to about 20 cd. Resold and public standpost water was used for household purposes, whereas the open well water was used primarily for washing. Of the total amount of water consumed, 65 percent was purchased from open wells, 20 percent from resellers, and only 15 percent from public standposts. This case study concentrated on analyzing households’ basic selection criteria for using resold and/or public standpost water. An analysis of the data showed the highest correlation to be between water consumption and the number of persons per household: the higher the number of persons, the smaller the per-capita con— sumption. Table 3 gives basic data on
Not having the luxury of wolerflowirzg freely from a tap, people in less developed countries rely an inventive means of transporting water to their homes.
households purchasing only from resellers (n = 21), Table 4 on ones using only public standposts (n = 13), and Table 5 on households using both (n = 18). Households using only one of the two sources consume one bucket as a “basic
consumption" (Figures 2 and 3). When
water is purchased only from resellers (Figure 2), the buyer’s distance to the source varies. If the distance to resellers is shorter than average, three more buckets per household may be used. This means that more money is spent for water and the resellers’ income increases. The pattern is typical of households of four to seven persons. Households that purchase water on monthly contract from resellers or that get it free from the taps of friends or relatives may use two extra buckets, i.e., altogether six buckets per household (Figure 2). When households select a public stand-
post only, the “basic bucket" seems to be
independent of the time that is spent for queuing at the standpost (T) and the distance to the source. If the queuing time is less than 1 hour, households may consume another bucket. If the standpost is close by, households may minimize their queuing time and use a third bucket (Figure 3). Figure 4 shows the case in which households use both sources. The daily
“basic bucket” is again used by all.
Households that buy resold water, paid TAPlO s. KATKO 65
JUNE 1991
142
m, I WMWhWW
for on the spot, may use six buckets per day. If water is drawn from the taps of friends or relatives, or if water is paid for monthly, eight buckets may be used. The total number of households that were included in the interviews (71 = 52)
TABLE 1 Data on reselling and vending of water in Chamwz'no, Morogoro, Tanzania
was small, and therefore statistical methods are not applicable. The data on
the number of daily buckets consumed, distances, and queuing time are only
approximate estimates. Besides, some households may have given biased an-
swers. On a few occasions, people complained that neighbors were not willing to resell water. The average price of resold water was
30 meticais (MET)/20-L bucket (US$1= 850 MET, 1980). In five cases, monthly charges equaled 10 to 16 MET/bucket, i.e., about half. The sales per reseller
were estimated to be about 16,500 MET/month compared with the most common monthly water bill of 2,000 MET. Only during a part of the 8-hour
27 25 6 400—500 m 560 L 640 L 4/6 TAS 0.5/0.5 TAS 5 TAS
TABLE 3 Basic data for households purchasing water only from resellers in Chipangam peri‘urban
mvmNNNNNNNHwHHHMHH—Aw
"d E 6
OOOOOOCOOOOOOOOOP‘F-OOO
25
C
F
HwOOOr—‘OOOOOOOOOOOOHOO
16
60 120 120 120 120 120 120 120 120 60 60 120 120 180 120 120 120 60 120 120 120
... Ammmummmke:nqqmnpmmw
i7l‘ 18 19 20
T
DR'
l 2 3 4 5 6 7 8 9 10 ll 12 13 14 15 16
E n:
area of Beira, Mozambique (less the number of buckets purchased) Household
P 50 25
20.0
*DR—distance to the source (m), T~queuing time at public standpost (min), PH-persons per household, MP—monthly payment (MET), F~friend or relative (0 = no, 1 = yes), C—number of 20»L buckets consumed daily, P'daily payment by household (MET), CR—consumption of resold water
(cd)
r
a - — — - Foot
4-
D-
The biggest problem of vending and reselling is the high unit cost, which is not often recognized by the consumers. But in some cases, reselling and vending present visible problems, e.g., when they are practiced as monopolies without alternatives for consumers.
‘A
‘---____
.3. pg,” Vehicle
Figure 1. Alternatives for water distribution and water collection (formulated with permission of Water Resources Development)
EEMUU
I
..
wuu sources
A
Humor 0/! Buckets Purchased
I
Dolly per Household
{Less reliable
Problems
MANAGEMENT AND OPERATIONS
1 TAS" 2T * 320 buckets (6,400 L)
1‘20 litres
monthly income. A rough estimate is
66
10,000 1,700 90 15 9
*According to customers, the same for dry and wet season
supply period did resellers ply their trade. Thus the resellers made a good profit. The majority of the persons interviewed were reluctant to state their
that households spent about 5 percent of their average income for resold water (2,000 MET/month). This monthly payment of one household equaled the monthly water bill paid by an average reseller. It is estimated that about 90,000 people live under similar water supply conditions as exist in the case study area. Assuming that, on average, people pay 10 MET per person per day for resold water, the total annual money flow in water reselling would be 320 million MET. This sum is of the same magnitude as the actual annual payments to the water company. These payments'did not fully cover the operational expenses of the company. . For the water utility, the case implies that households are willing to pay for operational water service. The standard of service could be improved by increasing pressure and preventing leakage and by increasing the number of public standposts. If a charge is introduced for standpost water, the queuing time should be less than 1 hour. This is supported by the fact that some interviewees complained of the long queuing time but not of the distance to the source. In one corner of the area, a few households drew water from a hand~pump well 500 to 600 m away.
Value
Characteristic Reselling Population of the area Number of households in the area Number of private connections Number of yard tap owners reselling water Number of yard taps with buckets of resold water counted Price per ZO—L bucket Individual customers Vendors Average daily sale per reseller Vending Numbers of vendors identified Number of vendors who disclosed their sales Number of full-time vendors Typical distributing distance Average daily sale per vendor (disclosed) Average daily sale for full-time vendor Highest price per bucket? (wet/dry season) Lowest price per bucket“? (wet/dry season) Average price per bucket?
. Paid mainly or free
from retatlve or round . Lon than average distance to manor ~ Increase in reselten' locum
8mm 4
5
12
Number of Persons per Household
Figure 2. Average daily water use of households relying only on resellers in Chipangara, Beira
JOURNAL AWWA
143
‘Katlco, 7: Paying IonWater in Developing Countries
TABLE 2 Tanzania, Monthly earnings of households reselling water in Morogoro,
compared wilh their water bills
Value— TAS
Parameter
9,600 2,400“ 200 2.200 9,400 2.000
Average reselling income "Should be” water bill Actual water bill Present loss to the utility per reseller Potential loss to the utility per reseller Minimum official monthly salary
n *If charged according to the present tariffs and actual consumptio
TABLE 4
ll 4
C?
P 0000000000000
ing large containers filled with water.
01 0
»—-
mOOQ-F-wNOtD
50 80 130 100 200 150 60 0
C onwmmmmwmmwww
120 120 60 60 120 120 60 60 60 120 180 120 60
MP
'1}
50 50 150 70
”U I:
T
0000000000000
10 11 12 13
DR‘
paw vireo
cmqmmpwws—
Household
0000000000000
public standposts Basic data on households purchasing water only from d) in Chipangam, Beim (less the number of buckets purchase
public standpost (min), PH—persons per *DR—distance to the source (m), T—queuing time at relative (0 = no, 1 = yes). C—number of 20-L household, MP—monthly payment (MET), F—friend or (MET), CP—consumption of public buckets consumed daily, P—daily payment by household standpost water (free of charge) (cd) 9 ‘1
Dally per Houoohold Purchased Number or Buckets
a u
mmmmmpmwomywwam
Ruck! water
Standvost close by, T negligible
E
4
For” Form
In the shantytown of Puskesman Melania in North Jakarta, Indonesia, vendors typically bought their water from reselling homeowners. Although the resellers paid a nominal rate to the water authority, some of them employed vendors on fixed salary.l7 In Dongore, Ethiopia, a rural well was used by about 3,000 people, the average one-way distance being about 2.5 km. People who lived near the well stored some extra water and resold it. The price of resold water was up to eight times the official price.‘8 In Port-au-Prince, Haiti, the tanker truck operators used their influence on public officials to restrict entry into the vending business by regulating the licenses for obtaining new vehicles. Thus, there was an attempt to monopolize the vending business and hinder proper com: petition.8 In Khartoum, Sudan, squatters were supplied by a vending system that was operated by a cartel of northern Arab businessmen with fleets of vehicles. A vendor had either to rent one of these vehicles or buy his own,” During the emergency caused by flooding in Sudan in 1988, the prices of vended water increased threefold. The Red Cross emergency program pointed out that its support, based on transport-
Public standpost
Cl D
Farm
g
FREE
3
g
FREE
3
g
FREE
3
E
FREE
$
E
FREE
Ts1h
was aimed at lowering the price of vended water to the original level, but not at destroying the business of vendors. On the other hand, the vending system cannot be justified by employment aspects as long as the poor have to pay high prices for the vended water. In the case of a refugee camp, international relief was used to support vending of water by lorries instead of constructing a simple pumped system from a river. Other potential problems may be caused by the inadequate quality of vended water. There is no guarantee that the containers are kept clean, and water may be drawn from contaminated sources. But water supplied by utilities may also be of inadequate quality. On the whole, vending and reselling systems are able to give operative service to consumers, although often at a high price. So far the governments and water utilities of developing countries have almost ignored the existence of these activities. Their widespread existence should be recognized and utilized as the basis for further development.
institutionalizing vending and reselling
8
12
Number of Persons per Household
Number of Persons per Household
figure 3. Average daily water use of households relying only on public
standposts in Chipangara, Beira (P =
queuing time at the standpasts)
Figure 4. Average daily water use of households relying both on resellers and public standposts (F—fi‘iend, free of charge; M——resold, monthly payment; $——resald, payment on the spot)
There are several examples of the institutionalizing of water vending and reselling. In Kenya water kiosk operators take care of selling water as well as of controlling tap water wastage. Public standposts, which were supposed to be maintained by collecting small monthly taxes, have been converted to water vendor operated systems. The licensed TAPIO s. KATKO 67
,lUNE I991
14!:
Kafka, T. Paying for Water in Der/singing Countries
According to Zaroff and Okun6 the problems of vending could be eliminated by institutionalization. Improved vending would include a predesigned number of selling points or vending stations. Sanitary containers of proper material and simple delivery vehicles would be provided. Regardless of whether the improved vending was a government or private operation, regulation of price, service, and water quality would be needed. Zaroff and Okun suggested improved water vending for Surabaya, Indonesia, where an area of 5,000 people was studied. Suleiman23 also made a survey of vending in Surabaya. He reported that when unusually high consumption, and thus reselling, was discovered, the owner’s tariff classification was raised to that applied to vendors. In addition to the 2,300 registered vendors, about 1,700 private homes were suspected of reselling water without the knowledge of the water authority. Unlike Zaroff and Okun,5 Suleiman23 contended that instead of institutionalization, the vending system should be gradually replaced by ”communal out-
lets." The costs of a communal outlet (instead of public standpost) could be shared by 30 to 40 owners on both sides of the street. This service connection could be subsidized or paid for by installments. The spread of communal outlets could force a reduction in the price of water sold by private vendors. Thus the number of vendors would diminish according to supply and demand.
In Ouagadougou, Burkina Faso, since 1983 the national water authority has increased the number of standposts, After the increase of standpipes in the periphery of the city, private water resellers became rare, but wheelbarrel 68
MANAGEMENT AND OPERATIONS
TABLE 5
’2;
('3 mmmmmmmsawwwwmmm+
ll 20
OOOI—‘HOOOOOCVHCOOOO
2
'1‘ 180 60 180 120 I80 120 180 180 60 60 120 120 180 120 120 120 60 120
Z a:
DR‘
OOHOOD—‘OOOOOOOOOOOO
Household
'V m
Basic data on households purchasing waterfrom both resellers and public standposts in Chipangara, Beira (less the number of buckets purchased}
muemmpqomwwwaaom
vendor pays a subsidized rate for the metered standpost water and sells the water at a slightly higher rate. As a result vandalism has been greatly recluced.20 In 1990 in Kibera and Mathare, Nairobi, several connections registered as water kiosks with a low water tariff were found to supply water to informal businesses instead of the lower income groups. The kiosk owners had a monopoly on the supply, and the unit price was five to seven times higher than that in the legal gazette.“ Licensed water kiosks have been used in several countries, such as Ethiopia, although they have not necessarily been classified as an institutionalized form of vending. In 1982 in Grand Cayman Island, the water company sold Water to trucking companies. These companies distributed water outside the franchise area for a price 1.5 to 3.5 times higher than the piped water of individual connections. In spite of marketing efforts, consumers were against the suggested expansion of the piped system.22
12
P
CR
0 30 40 25 60 0 0 150 25 90 40 60 0 0 50 90 40
*DR—distance to the source (m), T—queuing time at public standpost (min), PH—persons per household. MP—monthly payment (MET), F—iriend or relative (0 = no. 1 = yes), C—number of 204. buckets consumed daily, P—daily payment by household (MET), CR—consumption of resold water (cd), CP——consumption of public standpost water (free of charge) (cd) TNumber of buckets unknown
vendors still existed. Standposts, earlier managed by municipalities, are controlled by standpost keepers. These keepers have had a contractual agreement with the waterauthority regarding the disciplinary management of the standposts.“ Consumers pay much less for such water than they would pay to
private vendors in the absence of an agreement between the utility and the vendors. This type of licensed selling, called concessionaire sale, is commonly used in Francophone Africa}5 The standpipe regulator—collector can
also be a municipal employee, as is the case in Addis Ababa, Ethiopia.25 Institutionalized vending offers job opportu‘ nities, although, at the same time, it reduces the market for traditional private vendors. In Port Sudan standpipes are located every 40 to 50 houses. Each standpipe is rented to a responsible kiosk owner, who resells water at a controlled price.26 Van Wijk-Sijbesma27 pointed out that in several developing countries private authorized vendors tend to get replaced by different types of consumer groups or associations. These groups organize the selling from a metered neighborhood tap at a still lower price. Zaroff and Okun6 calculated that vending systems, like pipe schemes, are subject to the effects of economies of scale (decreasing average costs) when population increases. However, unlike conventional piped schemes, vending could provide economies of scale as the supplied area is enlarged. This would mean that vending could be financially attractive for large service areas.
In rural areas the institutionalization of vending and the introduction of water fees are limited by the existence of alternative traditional water sources. If
these sources do not exist and the coverage of the common water supply system is inadequate, consumers either carry their water from resellers or rely on vended water.
Discussion The results of the two case studies and the examples show that consumers in developing countries are willing to pay for reliable water service and that they value their time. In Beira no vending seemed to occur, whereas reselling was very common. This was obviously because of an adequate number of private connections but inadequate coverage by and pressure of public standposts. It seems that vending is likely to be more common if there are fewer alternative sources. In each case the technical system and consumer traditions can explain the water use patterns. The recent researching of water vend‘
ing implies that this old tradition is actually not a simple system. It is often fairly advanced, adjusting to demand and supply. Several aspects of reselling and vending could be used as a basis for water tariff development as well as predicting consumer contributions. Recent experiences show that water utilities and sector professionals may be prejudiced against studies on water vending and reselling. The author agrees with the view of Okuni’8 that engineering and financial evaluation of reselling and JOURNAL AWWA
145
Katko, T. Paying for Water in Developing Countries
vending are mandatory in urban water supply planning. This is consistent with the recent increasing interest in con» sumers’ needs and priorities in the western world. The evaluations, as shown by the case studies, need not necessarily be large; instead a limited survey may reveal important technical and financial facts. Water source selec~ tion and consumption patterns could be further surveyed by the negation selection approach.29 The author suggests that in estimating consumers’ ability and willingness to pay for water, reselling and vending, if they exist, should be studied first. Hypothetical methmis such as the contingent valuation method can be used as a supplement or in cases where no actual water buying exists. The examples show that the latter is probably rare. The governments of developing countries are starting to change their policies and are developing suburban areas instead of ignoring them. Toward the end of the 19803, this change of policy also started to be seen among external support agencies. In developing water services for scattered urban areas, vending and reselling are the first issues faced. Reselling is still often officially forbidden, and those people found resel» ling water are fined. The water utilities should concentrate, however, on improving services and taking advantage of the entrepreneurship of their consumers.
Conclusions 0 In spite of its wide use in developing countries, vending is often ignored by water utilities. Until recent years, water vending and especially reselling as forms of the informal economy have rarely been studied. The existence, constraints, and benefits of these practices should be openly admitted. 0 Water vending is a costly solution to water distribution problems. In spite of the high prices paid for vended water, the vendors do not make much profit because of the transportation cost. The number of communal water collection points (standposts, kiosks, boreholes) could be increased by expenditure of a considerably smaller amount of. money than consumers pay for vended water. 0 Water resellers seem to make larger profits than vendors. Licensing resellers could be considered. Consumers would be treated more fairly and the revenues of water utilities could increase. The feasibility of this arrangement is subject to local conditions. 9 In spite of the existence of alterna‘ tive traditional water sources, vending and reselling seem to occur in rural areas also, though seldom reported. 0 The amount of money spent on resold and vended water shows that among consumers there is the ability and willingness to pay for reliable water JUNE1991
service. Consumers do not often have reliable alternatives. 6 Reselling and vending are among the first issues to be studied in the planning of water supply services, particularly in urban fringe areas. By studying reselling and vending, water utilities should be able to demon strate the high cost of these practices for relatively poor service. Such studies would probably support the feasibility of a piped system rather than reselling and vending. In areas where piped systems are not able to meet the ever~growing demand, water utilities should improve the efficiency and reduce the cost of vending and reselling. On the whole, reselling and vending are a challenge to utilities, which should be able to provide the population with more reliable service at a lower price.
Acknowledgment Financial support from the Academy of Finland and the Finnish International Development Agency (FINNIDA) is acknowledged. The author thanks Jarmo Hukka, Damas Mashauri, Daniel Okun, Matti Viitasaari, Pertti Vuoriranta, Dale Whittington, and AWWA’s peer reviewers for helpful comments.
12. BISHAW, M. & MEDHIN, Z.G. Some Socioeconomic Factors Related to Rural Water Use. RD Rept. 39. Inst. of Devel. Res. Addis Ababa Univ., Ethiopia (1983).
13. McGowmv, R. 8; Buans, C. Evaluation of CARE Sudan Interim Water Supply and Management Project. WASH FR 227. Arlington, Va. (1988).
14. WHITTINGTON, D. ET AL. Strategy for Cost Recovery in the Rural Water Sector: A
Case Study of Nsukka District, Anambra State, Nigeria. Water Resources Res, 2629:1899 (1990). 15. KATKO, T. Cost Recovery in Water Supply in Developing Countries. WaterResourcos
Devel, 622286 (1990). 16. MAKONGWA, Y. Cost Recovery in Morgoro Water Supply. (Unpubl., 1991). 17. Water Sellers Make Good. Water Log. Earl/moan (Dec. 1982).
18. BROWNE, D.G. ET AL. Dongore Water Supply. A Study of a NWRC Rural Well (1974). 19. KINNEAR, J. Khartoum Squatter Costs Counted. World Water, 10:11:55 (1987). 20. SAUNDERS, RJ. & WARFORD, J. Village Water Supply Economics and Policy in the Developing World. The Johns Hopkins Univ. Press, Baltimore, Md. (1976). 21. Government of Kenya, Ministry of Plan ning and National Development, and
UNICEF. Socio-Economic Profiles. (1990). 22. Government of Cayman Islands. A Pro»
posal to Provide the Island of Grand Cayman With Public Water Supply and
Sewerage Facilities by 1990. Portfolio
References
Communications and Works (1983).
1. WHITTINGTON, D. ET AL. Water Vending
23. SULEIMAN, M.S. A Study of the Vendor
Activities in Developing Countries: A Case of Ukunda, Kenya. Water Resources Devel, 5:3:158 (1989).
Water Distribution System in Surabaya,
Indonesia. Draft. WHO (lune/July 1977).
2. Webster's New Collegiate Dictionary. G &
24. THEVENON, J.-P. Management of Public Standposts in Burkina Faso. Background
C Merriam Company, Springfield, Mass. (1977).
25. ROURE, J. Standpipes in Tropical Africa.
3. SINGER, C. ET AL. (editors). The Mediter‘ ranean Civilizations and the Middle Ages. A History of Technology, Vol. II. Clarendon Press, Oxford (1957). 4. ROTH, G. The Private Provision of Public Services in Developing Countries. Oxford Univ. Press (1987).
BCEOM Information and Document, 3:15 (1975). 26. COURTNEYJ. 8: Coorrssrocx, A. Meeting the Urban Poor’s Basic Water and Sanitation Needs. Aqua. 2826247 (1979). 27. VAN WUK-SUBESMA, C. What Price Water? Occasional Paper Series. IRC, The Hague,
o. MOSER, C. Surviving in the Suburbios. IDS Bull, 12:3:19 (1981). 6. ZAROFF, B. & OKUN, D.A. Water Vending in Developing Countries. Aqua, 33:5:289
(1984). 7. ADRIANZEN, B. & GRAHAM, G.G. The High Cost of Being Poor. Water Arch. Envir.
Health, 28:6:312 (1974). 8. FASS, S. Water and Politics: The Process. of Meeting a Basic Need in Haiti. Devel. & Change, 132347 (1982). 9. WHITTINGTON, D. ET AL. Paying for Urban Services. A Study of Water Vending and
Willingness to Pay for Water in Onitsha, Nigeria. The World Bank, Washington, DC. (1989). 10. MOREL l'HUlSSIER, A. Distribution Sociale de I’Eau en Afrique Noire: Comparaison des Performances
conomiques des
Systemes Distributifs et Redistributifs. Proc. Intl. IWSA Colloquium on Costs and Price of Water in Urban Areas, Paris, France (1988). 11. JAGLIN, S. & KOANDA, S. Gestion Partagée at Prix de l’Eau a Ouagadougou, Burkina Faso. Proc. Intl. IWSA Colloquium on Costs and Price of Water in Urban Areas, Paris, France (1988).
Document. WHO (1987).
the Netherlands (1987).
28. OKUN, D.A. The Price of Water in Urban Areas of Developing Countries. Proc. Intl. IWSA Colloquium on Costs and Price of Water in Urban Areas. Paris, France (1988). 29. RINNE, S. The Negation Selection Model and Its Impact on the Product Develop-
ment of an Investment Good. Tampere Univ. of Technol., Finland (1989).
About the author: Topic S. Kafka is a research officer of the ~ Academy of Finland at Tampere University of Technolog, Institute of Water and Environmental Engineering Box 527, SF-33101 Tampere, Finland. Since 2978,
Katko has been involved in water supply and sanitation projects in developing countries. He is a graduate of Tampere University of Technology and is working on his doctoral dissertation. TAPlO s. KATKO 69
Katko, I Paying for Water in Developing Countries
147
VI
PUBLICATlON Vl Katko. T., and Viitasaari. M., 1990. Rural Water Supply Development in Finland - Possible Implications for the Developing Countries. Aqua
Fennica. 20,1:3-12. (revised).
Reprinted with the permission of Aqua Fennica.
Katka, 12 Paying Ior Water in Developing Counties
149
RURAL WATER SUPPLY DEVELOPMENT IN FINLAND —- POSSIBLE IMPLICATIONS FOR THE DEVELOPING COUNTRIES
Tapio Katko and Matti Viitasaari Katko, T. & Viitasaari, M. Rural Water Supply Development in Finland — Possible Implications for the Developing Countries. Aqua Fennica 20,1: 3-12. This paper presents the development of rural water supply in Finland, one of the most developed countries in the world today, since the early 19005. It highlights such important factors as the preference for ground water, use of water for animal husbandry, alleviating the workload of women as water—carriers, use of locally available construction materials, role of individuals in promoting and managing water supply, services offered by private enterprise and importance of community-managed water associations. The paper suggest that the experiences
of today’s developed countries have a number of implications for developing countries although they are not necessarily directly applicable
Index words: rural water supply, historical development, innovation diffusion, Finland, developing countries.
Tapio Katko and Matti Viitasaari, Tampere University of Technology (TUT), Institute of Water and Environmental Engineering, BB. 5 27, SF—33 101 Tampere, Finland.
INTRODUCTION Rural water supply is one of the main sectors in Finnish development cooperation. The Nordic Countries, in particular, have supported rural water supply programs in Eastern Africa and some Asian countries. Finland has been involved in this activity for about 20 years. However, the development of rural water supplies in developing countries has proved to be very difficult, at least when seen against the government objectives. The purpose of this study is to touch on the development of rural water supply in Finland, and to determine how this experience could be exploited in seeking solutions to the problems the developing countries are facing today. Finland has developed into a post-industrial nation perhaps faster than any other western country. Consequently, a wealth of knowledge and experience is still available on the development of rural water supply systems. This article is mainly based on a preliminary report on the same issue (Katko 1989).
ECONOMICAL DEVELOPMENT IN FINLAND IN THE TWENTIETH CENTURY The distribution of employment in Finland has changed dramatically during this century (Fig. 1). The share of agriculture and forestry was still about 80 0/0 in the 19205 and 19308. The corresponding figure for the majority of developing countries is today 70—90 %. The shift from agriculturally based economy was accomplished with remarkable speed. In 1945 over 40 per cent of Firms depended on agriculture but by 1980 the proportion had fallen to under 10 per cent (Singleton 1986). According to Hierppe (1989) the actual per capita gross national product grew 15-fold from 1860 to 1985 in Finland. Private consumption grew 14—fold during the same period. Growth in per capita gross national product has been faster in Finland than in Sweden, the United Kingdom or the United States. In 1860 the Finnish figure was half of the Swedish one and a third of that in the US. In 1988 Finland
150
gadget mammwm
96
me 9080-
-90 1900
.
.
. ‘
—20
.
.
~40
.
.
—60
.
.
1930
SERVICES AND OTHERS
MANUFACTURING AND CONSTRUCTION
70— 6050-
According to Vuorela, the words used in referring to the latrine, were mostly of foreign origin. This would indicate that the latrine was first introduced to the upper classes. As late as in the 18805, awareness about latrines was spread by soldiers who had been drafted for the reserve. In the 18905 most houses in central Ostrobothnia were equipped with a latrine. It was, however, seldom used, because ”who would care to use one” (Vuorela 1975).
Thus latrines came into use at a much later date than wells, particularly in rural areas.
40— 30-
Fig. 1. Distribution of employment in Finland, 1880— 1 980. The shares have changed radically after 1920 (Heikk— erii 1987).
enjoyed the eight highest per capita GNP in the world (The World Bank 1989).
According to Heikkero (1987) clearing of forests by burning was abandoned around 1920. At the same time, fertilizers were introduced into agricul— ture. These changes led to a balance in the production of food in the 19305. During the Second World War, however, shortages of food occurred. A bal— anced situation was again achieved in the 19505. Ever since there has been overproduction of food.
Water sources
Rural water supply has basically relied on ground water. Four studies that were conducted in the 19305 and in the beginning of the 19405, indicate that 70—80 % of the households drew their house~ hold water from wells, about 10 % from springs, and the remaining 10 % used surface water (The Committee for... 1950). In urban areas, however,
rain water harvesting played an important role before the introduction of public water supplies. Traditionally, the wells were dug manually, and they were equipped with a Windlass or crank for hoisting the water bucket. In 1951, the breakdown of well lining materials was as follows: stone 30 %, concrete 29 %, logs 25 %, boards 6 %, earth 5 9’0,
combinations of these, etc. 5 % (Ware 1952). Also tube wells were constructed as early as in the 19305. In most cases, one well was built per household. Sometimes one well would serve a couple of farm. ilies. Due to poor water quality, some villages in western Finland had to use a common well, or in
winter the villagers would draw their water from a hole in the ice that was kept open by the community.
TRADITIONAL WATER SUPPLY AND SANITATION It is obvious that simple wells have been used in the country for hundreds of years, although documentation is scarce. Probably water has been taken for granted and, therefore, it is seldom mentioned in folklore. Some documentation can, however, be
found. For example, there is a mention that a well was co—owned by four homesteads in the parish of Kaarina in south—western Finland in 1640. The same well was still in use as a community well in that village in the 19th century. In central Ostrobothnia, in the western part of Finland, it was common that four to five homesteads operated and maintained a counterpoise lift well for provision of household water. In addition, each homestead had a separate well for its livestock (Vuorela 1975).
Villages in eastern Finland, however, did not have community wells (Vuorela 1975).
Well siting Wells have traditionally been sited through browsing or Witching, using a forked willow twing (divine ing rod). According to Vuorela (1975) this originally Central European custom reached Finland only in the beginning of this century. In Germany this cus— tom can be traced to the 11th century, but the first mention in literature dates back to the 16th century. According to a study conducted in 195 0, almost
80 0/0 of the wells in Finland were sited with the help of witchers. In 1949 and 1950, the Engineering Department of the National Board of Agriculture conducted an experiment to which 42 witchers of repute were invited (Wire 1953). They were given
Kafka, I Paying for Water in Developing Countries
151
Fig. 2. Water veins and radiation lines located in an area by witchers. There were as many different ”maps of water veins” as witchers (redrawn from Ware 1953).
the task to locate the water veins in the Botanical Gardens of Helsinki University. There were as many different maps of ”water veins” produced as there were witchers (Fig. 2). The belief in water veins and
witchers is still quite strong among ordinary people, and this belief has spread to the developing world as well. It is quite paradoxical to note that in the 19803 some externally supported water projects in developing countries still regard Witching as a serious siting method.
21 % of the water lifting devices. The oldest handpumps were made of wood. They were installed either on the cover of the well, or
were operated from the cattle shelter. The wooden pumps were made of spruce, as it withstands water better than pine. The wooden pumps in single family use are said to have lasted for some ten years. Handpumps became more popular when the cast iron versions became available. In the 19305, there
(Ware 1952). Only about 7 % of the rural house
were presumably three manufacturers of cast—iron handpumps in Finland. The first versions were so called suction pumps. The domestic manufacture of castdron pressure handpumps started in the late 19505. To date, about 160 000 such handpumps have been manufactured for a population of about 5 million. One make, the NIRA-handpump controls about 80 0/o of the present market share. The demand for handpumps was at a peak between the beginning of the 19605 and the middle of the 19705. Today, some 2 000 NIRA—pumps are sold per year in Finland. in the last 15 to 20 years, the handpumps
holds had piped water. Handpumps accounted for
have found a new market in recreational, second
Water lifting devices A variety of methods for hoisting water have been used in different parts of the country. In 1950—51 the Engineering Department of the National Board of Agriculture conducted a survey of rural water sources. The most common water lifting devices were: bucket with rod, handpump and Windlass
Kama, T. mumwmm
152
100 r
\W
150‘
7
m \\\\ \\\§
200 -
gs
w:
{96°}
50-
7. k.
| 1750
1800
1850
1950 1900 YEAR INTERVALS
Fig. 4. Infant mortality rates for children under one year in Finland, 175 1—1975 (Turpeinen 1979). Present annual rate
is about 6 %0.
Water quality Fig. 3. Yoke for carrying water in Rymattyla, Southwestern coast of Finland in 1938 (Photo: National Board of Antiq— uities).
homes. Since the mid-19705 work has been under— way to develop a handpump design that would be suitable for conditions in the developing countries. The manufacturer or the NIRA pump has participa— ted in the global handpump development project executed by the World Bank (Arlosoroff et al 1987).
Water carrying and transport Water was most often carried in one bucket or cowl when the distance was less than 100 m. When the distance was close to 200 in, water was carried in two buckets (The Committee for... 1950). Water
was also carried using a shoulder pole. The pole was slipped through the handles of a cowl and two people were needed to carry it. The yoke for carrying water originated in south-western Finland (Fig. 3). In the 19405 the Work Efficiency Institute was involved in developing an improved version of the ”woman’s double yoke”. In the winter, a sled was often used for hauling water.
Many myths about water quality and its effect on health have been handed down in folklore. Before 1900, it was believed that mineral springs had healing powers, and it was also generally believed that frogs could purify well water. Turpeinen (1979) has conducted demographic surveys in Finland. Infant mortality, which is highly dependent on hygienic conditions was about 100 %0 at the turn of this century (Fig. 4). Breastfeeding became more general toward the end of the 19th century due to promotional campaigns. As a result infant mortality decreased most significantly in areas where breast—feeding had not been com— monly practised. After snow and ice had melted in the spring wells in towns and in the densely pop« ulated river courses, especially in Ostrobothnia, be» came polluted. The highest mortality rates occured in the summer months. The development of infant mortality rates in Fin— land is comparable to the present infant mortality rates in low and middle—income nations of the Africa region. In the low~incorne category the infant mortality rate varies from 91 to 175 0/00, and in the middle-income from 25 to 127 Q/oo, respectively (Skytta 1989). Today the infant mortality rate in Finland is 6 %0, same as in Sweden and the lowest in
the whole world (UNICEF 1988). The materials used for the cover and lining of the well have also had an effect on water quality. It used
Karim, I Paying Ior Water in Developing Cameras
153
to be quite common that wells were not properly covered. In Kisii, Western Kenya, for example, wells
are in use that, instead of a cover, only have two boards across the opening with a rope and a bucket tied to them (Nyangeri 1986). A simple cover structure would improve the quality and safety of the water of such a well significantly. In 1958, the Engineering Department of the National Board of Agriculture conducted a study on the quality of household water and water sources in rural Finland. In about 55 % of the wells, the iron
level of the groundwater was over 0.3 mgl“ and in 25 % the corresponding figure was over 1.0 mgl“. About 10 % of the groundwater samples showed manganese levels in excess of 0.1 mgl‘1 (Ware 1961).
Up to 19405 typhoid epidemics occured in communities along larger rivers and in industrial and residential centres. After the Second World War Karelians who resettled in Ostrobothnia often became infected with typhoid. Still at the beginning of the 19503, mortality rates were higher in Finland than in the rest of western Europe. In the on-going national water supply development program of dispersed rural areas, it has been determined that many rural wells have some constructional weaknesses that present the risk of sur-
face water infiltration.
DEVELOPMENT OF PIPED WATER SUPPLY The development of public water supply systems in Finnish cities began in the 18705. The water supply schemes in rural areas developed later and slower, because water pipes were in short supply and expen< stve.
Fig. 5 . Machine—boring of wooden pipes in Ilmaioki, West— ern part of Finland in the late 195 Os (Photo: M. Viitasaari).
factured by private entrepreneurs. For example, in Ostrobothnia there were tens of such enterprises. Fig. 5 shows machine-boring of wooden pipes in the late 195 Os. On the initiative of the water consumers them« selves, water associations (partnerships and cooperatives) for organizing public water supply were established, especially in Ostrobothnia.
Provision of water for animal husbandry In 1948 the government appointed a committee to work out a plan to rationalize households, with particular focus on small-scale farms. This, so called, ”Women’s Committee” (all 9 members were
women) completed their report in 1950. However, the committee was supported by male professionals in technical issues (Ihe Committee for... 1950).
Pipe materials In the first stages of rural water supply schemes, wooden pipes, mostly of hollowed pine, were used. In 1951, the Engineering Department of the National Board of Agriculture conducted a survey on the use of wooden pipes in 33 water supply systems, mostly in southern Ostrobothnia. The oldest wooden network was found in Ilmajoki which dates back to 1872. Wooden pipes were generally used in grav— ity systems. The highest recommended water pressure was 20 m (Perakyla 1954).
Originally, the wooden pipes were hollowed with a hand drill, but later machine~drills were intro-
duced. The inner diameter of the pipe did not, in most cases, exceed 100 mm. The pipes were manu—
The Committee referred to three separate studies conducted on women’s work-hours on farms. The average work—hours for women were 12 to 16 hours on week—days, and 9 to 11 hours on Sundays. According to the Committee, the most significant rea son for the primitive state of water supply and sewer systems was the low esteem accredited to women’s work. The health aspects linked to water had not been fully understood. It was also noted that water and sewerlines were expensive and the technical know-how was indequare. All of these issues have received much attention during the present International Drinking Water Supply and Sanitation Decade. Animal husbandry has held a central position in the development of rural water supplies. Fig. 6 pre-
sents the statistical data on piped water supply to the
154
m7: mhmhmm
387
x10 856
347
300’ 251
9:
233 n
200 —-
36 100-
*EiMD
(959
1950
1941
1969
NUMBER OF FARMS PiPED WATER TO HOUSE SEWER FROM HOUSE
%
96
PIPED WATER TO COW SHED
ELECTRICITY 96 NOT AVAILABLE
‘36
*I *
BASED ON A SAMPLE
Fig.6. Number of Finnish farm houses with piped water, sewers and electricity, 1941 to 1978 based census of agriculture. Electricity was introduced first followed by piped water to cow shed, sewer from house and finally piped water to house (Official Statistics of Finland 1945—1978).
dwelling and the cow shed, sewer from the dwelling, and electrification of small-scale farms, for the years 1941, 1950, 1959, 1969 and 1978 (Official statistics of Finland 1945—1971). The data reveal that elec—
tricity was introduced before piped water; cow sheds were provided with piped water before dwellings got sewers and dwellings were provided with sewers before piped water. The water supply schemes for animal husbandry underwent a vigorous development after the Second World War in the 19505 and 19605. In the electrifi— cation of rural areas, two larger booms can be distinguished: the 192.05, and the years of reconstruct-
ion after the War. The latter lasted until the 19605 (Pylkkéinen 1985). With the electrification of rural areas came the electric pumps for the wells and the possibility to provide the dwelling and the cow shed with piped water.
Domestic water supply
According to population and housing census hot water has been the least common, and the sewer the most common water related service in Finnish
dwelling units. However, the electrification process
155
Karim, T. Paying for Waterin Developing Countries
[x103 KM 50.
Consequently, there are a few hundred water supply cooperatives in Finland today. The role of cooperatives has been and still is crucial in the development
1: cmss RURAL AREAS
{222
TOTAL
of water supply services in sparsely populated areas.
Financial development of water supply and cost of water
1955
1960
1970
1978
1987
Fig. 7. The total length of water supply pipelines in 1955, 1960, 1970, 1978 and 1987 (various sources compiled by the authors).
In 1950, allocations for constructing rural water supplies were made in the government budget for the first time. This was largely affected by the above mentioned committee. The National Board of Agriculture granted assistance to cooperatives that in“ tended to provide water supply services to a mini-
has been much faster than the introduction of water
mum of five dwelling units. Of the shareholders of the cooperative 3/4 had to be smallsscale farms with holdings of less than 15 hectares of cultivated land
services (Central statistical office... 1952~1 987).
(Turunen 1985).
The water pipes in urban areas were made of cast-iron, steel and copper. In rural areas wooden pipes were predominant. The domestic production of copper pipes started in 1941. In 1951 the domes— tic centrifugal production of cast iron pipes satisfied the demand of the domestic market. The centrifugal casting technique used in the manufacture of the pipes had been invented in the 19205. The do« mestic production of plastic pipes started in 1954 in Finland. Imported plastic pipes had, however, been introduced a few years earlier. Asbestos pipes were
In 1967 rural water supply works themselves paid 30—40 % of the annual costs. About 15 % was covered from connection charges, government grants and loans stood for 10—20 0/0, and municipal sup— port amounted to about 10 %. The remaining 20—
manufactured in Finland from 1961 on (Various articles 1961).
The total length of water supply pipelines has increased drastically since the 19605 (Fig. 7). Castiron and steel pipes were dominant in urban water supply networks up to the 19708. The share of asbe— stos pipes has never been more than a few per cent. In rural areas, plastic pipes started to replace wood— en ones as soon as these became available. Today, the Finnish plastic pipe industry is one of the biggest sellers in the European market.
Changes in ownership of water supply schemes Since 1956, the relative share of municipal works has risen drastically. Various types of associations form the second largest group; their relative share has declined, but their number has increased slighly as of late, The number of water works owned by industries has remained small, and is still declining. While the administration of larger water works has been taken over by municipalities, new cooperatives have been established in sparsely populated areas.
25 % was financed through bank loans (The water
supply committee 1967). Investments in wastewater treatment plants and sewer systems, but also water supply works, were significant in the mid~19705. The rehabilitation of existing networks has intensified during the last ten years. In 1929 a comparative research was conducted on the costs of water for animal husbandry on 15 farms in southern Finland. Transported water was most expensive, followed by carried water (The Committee for... 1950). About 16-20 minutes were used
daily for fetching water, i.e. a total of 12~15 work~ days per year. On farms with cattle, 40-100 eighthour workdays were, however, used yearly for carrying water (The Committee for... 1950). This amounts to 10 0/0 of the total workhours per year. Because the carrying of water was perhaps the most strenuous task of farm-wives, the energy input was relatively even bigger.
Water Decade and future perspectives In 1985 approx. 1.17 million people lived in sparse~ ly populated areas in Finland. Since 1950 the population of these areas has gone down by more than 300 000 people per every ten years. The definition of sparsely populated areas has been arrived at by using a criterion commonly applied in the Nordic Countries. A densely populated area is defined as
was, I tmmm
156
10
having more than 200 inhabitants with the distance between dwellings generally not exceeding 200 m; any other areas are defined as sparsely populated. Piped water supply has increased drastically in sparsely populated areas in the 19805. In 1987 the task force established for developing water supplies in sparsely populated areas estimated that a total of 180 000 households encountered some kind of wa« ter supply problems, i.e. almost every second house‘ hold. The task force has proposed that the water supply problems of 120 000 households in sparsely populated areas should be corrected by the year 2000 (Ministry of agriculture and forestry 1987).
DISCUSSION Finland became industrialized and developed into a post-industrial nation very guickly. In rural areas wells have presumably been in use for hundreds of years. In addition to private wells, water sources
operated by a few homesteads, or the whole village, were common. Public water supply schemes have developed along with the changes in the industrial distribution of employment (Fig. 1) since the 19205. Latrines, however, became common much later than wells in rural areas. One could, therefore, draw the
conclusion that the sanitation and health compo— nents often stressed in externally supported projects, are overdimensioned, or that water services
should be provided some years before full integration is achieved. In any case we should not expect too fast results in sanitation and hygiene conditions. Animal husbandry and its water needs have been crucial in the development of water supplies in Fin— land. It is an income-generating activity and has therefore received more attention than convenienc— es linked to the dwelling. Piped water has eased the workload of women, particularly in households that raise cattle. Carrying of water has been the hardest chore of women on such farms. Water has been lifted by various simple techniques. In the developing countries, in conditions where maintenance of the handpump is troublesome because of difficult access to spareparts, im— proved open wells should be considered. The wells could be provided with partially detachable covers. With due respect to the worldwide development project, the handpump has too often been consid» ered just about the only suitable technical solution. The problems connected with handpumps installed in deep boreholes in developing countries are evidently only beginning to surface. Studies undertaken already in the 19305 and 1940s indicated that transported or carried water
was more expensive than pumped water. The time savings are of importance also in the developing countries, when comparing various technical alternatives for water supply. In lifting water, well constructrion and reticu‘ lation systems locally available materials such as tim~ bet and stones were traditionally used in small and medium-size systems. Later, when better construc— tion materials were introduced, the reliability of the systems improved and the coverage was expanded. The long—term experiences show the advantages of having several manufacturers of materials or equip— ment, thereby guaranteeing proper competition. Some developing countries have officially accepted only one or two models of certain technology to secure sparepart supply and maintenance. However, more alternatives should be offered to avoid higher prices due to lack of competition. There are still about half a million people out of five in Finland, who encounter some quantitative and qualitative problems in their water supply. In rural areas handpumps and similar lifting devices are still used. The coverage of piped water supply is 95 per cent. It has taken about 80 years to reach the present level in a country with a fast growing economy and today, a high standard of living. This suggests that much more realistic goals and timefrarnes for the sector plans in developing countries should be set. It also suggests that several technologies of different levels would be necessary. The government started to finance water supply undertakings fairly lately in Finland. This support has, however, been significant, particularly in the case of public water supply networks. Yet, the largest part of the investments has been paid by the consumers through connection charges, annual charges and water consumption fees. This has made it possible to maintain the water supply systems and to expand the systems step by step. Electricity was introduced to the Finnish countryside before cattle shelters and dwellings were pro— vided with piped water, followed first by sewers from dwellings and, thereafter, piped water to dwellings. On the other hand, common piped water systems instead of point-source systems have ex~ panded faster than public sewerage systems. This would suggest that private water sources of one or a few individual households, should be promoted in addition to the public systems also in developing countries. There is a common misconception that waterborne diseases are ”tropical” by nature. The experi— ences in Finland, however tend to show that this is
not necessarily the case. The fetching of water and doing the laundry in the subzero temperatures of
157
Kmko, T. Paying for e in Develofiog Countries
11
Finland have also posed health hazards for women in particular. So far, the official development assistance (ODA)
has supported government organizations: in rural areas water ministries and their regional administration. This support which in itself is important, has perhaps not encouraged the commitment and initiative of the beneficiary population. During the last few years the participation of the beneficiaries
(V)
(vi)
wood were used in well structures before concrete became available. in addition to handpumps, several types of simple water~lifting devices have been used. Early handpumps were made of wood followed later by suction and pressure pumps made of cast iron. Clear positive health effects have been de~ rived from organized water supply systems. Wooden pipes were commonly used before domestic production of metal and plastic
has, therefore, been suggested as a solution. Howev—
(vii)
er, the participation per se is hardly enough to guar— antee the operation and maintenance of a scheme in the long term. In addition to participation, real attention should be paid to consumer commitment via
(viii) Individuals have acted as initiators and man-
monetary and/or non-monetary contributions.
M
pipes.
Cooperatives and associations founded by the consumers themselves could, at least, provide an
alternative solution for organizing water schemes in the developing countries. The input -monetary as well as in-kind —— by the consumers should be seen as components of this institutional development. This would unavoidably lead to the introduction of water charges. At the same time, the idea that water supply is singularly a social service should be abandoned. The development of water supplies in rural and sparsely populated areas has emerged as a central national issue towards the end of the International Water Decade in Finland. Despite differences in development levels, there are many common fea— tures in rural water supply conditions in developed and developing countries. Thus many of the experiences gained from the Water Decade are applicable to any country.
CONCLUSIONS At least the following factors have been important for the water sector development in Finland:
(i) (ii)
(iii) CV)
The water supply for domestic animals has been considered economically more impor— tant than the supply to households. The appreciation of women’s work has increased. Ground water has been fairly accessible although sometimes of poor quality. Locally available materials such as stone and
(X)
agers of water supply systems. Private small—scale enterprises manufactured wooden pipes and pumps. Community-managed water associations have a long tradition.
The experience of modern developed countries, such as Finland, cannot be directly transferred to the developing world. However, the experiences suggest that more realistic timeframe should be set for sector development plans in developing countries. Several types of technology at different levels and thus several service standards should be offered. Perhaps the best contribution would be the analysis of the development of community—managed cooper— atives and other water associations. This tradition dates back to the early 19003 and even today, the associations are dominant in rural areas. Research could also be done on alternative technological solutions. Similarly, the development of water supply and sewerage in urban areas with their implications for the developing world could be studied. Howev~ er, we should not forget that there is a lot that today’s developed countries could also learn from the developing world.
ACKNOWLEDGEMENTS We wish to thank Dr. M. Ware, Messrs. E. Meskus
and S. Muotiala and many other Finnish colleagues for their support. Special thanks go to Mr. T. Skytta and Mrs. K. Skytta for reviewing the draft paper. Financial support from the Academy of Finland and Wihuri Foundation is acknowledged.
Kalko, T. Paying for Water in Developing Countries
158
12
REFERENCES Arlosoroff, 8., Tschannerl, G., Grey, D., Journey, W, Karp, A., Langeneffer, O. and Roche, R. Community water supply. 1987. The handpump option. The World Bank. 202 pp.
Central Statistical Office of Finland (Tilastokeskus). 1952, 1962, 1973, 1982, 1987. Population census 1950, 1960, 1970. Population and housing census 1980,
1985. (In Finnish, Swedish and English). The committee for rationalization of households (Kotiralouden rationalisoimisltomitea) 1950. Maaseudun ve-
denhankinta- ja vicmiitiolojcn parantaminen. (Improvement of rural water supply and sanitation). (Original in Finnish). Hcikkero, T.E. 1987. Kehitysmaiden kchittamisen vailteudet. (Developmental problems in developing countries). Kanava. 5:263—271. (Original in Finnish).
Hjerppe, R. 1989. Finnish economy 1860—1985, growth and structural change. Publications of the Bank of Finland. Helsinki. Katko, T. 1989. Rural water supply development in Finland: possible lessons for the developing world? — Discussion paper. TUT, IWEE, B37. Tampere. Ministry of agriculture and forestry (Maa- ja metsiitalousministerio). 1987. Haja-asutusalueiden vesihuollon kehittamistyiiryhméin muistio. (Report of the task force on water supply development in sparsely populated areas). (Original in Finnish). 60 pp. + Appendices. Nyangeri, E. 1986. Rehabilitation of hand~dug wells and protected springs in Kisii, Kenya. TUT, IWEE, A29. Tampcre. 110 pp. Official statistics of Finland. 1945—1978. Yleinen maatalouslaskenta. Otantatutkimus 1978. (Census of agriculture.1945,1952, 1961, 1971. Sample survey in 1978).
Pylkkiinen, M. 1985. Maaseudun séihkoistéiminen. (Rural electrification). In: Simola (ed). 1985. Vuosisata sa‘hkiss Suomessa. (One century with electricity in Fin-
land). Finnish association of electricity works. pp. 30— 36. (Original in Finnish).
Singleton, F. 1986. The economy of Finland in the twentieth century. University of Bradford. 177 pp. Skytta, T. 1989. Institutional development needs in Sub~ Saharan Africa. In: Katko T. and Morange H. (eds). 1989. Institutional alternatives of water supply services. TUE IWEE, B39. Tampere. 66 pp.
Turpeinen, O. 1979. Fertility and mortality in Finland since 1750. Population studies. 33.1:101—114. Turuncn, H. 1985. Lakeuden joet. Etelfi-Pohjanmaan ve~ sienkfiyton historia. (Rivers of Ostrobothnia. History of water use). pp. 172—186, 228—232. (Original in Finnv ish).
UNICEF 1988. Facts and figures. Various articles. 1961. Special issue on pipe materials. Vesi— talous. 2.1:9—23. (Originals in Finnish, Abstracts in English). The water supply committee (Vesihuoltokomitea). 1967. Partial report B 83. (Original in Finnish). 111 pp. The World Bank. 1989. The World Bank Atlas. 29 pp. Vuorela, T. 1975. Suomalainen kansankulttuuri. (Finnish folklore). pp. 300—303, 398—399. Porvoo/Hclsinlci. (Original in Finnish).
Wire, M. 1952. Vesi ia sen kuljetus maaseututalouksissa. (Water and the conveyance of water in rural house-
holds). Annual journal of the society of agricultural engineering, 1951—1952. pp. 43—5 6. (Original in Finnish, Summary in English). Wire, M. 1953. Kaivotja maaperéi. (Wells and soil). Handbook of water supply. Vesto Ltd. pp. 41—55. Helsinki. (Original in Finnish).
(In Finnish, Swedish and English). Perakylii, O. 1954. Kairattujen puuputkien paineenkestiivyys ja vedenjohtokyky. (The resistance to pressure and the waterconducting capacity of bored wooden tubes).
Ware, M. 1961. Talousveden laatu ja vcdenottopaikat Suo— men maalaiskunnissa. (1'he quality of household water and the water supplies in the rural communities of
Maa~ ja vesirakcntaja, 2:98—102. (In Finnish, Summary
and hydrotechnical investigations 9.1. Helsinki. (Original in Finnish and English).
in English).
Finland in 1958, by the administrative districts). Soil
Received 22 May 1990 Accepted 5 july 1990
Katko. 12 Paying for Water in Developing Countries
159
VII
PUBLICATION VII Katko, T., 1991. Development of Water Supply Associations in Finland
with implications for the Developing Countries. The World Bank, Water
Supply and Sanitation Division. Discussion Paper (Accepted). 70 p.
Reprinted with the permission of the World Bank, Washington D.C.‘ USA.
1 61
KaIko, T. Paying for Water in Developing Countries
November 21,
1990
FINAL DRAFT
UNEDITED
DEVELOPMENT OF WATER SUPPLY ASSOCIATIONS IN FINLAND WITH IMPLICATIONS FOR THE DEVELOPING COUNTRIES
by Tapio S. Katko
Submitted to the World Bank (Accepted)
Mr. Tapio S. Katko Tampere University of Technology (TUT) Institute of Water and Environmental
Engineering (IWEE) P.O.Box 527,
SF— 33101 Tampere 10,
tel. + 358 -31 — 162 867 telex 22313 ttktr sf
telefax + 358 — 31 — 162907
Finland
163
Kalko, I Paying for Water in Developing Counlries
iii PREFACE AND ACKNOWLEDGEMENTS
This study was carried out at Tampere University of Technology (TUT), the Institute of Water and Environmental Engineering (IWEE), between October 1989 and June 1990.
The study has mainly been financed by research grants from the Academy' of >Finland and the Finnish International Development Agency (FINNIDA). The World Bank has given special support throughout the initiation, review and dissemination and has partially financed the study. In addition, the Okobank K Haataja Foundation awarded a personal grant. All the support is gratefully acknowledged. The author wishes to thank especially David Grey, Eero Meskus, Tauno Skytta and prof. Matti Viitasaari for their encouragement and advice. During the survey Jarmo Hukka, Pekka Jalkanen, Antti
Jokela, Mikko Korhonen, Tapani Kappa, Simo Muotiala, Mikko Pyhala,
Leena Saviranta, Paul Silfverberg, Osmo Seppala and Heikki Wihuri offered their expert opinions.
During the field survey many earlier and current staff members of water associations donated their time and effort to the study. The field surveys were assisted by Petri Juhola and Hugues Morange. The draft report was reviewed by John Briscoe, Harvey Garn, Ayse Kudat, Damas Mashauri, Jouko Peltokangas, Laike Selassie, Krisse Skytta, Gordon Tamm, Hannu Vikman and May Yacoob. All this assistance is gratefully acknowledged.
Tampere, November 1990
Tapio Katko
1 65
Kalko, "II Paying for Water in Developing Countries
V
"Development of Water Supply .Associations in Katko, T. 1990. Finland with Implications for the Developing Countries." 70 p. EXECUTIVE SUMMARY
The traditional assumption is that due to different conditions the
development experiences and paths of today’s developed countries
cannot be used for planning possible strategies for the least developed countries. This study analyses the long—term development of rural water supply' in Finland; a country" that used to be one of the most developed somewhat backward but who is today countries in the world. The objective of the study is to review the assumption and show that at least some basic principles of water supply are applicable anywhere in the world.
The study concentrates on water supply associations that have traditionally been dominant institutions in Finnish rural water supply. The study is based on the analysis of institutional changes and focuses especially on open-ended interviews of 122 sector professionals. These persons represented 39 selected case associations and other parties involved in various parts of the country.
Finland has a long tradition of joint cooperative activities in rural areas. These have included various types of cooperatives in agriculture but also, for instance, in telephone and electricity of lake drainage services. In the water field the tradition associations dates from the 17th century. The water associations have played the key role in rural water supply. Institutional Development Trends In this study "association" refers to partnerships, cooperatives, The first stage stock companies and bulk supply companies. associations, from the early 19008 to 1950, were mainly fairly informal partnerships or cooperatives. Typically' they ran gravity systems supplying spring water via wooden pipes. The Government first gave financial support to the sector in 1950. The second stage water associations covered the period from 1950 to the mid— 19705. These associations included also stock companies typical of rural centres. The third stage associations from the mid—1970s up to the present include increasingly small cooperatives in sparsely populated rural areas, but also large bulk sale companies exist.
dominant are cooperatives and partnerships present, At organisation forms for systems serving less than 1 000 people. The overwhelming majority of larger systems is municipally owned and managed. In the 19705 several associations were transformed into or merged with municipal systems. Yet, since then new associations The areas. populated sparsely for established been have institutional diversity of water supply is reinforced by the fact that the bulk sale companies are jointly owned by municipalities and associations.
Each type of association has its advantages and disadvantages. In the long run there is a tendency toward larger integrated systems,
166
Kafka, I Paying for Waxer in Developing Comm'es
vi
but small associations dispersed rural areas.
will
also
be
necessary,
especially
in
Specific Findings The key finding of the study is that the sector development has been highly dependent on private initiative. The Government support to the sector has slowly increased, but has never exceeded 10 per cent of the total investments. Demand has promoted the gradual and dynamic development of water supply. Initially the demand came from home—based production and cattle farming, and later from industry. Thus, productive use of water has been a major factor in rural areas whereas hygienic and health concerns in urban areas. The expansion of common water supply was not carefully planned, but it just "happened" in a favourable environment. Rural supply systems expanded rapidly after domestic production of plastic pipes started in the late 19505. General metering was also introduced then. A water association has a part—time manager, the board and the members or consumers who are the ultimate decision—makers. The other parties include water and environmental authorities in 13 districts, health authorities, municipalities (460 at present), and the private sector. An energetic and determined individual called "champion" is of fundamental importance to any water association. He or, occasionally, she has commonly' been the driving force in initiating and promoting the water supply system. The "champion" has typically‘ been in charge of managing the implementation and later the operation.
Consumers have always paid the major part of the costs including capital costs. In earlier times consumers themselves contributed much of the required labour and materials. Consumers have been traditionally very eager to participate and contribute in the initial phase. But, after the implementation they‘ have shown interest only if operational problems have arisen.
In the initial phase only some 10 to 30 percent of households have been. willing to join the common systenu Most households have joined the system! during' the implementation. The decision of joining a system, or not, is made at the household level. For long, women’s important role as primary water users went unrecognised. At the household level their role has probably been decisive in promoting the joining to a common water supply system. Besides, the Government's financial support to the sector was preceded by the work of a parliamentary committee of nine members, all of whom were women. Water authorities have concentrated on promoting, advising and exploring ground water resources. The financial support has been directed to systems with the highest demand. Since the 19708 the water districts have promoted and supported financially the implementation of large bulk sale water supply systems, and recently‘ also large sewerage systems. Although the financial support in general has been weak, the role of water authorities has been very important in directing the overall development and
167
Kafka, T. Paying for Water in Developing Countries
Vii policy. The role of health authorities has been limited in rural water supply.
In the 19505 rural municipalities did not consider water supply as their duty.
Therefore,
first legislation favoured the forming of
associations. Later municipalities took over many stock companies and merged several cooperatives. Still, for the last decade municipalities have supported financially and by other means the establishment of water supply associations in sparsely populated areas. The private sector has traditionally been partly responsible for planning but mainly for implementation and operational services. The major responsibility for various activities has been shared by the "champion" of the association and the consumers as well as the private sector. With the modernization of society and technology development, the roles of the "champion“ and the consumers have weakened while that of the private sector has grown stronger.
The economies-of—scale seem not to apply to systems serving less than 1 000 people. In these systems associations seem to be able to supply water at lower prices than municipal works. Each water association decides its water tariffs and structures annually according to its financial needs. This is the opposite of the use of geographically uniform tariffs, typical of many developing countries.
Principles and Practises Applicable to Developing Countries
The primary applicable principle is that the development should be based
(n1
consumers’
own
initiative.
Furthermore,
the
external
parties should concentrate their support on areas where they are best. There are many other applicable lessons in spite of the obvious difficulties due to different conditions. It is true that the experiences from one country,
such as Finland,
cannot be directly‘ transferred to other conditions. Yet, it appears that the success of rural water supply has been highly dependent on assigning appropriate roles to the various parties, which is uncommon in many developing countries.
The most crucial difference is the role of central government. This body should concentrate on policy, guidance, promotion and the favour should policy The inventory. resources water establishment of consumer—managed associations for rural water These associations should have the' main management supply. responsibility. Besides, common water supply should be based on Instead of collective real needs and priorities. consumers’ decisions by communities consumers would probably prefer to make External services could be bought decisions at household level. from the private sector, which will develop in a favourable policy The point is that consumers should be allowed to environment. select the service levels they prefer and are willing and able to pay for.
.
Kalko, I Paying hr Water in Deveéaping Countries
168
viii Recommendations
It is recommended that the role of central government in water supply in developing countries should be limited to promotion, guidance, financial and other support, supervision and. water resources inventory. Considerable amount of contributions should be required from consumers. The experiences of water associations in the home countries of external support agencies should be further surveyed and analysed. The same applies to those systems already known to exist in developing countries.
Finally, even in a country with favourable economic development and a policy favouring private initiative, it has taken decades to develop water supply' to its present level. Still, in today’s Finland, half a million people (of a total of 5 million) have inadequate quality or quantity of domestic water. In many developing countries economic growth is small or negative, and often less than the population growth rate. Therefore, more realistic time frames and objectives should be accepted for water supply projects especially in areas with high population growth.
169
Kat/