EPJ Web of Conferences 176, 06004 (2018) https://doi.org/10.1051/epjconf/201817606004 ILRC 28
BOUNDARY LAYER TEMPERATURE MEASUREMENTS OF A NOCTUAL URBAN BOUNDARY LAYER Simon Holloway1 , Hugo Ricketts1,2,* and Geraint Vaughan1,2 1 Centre
for Atmospheric Science, University of Manchester, Manchester, M13 9PL, United Kingdom ∗
[email protected] 2 National Centre for Atmospheric Science, University of Manchester, Manchester, M13 9PL, United Kingdom ABSTRACT A low-power lidar system based in Manchester, United Kingdom has been developed to measure temperature profiles in the nocturnal urban boundary layer. The lidar transmitter uses a 355nm diode-pumped solid state Nd:YAG laser and two narrow-band interference filters in the receiver filter out rotational Raman lines that are dependent on temperature. The spectral response of the lidar is calibrated using a monochromator. Temperature profiles measured by the system are calibrated by comparison to co-located radiosondes. 1
INTRODUCTION
Pollution transport within and out of the atmospheric boundary layer (ABL) is a topic of widespread interest in atmospheric science. The development of the ABL during the day is well understood, but at night the dynamics is more complex, and recreating the evolution of the nocturnal boundary layer (NBL) with a computer model can be difficult. To help understand the dynamics of the NBL, a reliable way to measure temperature is required. A temperature lidar has been developed and calibrated to measure temperature in the NBL over Manchester, United Kingdom. The lidar utilises a low-powered diode-pumped solid state (DPSS) Nd:YAG laser which is cheaper to run and more reliable than flashlamp-pumped lasers. In the receiver, the light is collected using photomultiplier tubes (PMTs) after passing through narrowband interference filters to iso-
late the rotational Raman scattering signal from the elastic scattering. To calibrate the lidar, detailed measurements were carried out using a high resolution monochromator as well as launching radiosondes. 2 2.1
METHODOLOGY Theory
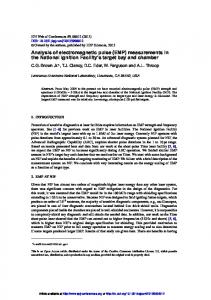
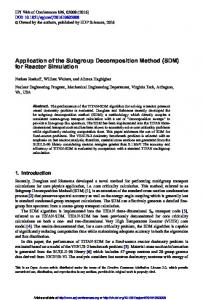
The lidar system used in this study relies on measuring rotational Raman scattering of the transmitted laser beam. The lidar uses a low power laser so it can only be operated at night, as the solar background obscures the signal during the day. Figure 1a shows the rotational Raman spectra for nitrogen and oxygen at 270K. As the temperature increases, the distribution in intensity of the Rotational Raman lines shifts further away from the transmitted wavelength. By selecting the wavelengths shown by the filter profiles it is possible to relate the ratio of the light passing through the "near" and "far" filters to the temperature of the atmosphere [1]. This ratio is shown in Figure 1b. 2.2
Transmitter
The lidar transmitter is a diode-pumped solid state Nd:YAG WAVE-Y-1000-355 laser built by Elforlight Ltd which is tripled to produce a wavelength of 355nm. The laser has a pulse energy of 240µJ and pulse repetition frequency (PRF) of 1000Hz. Using a low powered laser with high PRF allows measurements in the
© The Authors, published by EDP Sciences. This is an open access article distributed under the terms of the Creative Commons Attribution License 4.0 (http://creativecommons.org/licenses/by/4.0/).
EPJ Web of Conferences 176, 06004 (2018) https://doi.org/10.1051/epjconf/201817606004 ILRC 28
355nm filter to obtain the elastic backscatter. The light from each of these filters is passed through a spatial filter to minimise background noise and then measured using a PMT. Figure 1a shows the narrowband filters which were chosen after modelling which wavelengths would provide the most sensitivity to the change in temperature. Initially, both near and far filters were chosen on the Stokes side of the elastic backscatter line. However, the near filter showed signs of degradation and was replaced by a filter on the anti-Stokes side, so any future degradation would not lead to breakthrough of the elastic signal. 3 3.1
Figure 1: (a) Nitrogen and Oxygen rotational Raman spectral lines at 270K. The spectral responses of the two Raman receiver channels are overlaid. (b) Lookup table to convert the ratio of the Raman channels to temperature.
boundary layer without saturation of the detectors. The transmission optics expand the beam by a factor of 10x to minimise divergence and to comply with eye-safety. 2.3
Receiver
The backscattered light is collected using a 60cm diameter Nasmyth-Cassegrain type telescope and diverted into a beam splitter which splits the light into three interference filters: a "near" filter (a narrowband filter to detect rotational Raman spectra close to the transmission wavelength), a "far" filter (another narrowband filter to detect rotational Raman spectra further away from the transmission wavelength); the remaining light is passed though a broader
2
RESULTS Calibration
To calibrate the lidar system, a halogen lamp was focussed on the main aperture of the telescope. This allowed the whole system to be calibrated simultaneously, including the beam splitter and collimators. The resulting receiver response channels are shown in Figure 1a. The near and far filters have a central wavelength of 353.988nm and 356.485nm with a full width at half maximum value (FWHM) of 0.315nm and 0.783nm, respectively. Figure 1a shows the receiver calibration using unpolarised light. In fact, because the Rotational Raman scattering is 57% polarised parallel to the laser it was necessary to calibrate the receiver separately for polarisations parallel and perpendicular to the laser and combine these in the proportion 4 : 3 to obtain the appropriate calibration curve. For accurate temperature measurements (better than 1K) the spectral calibration needed to be supplemented by an adjustment derived from a co-located radiosonde, using a Windsond system which provided a vertical profile of pressure, temperature, humidity and wind. This
EPJ Web of Conferences 176, 06004 (2018) https://doi.org/10.1051/epjconf/201817606004 ILRC 28
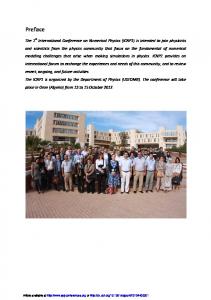
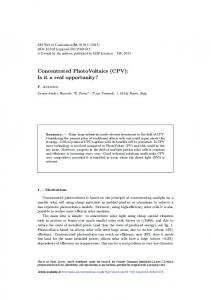
Figure 2: The lidar-derived temperature coinciding with the five Windsond ascents on the night of 24th/25th November 2016 [Times in UTC]. The data has been overlap-corrected. The lidar data is in black with error bars. The red and green lines are the co-located Windsond and the Nottingham routine Met Office radiosonde ascents, respectively.
also allowed an overlap correction to be derived, which was needed with this system below 1km. A total of 17 sondes were launched in the winter of 2016/17. This enabled a direct comparison of temperatures calculated from the lidar data and the sondes, after using one of the sondes to adjust the calibration. On the night of 24th/25th November 2016 five sondes were launched throughout the night to check whether the lidar experienced any drift overnight. Figure 2 shows the five sonde ascents and their corresponding lidar profiles. No significant drift is visible between ascents. The overlap correction for the lidar data was calculated using the 00UT sonde ascent and demonstrates that temperature can be retrieved between the heights of 0.5km and 2 − 3km, after the overlap correction. 3.2
Preliminary lidar observations
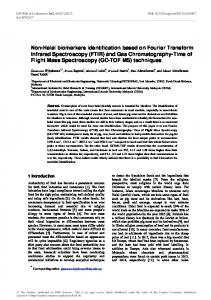
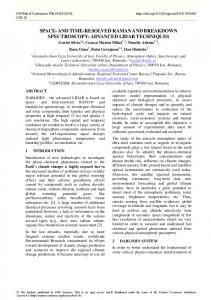
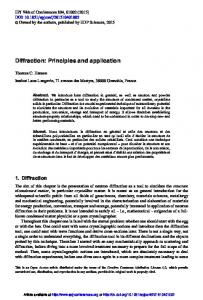
Data presented in Figures 3 and 4 were collected using 15m range gates, with a time resolution of 30s. These were vertically smoothed using a moving boxcar average of 75m and temporally smoothed with a boxcar of width 5 minutes. The aerosol indicator plotted in Figure 4 was produced by taking the ratio between the
3
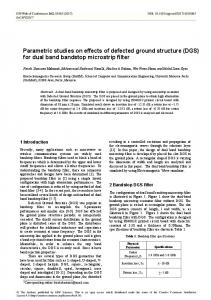
corrected count rates of the elastic and far-field channel signals. Below 400m there is an error in data caused by saturation of the elastic channel. Data uncertainty was determined by taking the Poisson noise arising from the PMTs from each of the channels. Figures 3 and 4 show temperature and aerosol measurements from the lidar on the night of 24th/25th November 2016, respectively. In both figures some low-level intermittent cloud was obscuring the lidar beam at about 900 metres between 18UT and 24UT. When cloud is not present, Figure 3 clearly shows the inversion at about 800 metres at the beginning of the night. The inversion then increases to about 1km by the end of the night. This is corroborated by the increase in the height of the aerosol in the residual layer observed in Figure 4. A more quantitive analysis of the temperature data in Figure 3 shows an increase in temperature above the inversion of about 7 − 8K, which is also observed in the sonde launches in Figure 2. The data also show a slight increase in temperature of about 2K at about 500 metres. This is not observed in the sonde data and is under further investigation.
EPJ Web of Conferences 176, 06004 (2018) https://doi.org/10.1051/epjconf/201817606004 ILRC 28
tion is also consistent with the aerosol backscatter profiles as measured by the elastic channel. Further refinements to the lidar will enable the measurements to extend lower in the atmosphere and follow the evolution of residual layers within the boundary layer. ACKNOWLEDGEMENTS
Figure 3: Plot of temperature above the lidar for 24th/25th November 2016. Some low-level cloud is visible between 18UT and 24UT at about 900 metres as well as the after 04UT at 200 metres.
Simon Holloway wold like to thank the Natural Environment Research Council of the United Kingdom for his PhD funding (NERC Grant: NE/L501591/1). Professor Geraint Vaughan and Dr Hugo Ricketts would like to thank the National Centre for Atmospheric Science (NCAS) of the United Kingdom. References [1] Vaughan, G., Wareing, D. P., Peplar, S. J., Thomas, L., Mitev, V., 1993: Atmospheric Temperature Measurements made by Rotational Raman-scattering, Appl. Opt. 32, 27582764.
Figure 4: Plot of the ratio of elastic to far channel backscatter above the lidar for 24th/25th November 2016. This functions as an indicator of aerosol and shows the lifting of the inversion overnight.
4
CONCLUSIONS
We have shown that a boundary-layer temperature lidar based on a DPSS laser is capable of measuring the evolution of the boundary-layer inversion over the course of the night over the city of Manchester in the United Kingdom, with the lidar temperatures comparing well with a series of co-located radiosondes. The evolu-
4