Peer-assisted VoD Systems: an Efficient Modeling Framework Delia Ciullo, Valentina Martina, Michele Garetto, Emilio Leonardi, Giovanni Luca Torrisi
To cite this version: Delia Ciullo, Valentina Martina, Michele Garetto, Emilio Leonardi, Giovanni Luca Torrisi. Peer-assisted VoD Systems: an Efficient Modeling Framework. [Research Report] RR-8184, 2012.
HAL Id: hal-00759377 https://hal.inria.fr/hal-00759377 Submitted on 17 Dec 2012
HAL is a multi-disciplinary open access archive for the deposit and dissemination of scientific research documents, whether they are published or not. The documents may come from teaching and research institutions in France or abroad, or from public or private research centers.
L’archive ouverte pluridisciplinaire HAL, est destin´ee au d´epˆot et `a la diffusion de documents scientifiques de niveau recherche, publi´es ou non, ´emanant des ´etablissements d’enseignement et de recherche fran¸cais ou ´etrangers, des laboratoires publics ou priv´es.
Peer-assisted VoD Systems: an Efficient Modeling Framework
December 2012 Project-Teams Maestro
ISSN 0249-6399
RESEARCH REPORT N° 8184
ISRN INRIA/RR--8184--FR+ENG
Delia Ciullo, Valentina Martina, Michele Garetto, Emilio Leonardi, Giovanni Luca Torrisi
Peer-assisted VoD Systems: an Efficient Modeling Framework Delia Ciullo∗ , Valentina Martina† , Michele Garetto‡ , Emilio Leonardi§ , Giovanni Luca Torrisi ¶ Project-Teams Maestro Research Report n° 8184 — December 2012 — 21 pages
Abstract: We analyze a peer-assisted Video-on-Demand system in which users contribute their upload bandwidth to the redistribution of a video that they are downloading or that they have cached locally. Our target is to characterize the additional bandwidth that servers must supply to immediately satisfy all requests to watch a given video. We develop an approximate fluid model to compute the required server bandwidth in the sequential delivery case, as well as in controlled Bit-Torrent like swarms. Our approach is able to capture several stochastic effects related to peer churn, upload bandwidth heterogeneity, non-stationary traffic conditions, which have not been documented or analyzed before. At last, we provide important hints for the design of efficient peer-assisted VoD systems under server capacity constraints. Key-words: Video-on-demand, peer-to-peer, performance evaluation
A preliminary version of this paper appeared at IEEE INFOCOM Mini-Conference 2012 [1]. ∗ † ‡ § ¶
Inria Sophia Antipolis, France,
[email protected] Politecnico di Torino, Italy,
[email protected] Università degli Studi di Torino, Italy,
[email protected] Politecnico di Torino, Italy,
[email protected] CNR, Italy,
[email protected]
RESEARCH CENTRE SOPHIA ANTIPOLIS – MÉDITERRANÉE
2004 route des Lucioles - BP 93 06902 Sophia Antipolis Cedex
Modélisation efficace de systèmes de vidéo à la demande assistés par les pairs Résumé : Nous analysons un système de vidéo à la demande (VoD) dans lequel les utilisateurs contribuent à la redistribution d’une vidéo téléchargée ou mise en cache localement. Notre objectif est de caractériser la bande passante des serveurs nécessaire pour satisfaire sans délai toutes les requêtes relatives à une même vidéo. Nous développons un modèle fluide approximatif pour calculer la bande passante nécessaire lorsque les requêtes sont servies séquentiellement et lorsque des torrents contrôlés, type BitTorrent, sont utilisés. Notre approche prend en compte plusieurs aspects stochastiques liés à la volatilité des pairs, à l’hétérogénéité de la bande passante montante et à la non stationnarité du trafic, aspects qui n’ont été ni documentés ni analysés auparavant. Enfin, nous fournissons d’importantes indications pour la conception de systèmes VoD assistées par des pairs qui soient efficaces quand la capacité des serveurs est contrainte. Mots-clés : Vidéo à la Demande, pair-à-pair, évaluation des performances
Peer-assisted VoD Systems: an Efficient Modeling Framework
1
3
Introduction
The efficient distribution of video contents (from short video clips to high-definition movies) will be one of the main challenges of the future Internet. According to Cisco forecasts [2], the combination of all forms of video (live streaming, video-on-demand and P2P file sharing) will exceed 90% of all global consumer Internet traffic by 2015, posing a tremendous challenge to both content providers and network operators. Traditional (client-server) Content Delivery Networks (CDN) help alleviate the traffic on the transport infrastructure by “moving" contents close to the users, however they do not solve the scalability problem of data centers and server farms, whose resources (bandwidth/storage/processing) increase linearly with the user demand and the data volume. Peer-assisted video distribution architectures, in which users contribute their upload bandwidth to the system while viewing the requested video, have been advocated as a viable alternative to traditional CDNs to reduce the server workload and guarantee the scalability to large populations of users [3, 4]. Several peer-assisted systems have already been deployed, such as PPLive, GridCast, PPStream, TVU, SopCast [5, 6, 7, 8, 9]. Despite the wide popularity gained by existing applications, several fundamental questions remain unanswered about the design of video streaming systems and the potential benefits of the peer-assisted approach. Indeed, the unpredictable nature of users’ cooperation, that cannot always guarantee the strict quality-of-service requirements of online video; the added complexity on the control plane due to signalling and chunk scheduling; and the need to provide incentive mechanisms to the users, tend to discourage the content providers to adopt peer-assisted solutions. In our work, we focus on peer-assisted Video-on-Demand (VoD) systems, in which users can browse a catalog of available videos and asynchronously issue requests to watch a given content, which are ideally immediately satisfied by the system, with the optional support for VCR actions such as pause and jump forward/backward. Notice that Video-on-Demand (VoD) systems are quite different from live video streaming applications, in which users join the distribution of a given TV channel at random points in time, but peers connected to the same channel watch the content almost synchronously. In peer-assisted VoD systems, users interested to a specific video can retrieve it from servers (CDN modality), from peers downloading/watching it, and from users storing a copy of it in their computer/Internet TV memory or in dedicated set-top-boxes remotely controllable by the network operator [10]. Our main contribution is a stochastic fluid framework that allows to approximately estimate the additional bandwidth that servers must provide to satisfy all requests to watch a given video. Our methodology can account for several stochastic effects related to peer churn, upload bandwidth heterogeneity, non-stationary traffic conditions, which have not been analyzed before, providing a useful tool for the analysis and design of VoD systems. We consider both the simple sequential delivery scheme, in which users download the video chunks sequentially, as well as non-sequential delivery schemes in which chunk swarming strategies similar to BitTorrent are allowed (to some extent) to improve the system performance. The analytical approach described in this paper complements the analysis presented in [11], in which we obtain rigorous bounds for the sequential delivery scheme (under stationary traffic conditions) and asymptotic results as the number of users increases. With respect to [11], we extend the analysis to nonsequential delivery schemes and non-stationary traffic conditions, with a different goal in mind, i.e., to provide a performance evaluation tool that can be readily used for system design and optimization. We emphasize that in our work we do not consider issues related to optimal replication strategies of heterogeneous contents (in size and popularity) or optimal peer resource allocation (in terms of storage and upload bandwidth) in the presence of multiple videos (e.g., universal streaming architectures). This because we focus on the bandwidth requested from the servers to distribute a given video, assuming that the peer resources allocated to it (i.e., number of copies available in the system and the amount of upload bandwidth devoted to the considered video) are given. Our analysis can be combined with optimal RR n° 8184
4
Ciullo & Martina & others
resource and replication strategies for universal streaming architectures.
2
Model
2.1 System assumptions We model a fairly general peer-assisted VoD system. Users1 run applications that allow them to browse an online catalog of videos. When a user selects a video, we assume that the request is immediately satisfied and the selected video can be watched uninterruptedly till the end (i.e., a continuity index equal to 1 is guaranteed). This is possible only if the system is able to steadily provide to each user a data flow greater than or equal to the video playback rate. Users contribute their upload bandwidth to the video distribution, thus they can retrieve part of the video (or even the entire video) from other peers, saving servers resources. The main goal of our analysis is to characterize the additional bandwidth that servers must supply (in addition to that contributed by peers) to guarantee continuity index 1 to all watching users. By so doing, we provide a fundamental tool to properly dimension the CDN infrastructure supporting the VoD system. We focus on a given video of duration Tv seconds and size L bytes, which is played back by the users’ applications at rate dv = L/Tv bytes/s. Clearly, to guarantee continuous playback each user must at least receive video chunks sequentially at rate dv . As a widely adopted strategy to mitigate bandwidth fluctuations, applications pre-fetch and buffer video chunks before playback (notice that we consider VoD systems, hence we assume, in contrast to live streaming systems, that all chunks are immediately available, at least at the servers). In our model, we assume that the system provides to each user a fixed target download rate d ≥ dv (we assume that the download bandwidth on the access links of the users is large enough that it does not constitute a bottleneck). In general, the target download rate of a peer could be adapted to the portion of video being downloaded, or even depend on some peer’s characteristics (such as its upload bandwidth). By imposing a constant target download rate d ≥ dv at each user we simplify the analysis, while obtaining a conservative prediction with respect to the case in which the target download rate is adapted over time and to the peer characteristics. Notice that the target download rate d can be chosen by the system. We will show that in some cases, unexpectedly, the optimal value of d (i.e., the one that minimizes the average bandwidth requested from the servers) is actually larger than dv . The amount of upload bandwidth with which peers contribute to the redistribution of the video that they are downloading may or may not be under the control of the system. In our analysis, we assume that the upload bandwidth available at a peer is a random variable with given distribution. This way, we encompass both the realistic case of users with heterogeneous Internet connections (i.e., ADSL, fiber, LAN) and cross-traffic fluctuations, and the case in which the peer upload bandwidth allocated to the given video is tuned by the system (such as in universal streaming architectures). More specifically, the amount of upload bandwidth with which users contribute at a given time to the redistribution of the considered video is modeled by a random variable U with cumulative distribution function FU (w), mean 2 . The random variables denoting the instantaneous upload bandwidths of the users are U and variance σU assumed to be i.i.d. (identically and independently distributed).
2.2 Peers dynamics We need to incorporate in our analysis a model describing how peers join the distribution of the considered video, and when and how they leave the system, stopping to contribute their upload bandwidth. To this 1 In
this paper we use the terms peer and user interchangeably.
Inria
Peer-assisted VoD Systems: an Efficient Modeling Framework
5
aim, we adopt a very flexible model that allows to consider a non-stationary video request process, and general peer churn, which is an another crucial feature of any realistic P2P system. In particular, we assume that the arrival process of requests for the considered video follows a timevarying Poisson process of intensity λ(t). Assuming that at a given time the arrival process is Poisson is reasonable, since users behave independently of each other, and their requests are immediately satisfied. On the other hand, a video (e.g., a typical movie) can be long enough that the rate at which it is requested varies significantly during the playing time, due to daily traffic fluctuations, or rapidly-changing video popularity. We account for this fact assuming that the video request process is described by an nonhomogeneous Poisson process with time-varying intensity λ(t), which can possibly be equal to zero before a given time t0 , to model a newly introduced video inserted into the catalog at time t0 . The dynamics of peer participation in the distribution of a given video must account for the fact that activity periods of the users are highly heterogeneous, as observed in several measurement studies [4]: some users stop watching the video after a very short time since the beginning, because they realize they are no longer interested in it; most users who decide to watch the video shut down the computer/InternetTV towards the end of it; some of them keep the application running for prolonged time after the end of the video; those running set-top-boxes can be considered to be always active and serving other peers (until they stop contributing to the distribution of the considered video). We account for general user behavior assuming that the activity period of a user (i.e., the interval during which a user contributes its upload bandwidth to the system, starting from the instant at which the video has been requested) is described by an arbitrary random variable T with finite mean T and complementary cumulative distribution function GT (x). The activity periods of the users are assumed to be i.i.d. It follows from our assumptions that the number of active users N (t) at time t is distributed as the number of customers in an M/G/∞ queue with time-varying arrival rate, hence it follows a Poisson distribution with time-varying mean N (t) given by Z ∞ λ(t − x)GT (x) dx (1) N (t) = 0
In our analysis we need to distinguish two classes of active users: those who are still downloading the video, and those who have completed the download (referred R τto as seeds in the following). Let τd = L/d be the time needed to download the whole video, and T d = 0 d GT (x)dx the average time spent by peers downloading the video. The number of downloading peers at time t, denoted by Nd (t), follows a Poisson distribution of mean N d (t) given by Z τd λ(t − x)GT (x) dx (2) N d (t) = 0
Then standard properties of Poisson processes allow to say that the number of seeds at time t, denoted by Nseed (t), follows a Poisson distribution of mean N seed (t) = N (t) − N d (t). We define as instantaneous system load γ(t) the quantity γ(t) =
d · N d (t) U · N (t)
(3)
which is the ratio between the average data rate requested at time t by downloading peers and the average upload rate provided by all active users at time t. Borrowing the terminology adopted in previous work [3, 12] we say that at time t the system operates in deficit mode if γ(t) > 1, in balanced mode if γ(t) = 1, and in surplus mode if γ(t) < 1. d We also introduce the per-user system load γp = d·T , which is the ratio between the average amount U ·T of data that are downloaded by a peer, and the average amount of data that a peer is able to offer to other peers. Note that by construction γp is equal to the (constant) instantaneous system load in the case of a stationary user arrival process. In ergodic systems, γp can be regarded as the time average of γ(t). RR n° 8184
6
Ciullo & Martina & others
Table 1: Notation Symbol L dv Tv d U T Td λ(t) N (t) N d (t) N seed (t) S d (t) S seed (t) S(t)
Definition video size (bytes) video playback rate (bytes/s) video playback duration (s), Tv = L/dv target download rate (bytes/s) average user upload bandwidth (bytes/s) average user activity period (s) average time spent downloading the video (s) arrival rate of requests for the video at time t average number of active users at time t average number of downloading users at time t average number of seeds at time t average bandwidth requested by downloading users at time t average bandwidth offered by seeds at time t average bandwidth requested from the servers at time t
2.3 Performance metrics The main goal of our paper is to characterize bandwidth required from the servers to guarantee an optimal quality of experience (i.e., continuity index 1) to users. Let S(t) be the random variable denoting the additional bandwidth that the servers must supply at time t to satisfy all active downloads of the considered video. We denote by S(t) and σS2 (t) the mean and variance of S(t), respectively. Since in practice there are multiple videos to be served concurrently by the system, statistical multiplexing arguments suggest that a good design goal is to minimize the mean value S(t) of the server bandwidth required by a single video. Therefore, this will be the main metric that we will look at in our performance analysis. Table 1 summarizes the notation of our model.
3
Analysis
3.1 Sequential delivery We start considering the simple case in which users download the video chunks sequentially. This scheme is simple to implement, as it does not require complex chunk/peer selection mechanisms such as those needed in BitTorrent-like chunk swarming schemes. More importantly, the sequential delivery scheme is analytically tractable and provides an upper bound to the server bandwidth requested by non-sequential schemes. Let S (t) be the aggregate bandwidth requested by the downloading users at time t, and Sseed (t) = PNseed (t) d Ui be the aggregate upload rate offered by the seeds at time t. Then the bandwidth requested i=1 from the servers at time t is given by S(t) = max{0, Sd (t) − Sseed (t)}.
(4)
Focusing on Sd (t), we first condition this quantity on the number of downloading users k, defining Sd (t, k) , (Sd (t) | Nd (t) = k) Inria
Peer-assisted VoD Systems: an Efficient Modeling Framework
7
After characterizing Sd (t, k), the evaluation of S(t) is easy, since the distribution of Nd (t) is known (a Poisson distribution of mean N (t)), while Sseed (t) is a compound Poisson random variable which does not depend on k. To evaluate Sd (t, k) under sequential download, we start observing that, if all peers download the video sequentially at common rate d, a peer can only redistribute video pieces to peers arrived later on in time. Proposition 1. Quantity Sd (t, k) satisfies the following recursive equation: ½ d k=1 Sd (t, k) = d + max{0, Sd (t, k − 1) − Uk } k>1
(5)
Proof. The case k = 1 is obvious. The recursive expression for k ≥ 2 can be easily explained if we look at the users in reverse order with respect to the arrival time into the system, i.e., user k arrives before user k − 1. Suppose that we know the server bandwidth Sd (t, k − 1) needed in the presence of k − 1 users. Then user k can reduce this rate by its upload bandwidth Uk , possibly bringing the server rate to zero. Instead, user k cannot be helped by any other peers, hence it requires fresh new content from the server at rate d. The expression in (5) provides the key to the analytical approximation developed in the next section. Alternate formulations of quantity Sd (t, k) exist (see [3, 12, 11]). Here, we just mention that in [11] we find a connection between the stochastic process described by (5) and a random walk with increments d − U , which allows to obtain analytical upper bounds to the server bandwidth and to characterize its asymptotic behavior for large number of users.
3.2 Gaussian approximation In the sequential delivery case, we can characterize the distribution of the server bandwidth using a second-order approximation. The idea is to approximate the distribution of the quantity Sd (t, k − 1) − Uk in (5) (for each k ≥ 2) by a normal distribution matching the first two moments of this quantity. We can then apply standard formulas of the truncated normal distribution to derive the first two moments of Sd (t, k) as a function of the first two moments of Sd (t, k − 1). This provides a recursive technique to compute the first two moments of Sd (t, k) for any k, starting from the exact values known for k = 1. Our gaussian approximation is motivated by the fact that significant excursions of Sd (t) (i.e., away from the lower limit d) result from the accumulation of several random contributions d − U , thus the central limit theorem can be invoked to justify the convergence to a normal distribution. A similar approximation is subsequently applied to take into account the effect of the seeds, whose aggregate contribution Sseed (t) can be well described by a gaussian distribution for sufficiently large number of seeds. Notice that an exact evaluation of the distributions (or just the first few moments) of S(t) and Sd (t, k) is difficult, due to the presence of barriers at zero and d, respectively. More in detail, let us start introducing some notation and standard results related to the normal distribution. Let N (w) be the probability density function of the standard normal distribution (having mean 0 and variance 1), and Q(w) its complementary cumulative distribution function. Let y be a random variable distributed according to a normal distribution N (µ, σ) of mean µ and standard deviation σ. Then it can be proved that the first moment of the random variable y ′ = max{0, y} has the following expression: ³ µ´ ³ µ´ E[y ′ ] = σN − + µQ − (6) σ σ while the second moment is given by ³ µ´ ³ µ´ + (σ 2 + µ2 )Q − . (7) E[y ′2 ] = σµ N − σ σ RR n° 8184
8
Ciullo & Martina & others
Let S d (t, k) and σS2 d (t, k) be the mean and variance of Sd (t, k). Our recursive procedure to approximately compute S d (t, k) and σS2 d (t, k) for all k starts from the initial known values S d (t, 1) = d and σS2 d (t, 1) = 0 (see (5)). For a given k ≥ 2 we approximate Sd (t, k − 1) − Uk by a normal random 2 . Defining the random variable y of mean µ = S d (t, k − 1) − U and variance σ 2 = σS2 d (t, k − 1) + σU ′ variable y , max{0, y} ≃ max{0, Sd (t, k − 1) − U }, from (5) we obtain: S d (t, k) ≃ σS2 d (t, k)
≃
d + E[y ′ ] ′2
(8) ′ 2
E[y ] − E[y ] .
(9)
Applying (6) and (7) we can compute the first and second moment of variable y ′ in (8,9). This provides the recursion to compute S d (t, k) and σS2 d (t, k) for all k. To account for the effect of the seeds (if any), we apply once more the normal approximation, as follows. Let S(t, k) = max(0, Sd (t, k) − Nseed (t)) be the server bandwidth necessary at time t, assuming that there are k downloading users and Nseed (t) seeds. Moreover, let S(t, k) and σS2 (t, k) be the mean and variance of S(t, k). We observe that Sseed (t) is a compound Poisson random variable, whose moments can be computed exactly in close-form. In particular, the mean of Sseed (t) is equal to N seed (t)U , whereas its variance is 2 2 + U ). We approximate Sd (t, k) − Sseed (t) by a normal distribution y of mean equal to N seed (t)(σU 2 2 µ = S(t, k) − N seed (t)U and variance σ 2 = σS2 (t, k) + N seed (t)(σU + U ), and apply again (6) and (7) ′ to compute the first and second moment of y = max{0, y} ≃ S(t, k). Finally, the mean server bandwidth S(t) (and similarly its variance) can be obtained deconditioning with respect to k: X S(t) = S(t, k)P(Nd (t) = k) (10) k≥1
The entire computational procedure has numerical complexity Θ(kmax ), where kmax is a suitable value such that P(Nd (t) > kmax ) < ǫ is negligible (in our results we set ǫ = 10−6 ).
3.3 Extension to non-sequential delivery So far we have restricted the analysis to the case in which users receive the video chunks sequentially. Although conceptually simple, this scheme is clearly sub-optimal when users download data at a rate larger than the playback rate: recall that in this case users can download in advance video chunks needed in the future, and this prefetching does not necessarily have to be done sequentially. Actually, by allowing out-of-sequence delivery the system can better exploit the upload bandwidth of the peers. Chunk-based, swarming approaches like those commonly used in P2P bulk transfers (e.g., BitTorrent) can be applied to VoD systems with the additional constraint that individual chunks must be downloaded before specific deadlines to avoid interrupting the video playback. A common approach to combine the efficiency of P2P swarming with the strict delay constraints of VoD is to allow users to receive also out-of-sequence chunks of the video within a limited “sliding window" of data starting from the point currently played. For simplicity, instead of considering an actual sliding window, we divide the video into a fixed number W of non-overlapping segments of size LW , L/W . We denote by TW , LW /d = τd /W the time needed to download a segment. Users who are concurrently downloading the same segment, besides helping users downloading previous segments can help each other in a swarming fashion, i.e., we assume that, within a segment, we can exploit also chunk-based, out-of-sequence distribution. This model is able to capture the behavior of realistic sliding window applications, while keeping the analysis simple. Below we show how the analysis developed in Section 3.1 can be adapted to study this scheme as well, permitting us to assess the performance gain achievable by non-sequential schemes. Inria
9
Peer-assisted VoD Systems: an Efficient Modeling Framework
Indeed, by aggregating all users belonging to the same segment into a sort of ‘meta-peer’ we can essentially apply the same analysis as before to a chain of W meta-peers downloading the video segments sequentially. Let Nv (t), 1 ≤ v ≤ W , be the random variables representing the number of peers concurrently downloading segment v at time t. Notice that this number is Poisson-distributed with mean N v (t) =
Z
TW
λ(t − (v − 1)TW − x)GT (x + (v − 1)TW ) dx
(11)
0
Let Sd (t, v) be the bandwidth that the servers (or the seeds) must supply at time t to all users downloading segments of index smaller than or equal to v. Using the same reasoning as in the proof of Proposition 1, quantity Sd (t, v) can be computed through the following recursive equation, Nv (t)−1 o Nv (t) n X X d Ui + Sd (t, v) = max 0, Sd (t, v − 1) − i=1
i=1
+ d · INv (t)>0
1≤v≤W
(12)
with Sd (t, 0) = 0 and the convention that summations are equal to zero if Nv (t) = 0. Notice that (12) is analogous to (5), if we consider all peers within a segment v (if any) as a single meta-peer having virtual ˜ (t, v) = d + PNv (t) (Ui − d). upload bandwidth U i=1 The first two moments of Sd (t) = Sd (t, W ) can be computed using a second-order approximation similar to the one adopted for the case of sequential delivery in Section 3.2, i.e., by assuming that quantity ˜ (whose moments can be computed exactly) has a normal distribution, and then using Sd (t, v − 1) − U (6) and (7) to compute the first and second moments of the positive part of it. The analysis is made slightly more complicated by the fact that we need to consider also the case in which there are no users downloading a segment (Nv (t) = 0), which requires some care. More formally, let P0 (t, v) = e−N v (t) be the probability that there are no users downloading segment v at time t. (2) Let S d (t, v) and S d (t, v) be the first and second moment of Sd (t, v), respectively. To start our (2)
iterative computation, we set S d (t, 0) = 0 and S d (t, 0) = 0. Now, suppose that we know S d (t, v − 1) (2)
and S d (t, v − 1) for a given v ≥ 1. Conditioning on the event Nv (t) > 0, we approximate Sd (t, v − ˜ by a normal random variable y of mean 1) − U µ = S d (t, v − 1) −
N v (t) (U − d) − d 1 − P0 (t, v)
and variance (2)
σ 2 = S d (t, v − 1) − (S d (t, v − 1))2 +
N v (t) σ2 1 − P0 (t, v) U " ¶2 # µ N v (t) + (N v (t))2 N v (t) + − (U − d)2 1 − P0 (t, v) 1 − P0 (t, v)
and apply (6) and (7) to compute the first moment E[y ′ ] and second moment E[y ′2 ] of y ′ = max{0, y}. Then we obtain the first two moments of Sd (t, v) as: S d (t, v) = P0 (t, v)S d (t, v−1)+(1−P0 (t, v))(d + E[y ′ ]) (2)
(2)
S d (t, v) = P0 (t, v)S d (t, v−1)+(1−P0 (t, v))(E[y ′2 ]+d2 +2E[y ′ ]d) RR n° 8184
10
Ciullo & Martina & others
Iterating the above computation we can compute the first two moments of Sd (t, v) for any v. At last, the impact of seeds is taken into account in a way analogous to the sequential case. Note that the computational procedure for the non-sequential case has numerical complexity Θ(W ). The extreme case W = 1 of just one segment (i.e., the entire video) corresponds to a scheme in which chunks can be downloaded in any order, and the system can exploit the upload bandwidth of any peer irrespective of its arrival time. In this case we have, d (t) o n NX (d − Ui ) Sd (t, 1) = max d,
(13)
i=1
which plugged into (4) (in the place of Sd (t)) provides a lower bound to the server bandwidth required by any chunk distribution scheme. In the following, we will refer to the server bandwidth obtained in this way as the completely non-sequential case, or simply the lower bound.
4
Performance under stationary conditions
In this section we report a selection of the most interesting results that we have obtained by our analysis under stationary user arrival process. Since in this case all averages do not depend on t, we will omit for simplicity the indication of time. We normalize to 1 the video playback rate dv , which thus serves as unit for all other bandwidth figures. We assume that users stay in the system for a time at least equal to the watching time, hence T ≥ Tv . Unless otherwise specified, we assume that users’ upload bandwidth U is exponentially distributed. The results obtained by our analytical approximation in Section 3.2 are compared to those obtained by an event-driven ad-hoc simulator, which is used also to evaluate the lower bound described at the end of previous section.
Average server bandwidth
100
approx - U = 0.9 sim - U = 0.9 sim lower bound - U = 0.9 approx - U = 1.0 sim - U = 1.0 sim lower bound - U = 1.0 approx - U = 1.2 sim - U = 1.2 sim lower bound - U = 1.2
10
1
0.1 1
10 100 Average number of users
1000
Figure 1: Comparison of average server bandwidth in the case d = dv , as function of the average number of users N , for different values of U , in the absence of seeds.
4.1 Impact of the number of watching users and seeds Figure 1 reports, on a log-log scale, the average server bandwidth S as function of the average number of users N , in the case d = dv , T = Tv . We consider three different values of average upload bandwidth Inria
11
Peer-assisted VoD Systems: an Efficient Modeling Framework
Average server bandwidth
100
approx - U = 0.9 sim - U = 0.9 sim lower bound - U = 0.9 approx - U = 1.0 sim - U = 1.0 sim lower bound - U = 1.0 approx - U = 1.2 sim - U = 1.2 sim lower bound - U = 1.2
10
1
0.1 1
10
100
1000
Average number of downloading users
Figure 2: Comparison of average server bandwidth in the case d = dv , as function of the number of downloading users N d , for different values of U , in the presence of N seed = 0.1 · N d seeds.
U¯ = 1
Average server bandwidth
U¯ = 0.9
U¯ = 1.2
U¯ = 1.4
15
15
3.5
14
14
3.25
13
13
3
12
12
2.75
11
11
2.5
2.5
10
10
2.25
2.25
9
9
8
8
7
7
6
6
5
5
4
4
1
1
3
3
0.75
0.75
2
2
sim approx sim lower bound
1 0 1
1.2
1.4
1.6
1.8
download rate, d
sim approx sim lower bound
1 0 2
2.2
1
1.2
1.4 1.6 1.8 download rate, d
3.5
sim approx sim lower bound
3 2.75
2
2
1.75
1.75
1.5
1.5
1.25
1.25
0.5
0.5
0.25
0.25 0
0
2
2.2
sim approx sim lower bound
3.25
1
1.2
1.4 1.6 1.8 download rate, d
2 2.2
1
1.2
1.4
1.6 1.8
2 2.2
download rate, d
Figure 3: Average server bandwidth as function of the target download rate d, for different values of U , with N = 100, T = Tv . U = 0.9, 1.0, 1.2, corresponding to systems operating in deficit, balanced, and surplus mode, respectively (here γ = 1/U ). Besides noticing the accuracy of the approximate analysis, it is interesting to see that the average server bandwidth saturates for U = 1.2 (surplus mode) to a value about 3.5 times larger than the corresponding lower bound, which tends to dv = 1. As expected, the average server bandwidth diverges under the deficit and balanced modes. Moreover, in the deficit mode, the sequential system requires asymptotically the same bandwidth as the completely non-sequential system (i.e., the lower bound). In Figure 2 we compare the results obtained in the same system considered above, but assuming that users remain active after the end of the watching time for an exponentially distributed amount of time of mean equal to 10% of the watching time, generating an average number of seeds N seed = 0.1 · N d . Now the systems with U = 1.0 and U = 1.2 operate in surplus mode, whereas the system with U = 0.9 operates very close to the balanced mode (here γ = 1/(1.1 · U )). We observe that, in the presence of seeds, the average server bandwidth requested by systems operating in surplus mode reaches a maximum, after which it goes to zero as the number of users increases. Results such as those reported in Figures 1 and 2 can be useful in system dimensioning, as they allow to estimate, in the surplus mode, the worst-case RR n° 8184
12
Ciullo & Martina & others
server bandwidth which is needed when the number of downloading users N d is not known.
4.2 Impact of the target download rate Even when users tend to leave the system at the end of the watching time, it is still possible to benefit from the positive effect created by the seeds, who absorb part of the fluctuations in the bandwidth requested by downloading peers, shielding the servers. The trick to ‘artificially’ create some seeds is to make the users download the video at rate d > dv , so that they become seeds for other peers before the end of the watching time. Intuitively, however, d should not be set too large to offset the gain achievable by the seeds. Figure 3 illustrates the performance of this strategy in the case of N = 100 users, T = Tv , showing the average server bandwidth as function of d. We observe that for all the considered values of U , the average server bandwidth achieves a minimum for a value of d slightly larger than dv . The impact is particularly striking in the surplus mode (U > 1), in which setting d > dv brings the server bandwidth close to zero.
4.3 Impact of upload bandwidth heterogeneity U¯ = 1.1
U¯ = 0.9
25
14
approx sim sim lower bound
approx sim sim lower bound
12
Average server bandwidth
Average server bandwidth
20
15
10
10 8 6 4
5 2 0
0 0
0.5
1
1.5
Variation coefficient
2
0
0.5
1
1.5
2
Variation coefficient
Figure 4: Comparison of average server bandwidth with N = 100, d = dv , T = Tv , as function of the variation coefficient of peer upload bandwidth, for U = 0.9 (left plot) and for U = 1.1 (right plot). Figure 4 compares the average server bandwidth S as function of the variation coefficient of the peer upload bandwidth (keeping fixed the mean), considering N = 100, d = dv , T = Tv . The average upload bandwidth is equal to either U = 0.9 (deficit mode) or U = 1.1 (surplus mode). Simulation results are supplemented by 95%-level confidence intervals. The upload bandwidth distribution used in the simulations depends on the variation coefficient: for values larger than one, we adopt a secondorder hyper-exponential distribution with balanced means; for values smaller than one, we employ an exponential distribution added to a constant (this explains the small glitch at variation coefficient equal to 1). We observe that the average server bandwidth increases significantly as the variability of upload bandwidth increases, while our approximation tends to provide a conservative prediction.
4.4 Impact of non-sequential delivery To understand the performance gains achievable by adding (in a limited way) BitTorrent-like chunk delivery schemes to the video distribution, we consider two scenarios operating in balanced mode (γ = 1), Inria
13
Average server bandwidth
Peer-assisted VoD Systems: an Efficient Modeling Framework
6
6
5
5
4
4
3
3
2
2 sim - sequential sim - W = 32 sim - W = 16 sim - W = 8 sim - W = 4 sim - W = 2 sim - lower bound
1
0 0
approx - sequential approx - W = 32 approx - W = 16 approx - W = 8 approx - W = 4 approx - W = 2 approx - W = 1
1
0
10 20 30 40 50 60 70 80 90 100
0
10 20 30 40 50 60 70 80 90 100 Average number of users
Average number of users
Figure 5: Average server bandwidth as function of the number of users, with T = Tv , d = dv , γ = 1, for different values of the number of segments W . Comparison between simulation (left plot) and approximate analysis (right plot). in the case of uniformly distributed user upload bandwidth. In the first one (see Figure 5) we vary the number of users, assuming T = Tv , d = dv . Recall that the case W = 1 in our analysis provides an approximation of the lower bound. As we increase the number of segments, we obtain intermediate curves between the completely nonsequential scheme and the pure sequential scheme, which corresponds to W → ∞. Besides noticing the accuracy of the approximation, we observe that swarming schemes provide non-negligible gains over pure sequential schemes only when the average number of users per segment is not too small (say larger than a few units). Recall, however, that larger segments (and thus larger number of users in them) imply larger startup delays. For example, the case W = 32 corresponds to a sliding window of about 4 minutes for a typical movie (2 hours long). As we can see on Figure 5, the benefit of a non-sequential scheme with W = 32 is negligible for the considered values of the number of users (below one hundred). 6 5.5 5
Average server bandwidth
6
sim - sequential sim - W = 64 sim - W = 32 sim - W = 16 sim - W = 8 sim - W = 4 sim - W = 2 sim - lower bound
approx - sequential approx - W = 64 approx - W = 32 approx - W = 16 approx - W = 8 approx - W = 4 approx - W = 2 approx - W = 1
5.5 5
4.5
4.5
4
4
3.5
3.5
3
3
2.5
2.5
2
2 1
1.1
1.2
1.3
1.4
Average activity time / video duration
1.5
1
1.1 1.2 1.3 1.4 1.5 Average activity time / video duration
Figure 6: Average server bandwidth as function of the ratio T /Tv between average activity time and video duration, keeping fixed N = 100, d = dv , γ = 1, for different values of the number of segments W . Comparison between simulation (left plot) and approximate analysis (right plot). In the second scenario (see Figure 6) we fix the total number of users N = 100, and increase the total activity time of the users T (the average upload bandwidth U is reduced accordingly to keep γ = 1). We observe that as we increase the activity time (and thus the number of seeds), the difference in performance RR n° 8184
14
Ciullo & Martina & others
between swarming schemes and sequential delivery becomes less significant.
5
Performance of non-stationary systems
In this section we show how our analytical framework can be applied to study the performance of timevarying systems in which the arrival rate of requests for a given content changes significantly over time. In particular, we will see that the behavior of a non-stationary system can dramatically differ from the one of a stationary system in which the arrival rate of requests is constant, due to a misalignment problem between the temporal evolution of the number of downloaders and the temporal evolution of the number of seeds.
5.1 The effect of daily traffic variations
1 0.9 0.8 0.7 0.6 0.5 0.4 0.3 0.2 0.1 0
120 100 80 60 40 20 0
12 average server bandwidth
140
λ downloaders seeds
number of downloaders / seeds
video request rate, λ(t)
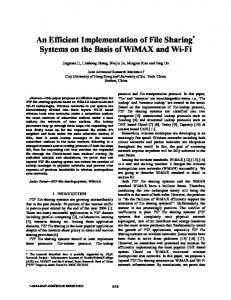
We consider a reference scenario in which the arrival rate of requests for a given video follows a daily pattern which is modeled for simplicity by a sine function of period equal to 24 hours, between a minimum of λ = 0.1 and a maximum of λ = 1, represented by the thick solid line in the top plot of Fig. 7. We first analyze a software-based system in which users contribute their upload bandwidth during the watching time of the video, plus a random additional time in which the application is kept running. We assume that the video duration is Tv = 2 h, and the additional activity time after the end of the video is exponentially distributed with mean 1 h. We normalize dv = d = 1 and assume the upload bandwidth of users to be exponentially distributed with mean U = 0.7. The per-user load is γp = 2/(0.7 · 3) ≈ 0.95. The top plot of Fig. 7 reports the temporal evolution of both the number of downloaders and the number of seeds. Since peers become seeds only after the end of the watching time, the dynamics of downloaders and seeds are misaligned, with a temporal shift about Tv = 2 h.
10 9 8 7 6 5 4 3 2 1 0
18
24
6
12
18
24
6
18
24
6
non-stationary stationary (λ(t) = 1)
12
18
24
6 12 time of day (hours)
Figure 7: Temporal evolution of video request rate (top plot, left y axes), number of downloaders/seeds (top plot, right y axes), and average server bandwidth S(t) (bottom plot), in the software-based system. The effect of this misalignment on the required average server bandwidth is depicted on the bottom plot of Fig. 7, by the solid line labeled ‘non-stationary’, which exhibits a peak preceding the point at which the video request rate is maximum. Fig. 7 reports also a curve labeled ‘stationary’, representing Inria
15
Peer-assisted VoD Systems: an Efficient Modeling Framework
the server bandwidth that would be necessary if the content request rate were constant and equal to λ = 1 (the maximum request rate). We observe that the performance of the non-stationary system is worse than that of the stationary system, both in terms of peak server bandwidth and average server load. This occurs even if the content request rate is always larger in the stationary system.
1 0.9 0.8 0.7 0.6 0.5 0.4 0.3 0.2 0.1 0
average server bandwidth
70
1200
λ downloaders seeds
1000 800 600 400 200
number of downloaders / seeds
video request rate, λ(t)
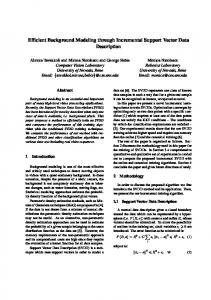
If we increase the activity time after the end of the video, while keeping the same per-user system load γp (either by reducing the upload bandwidth of the users, or equivalently by increasing the download rate of the video, i.e., its resolution/quality), the negative effect of the misalignment problem become worse. As an extreme case, we consider a P2P-VoD system relying on set-top-boxes which are always active and serving the last watched video. To mimic the behavior of set-top-boxes with our model of peer dynamics, we assume that the activity time after watching a movie is much longer than before (in the order of a day), representing a set-top-box which remains always on before the user downloads the next video. In particular, we consider an additional activity time of 22 h, which added to the watching time of a movie leads to T = 1 day. To obtain the same per-user load of the software-based system, we set U = 0.7·3/24.
0 12
18
24
6
12
18
24
6
12
18
24
6
non-stationary stationary (λ = 1) sim trace
60 50 40 30 20 10 0 12
18
24
6
time of day (hours)
Figure 8: Temporal evolution of video request rate (top plot, left y axes) number of downloaders/seeds (top plot, right y axes), and average server bandwidth S(t) (bottom plot), in the set-top-box system. Fig. 8 reports analytical results for this scenario, analogous to those in Figure 7. We have also reported on the bottom plot of Fig. 8 a sample path obtained from simulation, to confirm the analytical prediction. In this case the instantaneous system load γ(t) is severely unbalanced across the day. During peak hours, the bandwidth requested at servers grows very large, while for the rest of the day it is negligible. The problem is that the upload capacity of the seeds, which are very numerous and almost stable along the day (see top plot of Figure 8) is totally wasted for a large fraction of the day. Notice that we are not saying that set-top-boxes are not useful: increasing the activity time of peers (up to the point of having always-on user devices) is very beneficial to the system performance, since the per-user load γp is reduced. However, one must be careful that the instantaneous system load γ(t) can vary significantly around γp , and peak traffic demand cannot be absorbed well by large populations of seeds (set-top-boxes) each devoting a small amount of upload bandwidth to the video distribution. Indeed, to minimize the bandwidth deficit at peak times, the ratio U /d should not become too small. RR n° 8184
16
Ciullo & Martina & others
5.2 The effect of newly introduced videos We now consider a system in which the non-stationarity of the video request process is due to new contents regularly introduced in the catalogue, whose popularity changes over time. We model such a system using a shot-noise process [13]. We assume that new videos are made available in the system at (constant) rate β. The request rate of a given video i inserted at time ti follows an non-homogeneous Poisson process with time-varying intensity λi (t) = Λφ(t − ti ) where φ(t) is a shaping function, defined over t ≥ 0, modeling how the popularity of the video evolves time. We require φ(t) to be an integrable function, and, without loss of generality, we assume that Rover ∞ φ(t) dt = 1. By so doing, Λ equals the average number of times that the video is requested during 0 its lifetime. In general, both Λ and φ(t) could be random, i.e., each file, upon arrival, could be assigned a popularity shape φ(t) extracted from a family of functions with randomized parameters, and a value of Λ taken from a given distribution possibly associated to the chosen shape φ(t). We denote by FΛ,φ the joint cdf of Λ and φ. Our target is to evaluate the average overall server bandwidth Z resulting from the distribution of all videos available in the catalog. Despite the complexity of the system, our approximate model can be exploited to quickly estimate Z under several parameter settings, without running expensive simulations. We briefly summarize the computational procedure for clarity: using (1) and (2) we can analytically compute, for any t > ti , the average number of peers downloading a given video i, and the average number of users acting as seeds for it. Equation (10) provides the mean bandwidth S(t, Λ, φ) requested from the servers at any time t > tiR. Standard numerical integration techniques2 allow to compute the ∞ average amount of data D(Λ, φ) = ti S(t − ti , Λ, φ) dt supplied by the servers for a file characterized by popularity parameters {Λ, φ}, from which we can compute Z D(Λ, φ) dFΛ,φ (14) Z=β Λ,φ
Notice that the average number of users in the system is βΛT . We start considering a scenario in which both Λ and φ are deterministic. In particular, we consider files with exponentially decreasing popularity: φ(t) = µe−µt . Since Z is trivially linear in the arrival rate of new contents (14), we arbitrarily set β = 1. Throughout our experiments we also fix the per-user system load to γp = 0.5, as the effects that we are going to show occur also when users can upload a much larger amount of data than what they request during their activity period. We consider the pure sequential delivery scheme, and normalize dv = d = 1. We further normalize T d = 1, and assume, whenever T > T d , that the additional activity time after downloading the movie is exponentially distributed. Under the above settings the average upload bandwidth of the users, which is assumed to be exponentially distributed, is directly related to T according to U = 2/T . At last, we define χ = 1/(µT d ), which can be thought as the average lifetime of a video (in terms of popularity) normalized by its watching duration. We now investigate the joint impact of the only free parameters: Λ, χ, and T . Fig. 9 reports, for different Λ’s, the average server bandwidth Z as function of user activity period T , for χ = 1 (left plot) and χ = 100 (right plot). We observe that the server bandwidth Z remains low and mainly independent of Λ (i.e., the system can scale up to arbitrarily large number of users), for values of T slightly larger than 1 and smaller than 2. Notice that when T < 2 the average user upload bandwidth (right y axes) is larger than the video download rate (U > 1). When this condition is not met (in general, when U ≤ dv ), the system does not sustain itself, despite the fact that users can potentially upload twice the amount of traffic they download (γp = 0.5). This is again due to the misalignment problem between 2 We
adopted the simple trapezoid rule.
Inria
17
Peer-assisted VoD Systems: an Efficient Modeling Framework
2 10000
Λ = 10000 Λ = 1000 Λ = 100 Λ = 10 U
1000
1.8
2
Λ = 1000000 Λ = 100000 Λ = 10000 Λ = 1000 U
1.8
1.6
1.6 1000
1.4
1.4
100 1.2
1.2 100
10
1
1
1
0.8
0.8
0.6 1 1.5 2 2.5 3 Normalized activity period, T/Td
10
Average upload bandwidth, U
Mean server bandwidth, Z
10000
0.6 1 1.5 2 2.5 3 Normalized activity period, T/Td
Figure 9: Average server bandwidth Z as function of normalized user activity period T /T d , for χ = 1 (left plot) and χ = 100 (right plot), and different values of Λ. The associated average upload bandwidth U = 2/T is reported on the right y axes. downloaders and seeds: when T increases, more seeds becomes available, but too late with respect to the time their upload capacity can be exploited. We emphasize that this is in sharp contrast to what we have seen under stationary conditions, where the effect of decreasing U can be completely compensated by increasing T , so that the system performance is not compromised (see Figure 6). We further notice that this asymptotic behavior (for increasing Λ) occurs for any value of χ (i.e., popularity shape), and that larger values of χ (i.e., files whose popularity decays more slowly) lead to larger values of Z in the regime where the system is able to scale. 1000
20
Mean server bandwidth, Z
3
6
100
2 10
1
T=1 T = 1.3 T = 1.7 T=2 T=3 T=6 T = 20
1.7
1.3 1 0.1
1
10 100 Normalized video lifetime, χ
1000
10000
Figure 10: Average server bandwidth Z as function of the normalized video lifetime χ, for different values of user activity period T , in the case of Λ = 1000. The impact of the video popularity shape is better understood looking at Fig. 10, which reports, in the case of fixed Λ = 1000, the server bandwidth Z as function of the normalized video lifetime χ, for different values of T . First, note that Z is bounded above by βΛT d dv , since in the worst case the system provides rate dv to each downloading user. In our parameters setting, the above upper bound on Z coincides numerically with Λ = 1000. We observe that Z approaches the upper bound for large values of χ (and any T ), for which requests for the same file are so diluted over time that it becomes more and RR n° 8184
18
Ciullo & Martina & others
more unlikely to have peers concurrently downloading the same file (and thus helping other peers). When T increases, the upper bound is approached also for small values of χ, this time because downloads of the same file are so synchronized that the upload bandwidth of users (which decreases with T ) can be exploited only during a short interval equal to T d after the file is inserted into the catalog, and the resulting contribution of peers tends to become negligible. Small values of χ can be the result of videos posted on web pages providing suggestions to the users which are frequently updated: our results suggest that this practice can be harmful as it can compromise an effective peer-assisted distribution (when U ≤ dv ). For T > 2, Z achieves a minimum for a given value of χ. We observe that, for large values of χ (files with slowly decaying popularity), long user activity times are actually beneficial to the system, although in this regime the system is not able to scale to large number of users, as we have seen.
30
200
T=1 150
Mean server bandwidth, Z
1000
T = 1.5
T=3
25
120 20
100 90 80
15
100
70 60
10
50 40
30 1000
α=2 α=1 α = 0.5 α=0 10000 Λ
5
100000
0 1000
α=2 α=1 α = 0.5 α=0
α=2 α=1 α = 0.5 α=0 10000 Λ
100000
10 1000
10000
100000
Λ
Figure 11: Average server bandwidth Z as function of Λ, for different values of the Zipf’s exponent α, and fixed χ = 10. The user activity period is either T = 1 (left plot), or T = 1.5 (middle plot) or T = 3 (right plot). At last, we consider a scenario in which Λ is a random variable, while maintaining the assumption that the popularity decay exponent µ is the same for all files. More specifically, we assume that files belong to 10 different classes, whose request rates follows a Zipf’s distribution of exponent α, i.e., files of class i (1 ≤ i ≤ 10) are requested at rate Λi = ΛK/iα , where K is a normalizing constant such P10 that i=1 Λi = Λ. Note that α = 0 corresponds to the previous scenario in which all files have the same popularity profile. Results are shown in Fig. 11, in which we report the mean server bandwidth Z as function of Λ, for different values of the Zipf’s exponent α, and fixed χ = 10. In the left plot we consider T = 1, i.e., users abandon the system immediately after downloading the video, i.e., no seeds are available. We notice that the server bandwidth Z scales logarithmically with Λ, which can be explained by the lower limit d in (5). In the middle plot we consider T = 1.5, which belongs to the range in which the system performance is mainly insensitive to Λ (see Fig. 9), and thus also to the Zipf’s exponent α. In the right plot, we consider T = 3, for which the system is not able to scale to large number of users. Actually, in this case Z scales linearly with Λ. In conclusion we can say that in non-stationary scenarios the system performance critically depends on the relationship between the average peer upload bandwidth and the download rate: when U ≤ dv the bandwidth deficit cannot be effectively compensated by just increasing the seed availability (i.e, by increasing T ). Smart prefetching policies can in principle reduce the burden on the servers. However, prefetching policies can not be easily implemented in non-stationary (e.g., flash-crowd) scenarios where contents are not available in advance, and their popularity cannot be easily predicted at the early stages. Inria
Peer-assisted VoD Systems: an Efficient Modeling Framework
6
19
Related Work
Stochastic fluid models for BitTorrent-like file-sharing system, accounting for the dynamics of downloaders and seeds, have been proposed for both transient and steady-state regimes [14, 15], but they are not directly applicable to streaming systems. In [16], authors adapt the fluid model in [15] to VoD systems, investigating the impact of different piece selection policies (rarest-first and in-order) on download latency and startup delay, in the case of homogeneous peers. In contrast to [16], we focus on the characterization of VoD systems with strict service guarantees and heterogeneous user upload bandwidths. A stochastic fluid approach to analyze peer-assisted video distribution has been proposed in [17] in the context of live streaming, in which (heterogeneous) peers download and playback content synchronously. Here we apply the stochastic fluid approach to VoD systems, whose dynamics are quite different from live streaming, since users can watch the video asynchronously. A mathematical formulation of the server bandwidth needed under sequential delivery appeared in [4], in which authors resort to a Monte Carlo approach to get basic insights into the system behavior (like surplus and deficit modes). The sequential delivery scheme has been considered also in [12], where authors explore by simulation the effectiveness of different replication strategies to minimize the server load in the slightly surplus mode, as well as distributed replacement algorithms to achieve it. Differently from [12], we provide an analytical approximation that can account for both sequential and non-sequential delivery schemes under any system load, considering also the impact of seeds. In [18], a per-chunk capacity model is developed to show the tradeoff that exists between system throughput, sequentiality of downloaded data and robustness to heterogeneous network conditions. To the best of our knowledge, we are the first to analytically investigate the performance of peer-assisted VoD systems under non-stationary traffic conditions.
7
Conclusion and lessons learned
We have proposed a computationally-efficient methodology to analytically estimate the server bandwidth requested in non-stationary peer-assisted VoD systems. Our approach is highly flexible, and can account for several important effects such as peer upload bandwidth heterogeneity, churning, non-sequential chunk delivery schemes. By applying our performance evaluation methodology under various parameters setting, we have discovered several interesting properties of P2P-VoD systems: - under stationary traffic conditions, in the surplus mode, the server bandwidth achieves a maximum as we increase the number of users, and then decreases to zero provided that T > T d (i.e., the average activity time is larger than the average download time) (Fig. 2); - under the pessimistic assumption that users leave the system after watching the video, the server bandwidth can be minimized by a proper selection of the target download rate, under any system load (Fig. 3); - the server bandwidth increases with the variation coefficient of the peer upload bandwidth distribution (Fig. 4); - the gain achievable by non-sequential schemes over the simple sequential scheme depends critically on the size of the sliding window and the number of downloading users, and vanishes as the number of seeds increases (Fig. 5 and 6); - under non-stationary traffic conditions peer-assisted VoD systems are affected by a misalignment problem between downloaders and seeds. The per-user load γp is not enough to characterize the system performance, which comes to critically depend on the amount of bandwidth contributed by peers while they download the video: when U > dv the bandwidth demanded from the servers is essentially independent from the system size (number of watching users); if U < dv , instead, the bandwidth demanded from the server scales linearly with the system size, regardless of the availability of users as seeds and the per-user system load γp (Fig. 9); RR n° 8184
20
Ciullo & Martina & others
- in the regime where the system does not scale with the number of users, the system performance is further negatively affected by an increase in the content heterogeneity (in terms of popularity) (Fig. 11). We have shown that our analysis provides efficient, accurate predictions of all observed phenomena, providing a useful tool for the design of peer-assisted VoD systems.
References [1] D. Ciullo, V. Martina, M. Garetto, E. Leonardi, and G. L. Torrisi, “Performance Analysis of Nonstationary Peer-assisted VoD Systems,” in INFOCOM Mini-Conference, 2012. [2] “Cisco Visual Networking Index: Global Mobile Data Traffic Forecast Update, 2010–2015,” Website, 2011. [3] C. Huang, J. Li, and K. W. Ross, “Can Internet Video-on-Demand Be Profitable?” in ACM SIGCOMM, 2007. [4] Y. Huang, T. Z. J. Fu, D. ming Chiu, J. C. S. Lui, and C. Huang, “Challenges, Design and Analysis of a Large-scale P2P VoD System,” in ACM SIGCOMM, 2008. [5] “PPLive,” http://www.pplive.com/. [6] “GridCast,” http://www.gridcast.cn/. [7] “PPStream,” http://www.ppstream.com/. [8] “TVU,” http://www.tvunetworks.com/. [9] “SopCast,” http://www.sopcast.com/. [10] M. Cha, P. Rodriguez, S. Moon, and J. Crowcroft, “On next-generation telco-managed P2P TV architectures,” in IPTPS, 2008. [11] D. Ciullo, V. Martina, M. Garetto, E. Leonardi, and G. L. Torrisi, “Stochastic Analysis of SelfSustainability in Peer-Assisted VoD Systems,” in INFOCOM, 2012. [12] W. Wu and J. Lui, “Exploring the Optimal Replication Strategy in P2P-VoD Systems: Characterization and Evaluation,” in INFOCOM, 2011. [13] D. Daley and D. Vere-Jones, An introduction to the theory of point processes, Springer-Verlag, Ed., 1998. [14] X. Yang and G. de Veciana, “Service Capacity of Peer to Peer Networks,” in INFOCOM, 2004. [15] D. Qiu and R. Srikant, “Modeling and Performance Analysis of BitTorrent-Like Peer-to-Peer Networks,” in ACM SIGCOMM, 2004. [16] N. Parvez, C. Williamson, A. Mahanti, and N. Carlsson, “Analysis of BitTorrent-like Protocols for On-Demand Stored Media Streaming,” in ACM SIGMETRICS, 2008. [17] R. Kumar, Y. Liu, , and K. Ross, “Stochastic Fluid Theory for P2P Streaming Systems,” in INFOCOM, 2007. [18] B. Fan, D. Andersen, M. Kaminsky, and K. Papagiannaki, “Balancing Throughput, Robustness, and In-Order Delivery in P2P VoD,” in ACM CoNEXT, 2010.
Inria
21
Peer-assisted VoD Systems: an Efficient Modeling Framework
Contents 1 Introduction
3
2 Model 2.1 System assumptions . . . . . . . . . . . . . . . . . . . . . . . . . . . . . . . . . . . . . 2.2 Peers dynamics . . . . . . . . . . . . . . . . . . . . . . . . . . . . . . . . . . . . . . . 2.3 Performance metrics . . . . . . . . . . . . . . . . . . . . . . . . . . . . . . . . . . . .
4 4 4 6
3 Analysis 3.1 Sequential delivery . . . . . . . . . . . . . . . . . . . . . . . . . . . . . . . . . . . . . 3.2 Gaussian approximation . . . . . . . . . . . . . . . . . . . . . . . . . . . . . . . . . . 3.3 Extension to non-sequential delivery . . . . . . . . . . . . . . . . . . . . . . . . . . . .
6 6 7 8
4 Performance under stationary conditions 4.1 Impact of the number of watching users and seeds 4.2 Impact of the target download rate . . . . . . . . 4.3 Impact of upload bandwidth heterogeneity . . . . 4.4 Impact of non-sequential delivery . . . . . . . .
. . . .
10 10 12 12 12
5 Performance of non-stationary systems 5.1 The effect of daily traffic variations . . . . . . . . . . . . . . . . . . . . . . . . . . . . . 5.2 The effect of newly introduced videos . . . . . . . . . . . . . . . . . . . . . . . . . . .
14 14 16
6 Related Work
19
7 Conclusion and lessons learned
19
RR n° 8184
. . . .
. . . .
. . . .
. . . .
. . . .
. . . .
. . . .
. . . .
. . . .
. . . .
. . . .
. . . .
. . . .
. . . .
. . . .
. . . .
. . . .
. . . .
. . . .
. . . .
RESEARCH CENTRE SOPHIA ANTIPOLIS – MÉDITERRANÉE
2004 route des Lucioles - BP 93 06902 Sophia Antipolis Cedex
Publisher Inria Domaine de Voluceau - Rocquencourt BP 105 - 78153 Le Chesnay Cedex inria.fr ISSN 0249-6399