manuscript No. (will be inserted by the editor)
PEPR: Pipelines for Evaluating Prokaryotic References Nathan D. Olson · Justin M. Zook · Daniel V. Samarov · Scott A. Jackson · Marc L. Salit
Received: date / Accepted: date
Abstract The rapid adoption of microbial whole genome sequencing in public health, clinical testing, and forensic laboratories requires the use of validated measurement processes. Reference materials that are well characterized, homogeneous, and stable can be used to evaluate measurement processes and help to establish confidence in the results. Given the variety of microbial genome sequencing applications and platforms, as well as the vast microbial genomic diversity, there is a need for application-specific genomic materials for method validation. We have developed a reproducibile and transparent bioinformatics tool for characterizing prokaryotic genomic materials; ”PEPR”, Pipelines for Evaluating Prokaryotic References. We demonstrate the tool and its output using using sequencing data while developing a Staphylococcus aureus candidate genomic reference material. Keywords Microbiology · Whole genome sequencing · Bioinformatics
1 Introduction Over the past decade, the availability of affordable and rapid Next-Generation Sequencing (NGS) technology has revolutionized the field of microbiology. Arguably the most discriminatory typing method available, whole genome sequencing (WGS), has been adopted not only by the research community, but also by public health laboratories, clinical testing laboratories, and the forensic community. High stakes decisions are often made based on the outcome of a WGS assay. To increase confidence in WGS assay results a critical assessment of the errors inherent to the measurement processes is required. A number of sources of error associated with the WGS measurement process have been identified, but the degree to which they can be predicted, controlled, or compensated varies significantly [14]. Well-characterized, homogeneous, and stable genomic materials can be used to evaluate methods and aid in establishing confidence in results from a measurement process. For example, we recently characterized a whole human genome reference material (National Institute of Standards and Technology, NIST, Reference Material 8398) to assess N.Olson · J. Zook · S. Jackson · M. Salit Biosystems and Biomaterials Division, Material Measurement Laboratory National Institute of Standards and Technology, Gaithersburg, MD, USA D. Samarov Statistical Engineering Division, Information Technology Laboratory National Institute of Standards and Technology, Gaithersburg, MD, USA M. Salit Department of Bioengineering, Stanford University, Stanford, CA, USA N. Olson Tel.: +1-301-975-4873 E-mail:
[email protected]
PeerJ PrePrints | https://dx.doi.org/10.7287/peerj.preprints.1435v1 | CC-BY 4.0 Open Access | rec: 15 Oct 2015, publ: 15 Oct 2015
2
Nathan D. Olson et al.
performance of variant calling in human genomic samples [25], but no reference materials for microbial sequencing currently exist. Four microbial genomic DNA candidate reference materials are being developed at the National Institute of Standards and Technology (NIST) to meet this need. When considering the extensive genomic diversity of prokaryotic organisms as well as the rapidly evolving and diverse DNA sequencing applications, we envision the need for a wide variety of application-specific genomic materials for use in method validation and benchmarking. Currently, many laboratories and sequencing centers are using in-house materials as part of a regular method validation and quality control system. However, the degree to which these materials are characterized varies significantly, and therefore a common pipeline for characterizing prokaryotic genomic materials is needed. PEPR, Pipelines for Evaluating Prokaryotic References, a set of reproducible and transperent bioinformatic pipelines, was developed to characterize genomic materials for use in WGS method validation. Using the pipeline increases confidence in method validation through the ability to develop better characterized control materials. PEPR characterizes prokaryotic genomic material for purity and homogeneity of the genome sequence, as well as presence of genomic material other than the material genus. The general approach to material characterization that guided the development of PEPR is the use of orthogonal sequencing methods along with technical replicates to obtain consensus values for the characterized properties. These consensus values are our best current estimates of the true values. We do not assert probabilistic estimates of confidence or confidence classification values with the sequence data, as we lack good models of biases or systematic errors of current sequencing technologies. Here we will first describe PEPR then show how PEPR was used to characterize NIST Staphloyoccous aureus genomic DNA candidate reference reference material.
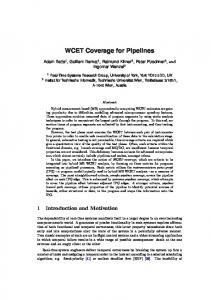
2 Methods 2.1 Pipelines for Evaluating Prokaryotic References: PEPR PEPR consists of three bioinformatic pipelines written in python (Fig. 2.1). The three bioinformatic pipelines are genome evaluation, genome characterization, and genomic purity. A YAML file (http://yaml.org) is used to define pipeline inputs. The pipeline coordinates the execution of a number of commandline tools, logging the standard output and standard error for each executed command in time-stamped files for reference and debugging. Pipeline code is available at (https: //github.com/usnistgov/pepr). To reduce the barrier for reuse, two Docker (https://www.docker.com/) containers are available with pre-installed pipeline dependencies. Docker is a lightweight virtual environment that facilitates the sharing and distribution of computing environments and can be run on any desktop, cloud, or high performance computing environment, regardless of the operating system. The pepr container (https://registry.hub.docker.com/ u/natedolson/pepr) includes dependencies for the genome evaluation and characterization pipelines, excluding the Genome Analysis Toolkit (due to licensing restrictions). The docker-pathoscope container has dependencies for the genomic purity pipeline installed(https://registry.hub.docker.com/u/natedolson/docker-pathoscope/). A software package, peprr, was developed for the statistical computing language R [17] to compile the output from the genome evaluation, characterization, and genomic purity pipelines . The compiled data was formated into a series of data tables within a SQLite, peprDB, database to facilitate downstream analysis [23]. The package includes functions to generate a number of summary tables and figures, including those in this publication.
2.2 Genome Evaluation Pipeline The Genome Evaluation Pipeline, is the first step in the PEPR workflow, and is used to reduce errors in the user provided genome assembly prior to characterization. The evaluation pipeline consists of three steps. Illumina sequencing data are retrieved from the Genbank Sequence Read Archive (SRA) using the sratoolkit fastq-dump command (http: //ncbi.github.io/sra-tools/). Next, sequencing reads are mapped to the reference genome using BWA mem algorithm [7]. Finally, Pilon is used to evaluate and polish the reference assembly [22]. The corrected reference genome is then used as input for the Genome Characterization Pipeline.
PeerJ PrePrints | https://dx.doi.org/10.7287/peerj.preprints.1435v1 | CC-BY 4.0 Open Access | rec: 15 Oct 2015, publ: 15 Oct 2015
PEPR: Pipelines for Evaluating Prokaryotic References
3
Fig. 1 PEPR workflow. White objects are pipeline inputs, grey objects are the three pipeline components, light blue objects are the pipeline products.
2.3 Genome Characterization Pipeline The Genome Characterization Pipeline uses replicate sequence dataset from multiple sequencing platforms to characterize the corrected reference genome produced by the Genome Evaluation Pipeline at the individual base level. Illumina data are aligned to the reference genome using the same methods as the evaluation pipeline. IonTorrent PGM data using the TMAP algorithm [3]. Additionally, if Pacific Biosciences (PacBio) sequencing data is used to generate the input reference assembly. The PacBio sequencing data is mapped to the reference genome using the BWA mem algorithm [7] and Next the sequence alignment files are processed prior to downstream analysis by marking duplicates with Picard’s MarkDuplicates command (http://broadinstitute.github.io/picard) and realigning reads mapping to regions with insertions or deleltion using the GenomeAnalysisToolKit [10, 2]. After refining the alignment files, base level analysis is performed using the short read sequencing data. For each platform a VCF (variant call format) file with a number of summary statistics is generated using SAMtools mpileup [8]. A base purity metric is calculated from the resulting VCF files. The base purity metric is the number of bases in reads aligned to a genome position that are in agreement with the reference base divided by the total number of reads supporting the alternate base called by SAMtools at that genome position. Homogeneity analysis, a measure of genomic content similarity between vials of the reference material, is performed by first generating a pileup file using SAMtools mpileup for each dataset then performing pairwise tumor-normal variant calling using VarScan [5]. In this work, VarScan looks specifically for differences between vials in the proportion of reads containing variants. A standard Benjamini-Hochberg procedure was used to assess
PeerJ PrePrints | https://dx.doi.org/10.7287/peerj.preprints.1435v1 | CC-BY 4.0 Open Access | rec: 15 Oct 2015, publ: 15 Oct 2015
4
Nathan D. Olson et al.
the power of the homogeneity analysis (Supplemental Material, https://github.com/DanSBS/NGSPower). Additionally, a number of summary statistics are calculated for the sequencing datasets using Picard’s Collect Multiple Metrics (http://broadinstitute.github.io/picard).
2.4 Genome Purity Pipeline THE Genomic Purity Pipeline assesses the purity of the genomic material, in terms of the presence of DNA from sources other than the expected genus was assessed using the metagenomic taxonomic read classification algorithm PathoScope 2.0 [4]. This method uses an expectation maximization algorithm where the sequence data are first mapped to a database comprised of all sequence data in the Genbank nt database (. Then, through an iterative process PathoScope re-assigns ambiguously mapped reads to a taxonomic group based on the proportion of reads mapped unambiguously to individual taxonomic groups in the database. Using short read sequencing data as input PathoScope 2.0 first filters and trims low quality reads (PathoQC), followed by mapping reads to a reference database (PathoMap - a wrapper for bowtie2 [6]), then the expectation-maximization algorithm (PathoID) is used for the taxonomic classification. The annotated Genbank nt database provided by the PathoScope developers was used as the reference database (ftp://pathoscope.bumc.bu. edu/data/nt_ti.fa.gz).
2.5 Candidate Reference Material S. aureus Sequencing Data Sequencing data and the reference assembly for the NIST candidate reference material S. aureus was used to demonstrate how PEPR is used to characterize a genomic material. A de novo genome assembly from Pacific Biosciences (PacBio) long read sequencing data was used as input for PEPR. Prior to being used as input the assembly was validated using optical mapping data. Eight replicate vials of the candidate reference material was sequened on the Illumina MiSeq and Ion Torrent PGM sequencing platforms (Supplemental Methods).
3 Results The output from the analysis of the S. aureus candidate reference material using PEPR is presented below. The results provide examples of the type of information, summary figures, and tables that can be generated with PEPR.
3.1 Sequencing Data Summary Statistics Summary statistics were calculated for the number of reads, mapped read length, insert size for paired-end datasets as well as coverage for S. aureus datasets (Table 1). The MiSeq sequencing run had an average of 1.7 million paired-end reads per library with a median read length of 232 bp, whereas the PGM sequencing run produced 0.2 million reads per library on average with a median read length of 232 bp. The higher throughput and paired-end reads resulted in a higher per-library coverage for MiSeq compared to PGM (251X vs. 36X). The three PacBio datasets are technical sequencing replicates (SMRT cells) from the same sequencing library, with a median subread length 10436bp and 302X total coverage. Between the three platforms a total coverage of 4611X was obtained.
3.2 Genome Evaluation The first step in PEPR is the Genome Evaluation Pipeline. Short read sequencing data is used to identify and correct errors in the user-provided reference genome, in this case the validated PacBio assembly. Running Pilon using the MiSeq data did not identify any assembly or base call errors.
PeerJ PrePrints | https://dx.doi.org/10.7287/peerj.preprints.1435v1 | CC-BY 4.0 Open Access | rec: 15 Oct 2015, publ: 15 Oct 2015
PEPR: Pipelines for Evaluating Prokaryotic References Acc. SRR1979039 SRR1979040 SRR1979041 SRR1979042 SRR1979043 SRR1979070 SRR1979044 SRR1979045 SRR1979046 SRR1979047 SRR1979048 SRR1979049 SRR1979050 SRR1979060 SRR1979064 SRR1979065 SRR2002412 SRR2002413 SRR2002414 SRR2002415 SRR2002416 SRR2002418 SRR2002419 SRR2002420 SRR2056302 SRR2056306 SRR2056310
Plat miseq miseq miseq miseq miseq miseq miseq miseq miseq miseq miseq miseq miseq miseq miseq miseq pgm pgm pgm pgm pgm pgm pgm pgm pacbio pacbio pacbio
5 Vial 0 0 1 1 2 2 3 3 4 4 5 5 6 6 7 7 0 1 2 3 4 5 6 7 9 9 9
Lib. 1 2 1 2 1 2 1 2 1 2 1 2 1 2 1 2 1 1 1 1 1 1 1 1 1 2 3
Reads 3305082 3732088 3973320 3941040 3442554 3226726 3025028 4796382 3338456 2995090 3495384 3116128 3129282 2976312 2630544 3416580 556903 530117 437527 552692 498479 390070 426196 439119 163475 163471 163474
Length (bp) 230 216 218 223 234 232 233 200 239 237 225 241 237 242 241 225 231 224 231 232 232 235 232 238 10510 10436 9863
Insert (bp) 257 233 242 247 268 268 264 210 278 277 255 281 271 280 283 248
Cov. 247 263 279 285 261 240 229 303 260 231 255 244 240 233 204 247 42 38 33 42 37 30 32 34 108 103 91
Table 1 Summary of sequencing datasets. Acc. - Sequence read archive (SRA) database accessions. Plat. - sequencing platform, miseq: Illumina MiSeq, pgm: Ion Torrent PGM, pacbio: Pacific Biosciences RSII. Lib. - library replicate number for miseq and pgm, smartcell replicate for pacbio. Reads - number of sequencing reads in the dataset. Length - median read length in base pairs. Insert - median insert size in base pairs for paired end reads. Cov. - median sequence coverage across the genome.
3.3 Base Level Purity A base purity metric was used to evaluate the degree to which the sequencing data supports the reference base call. We compared purity metric values between two orthogonal sequencing methods, MiSeq and PGM, for all positions in the genome (Fig. 2). Positions with purity metric values greater than 99 % were categorized as high purity and less than 99 % low purity. Out of 2909968 positions in the genome 2864925 positions had purity values greater than 99 % for both short read sequencing platforms (Table 2). Further, 2909853 and 2909965 positions had purity values greater than 99 % and 97 %, respectively, for one of the two platforms. Only 115 positions had a purity values less than 99 % for both platforms, and no positions had a purity value less than 95 % for both platforms. The positions with low purity for MiSeq were non-uniformly distributed whereas positions with low purity for PGM were uniformly distributed (Fig. 3).
MiSeq-High MiSeq-Low
PGM-High 2864925 394
PGM-Low 44534 115
Table 2 Number of genome positions with high and low purity, positions purity metric values higher and lower than 0.99 respectively, for the Illumina MiSeq and Ion Torrent PGM sequencing platforms.
PeerJ PrePrints | https://dx.doi.org/10.7287/peerj.preprints.1435v1 | CC-BY 4.0 Open Access | rec: 15 Oct 2015, publ: 15 Oct 2015
6
Nathan D. Olson et al.
1.0
0.9
PGM
0.8
0.7
0.6
Purity Group MiSeq−High PGM−Low MiSeq−Low PGM−High MiSeq−Low PGM−Low
0.5 0.5
0.6
0.7
0.8
0.9
1.0
MiSeq Fig. 2 Comparison of base purity values for PGM and MiSeq. Positions are colored based of high and low purity values for the two sequencing platforms, MiSeq - Illumina MiSeq and PGM - Ion Torrent PGM. A purity value of 0.99 was used to differentiate between high and low purity positions. Positions with high purity for both platforms were excluded from the figure.
3.3.1 Base Level Homogeneity The genomic material homogeneity was assessed through pairwise statistical analysis of the replicate MiSeq datasets using the VarScan somatic variant caller [5]. The pairwise variant analysis failed to identify any statistically significant base level differences among the replicates (Table 3).
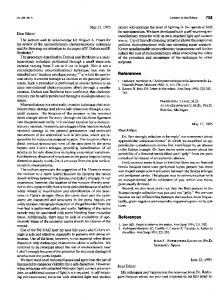
3.4 Genomic Purity Pipeline Short read sequencing data was used to identify the proportion of DNA in the material from an organism other than the material genus, in this case Staphylococcus, using PathoScope 2.0 [4] . Based on analysis of the MiSeq and PGM sequencing data, the reference material has minimal if any genomic contaminants (Fig. 4), with a maximum of 0.0039 % reads in any dataset classified as not belonging to the genus Staphylococcus. The most abundant contaminant was Escherichia coli (Fig. 5).
PeerJ PrePrints | https://dx.doi.org/10.7287/peerj.preprints.1435v1 | CC-BY 4.0 Open Access | rec: 15 Oct 2015, publ: 15 Oct 2015
PEPR: Pipelines for Evaluating Prokaryotic References
7
MiSeq−High PGM−Low 1500 1000 500 0 MiSeq−Low PGM−High
Count
150 100 50 0 MiSeq−Low PGM−Low
50 40 30 20 10 0 0e+00
1e+06
2e+06
3e+06
Genome Position Fig. 3 Distribution of genome positions by purity group. Bases with high and low purity and purity values greater than and less than 0.99 respectively for the two platforms, MiSeq - Illumina MiSeq and PGM - Ion Torrent PGM. Positions with high purity for both platforms were excluded from the figure.
4 Discussion 4.1 PEPR Pipelines for Evaluating Prokaryotic References (PEPR) is designed to use biological and technical replicate sequencing data from orthogonal sequencing platforms to characterize the genome of a microbial material. There are two primary reasons for using replicate sequencing datasets one is to test for homogeneity within the batch of DNA being characterized the second is to minimize the impact of library specific biases. The resulting characterized genome is suitable for use in
PeerJ PrePrints | https://dx.doi.org/10.7287/peerj.preprints.1435v1 | CC-BY 4.0 Open Access | rec: 15 Oct 2015, publ: 15 Oct 2015
8
Nathan D. Olson et al. Position 244332 2615986 2616058 2619808 2619886
Proportion of Pairs 0.01 0.03 0.08 0.01 0.01
Median Frequency 21.31 20.48 25.29 20.78 21.54
Minimum P-value 0.51 0.45 0.15 0.61 0.50
N Significant 0.00 0.00 0.00 0.00 0.00
Table 3 Pairwise variant analysis results. Position is the position in the genome where differences in variant frequency for a least one of the 16 pairwise comparisons were reported. Proportion of pairs is the fraction of the pairwise comparisons between the 16 Illumina MiSeq datasets where a difference in the variant frequency was reported by VarScan. Median frequency is the median variant frequency for the datasets were a difference in the variant frequency was reported. Minimum P-value is the lowest p-value reported by VarScan for all pairwise dataset comparisons where a difference in variant frequency was reported. N Significant is the number of datasets where a reported difference was statistically significant at the genome position.
Contaminants/Million Reads
40
30
20
10
0 miseq
pgm
Sequencing Platform Fig. 4 Proportion of reads from contaminant DNA. Reads categorized as genomic contaminants as classified by PathoScope as not belonging to the genus Staphylococcus.
evaluating and benchmarking whole genome sequencing methods. PEPR consists of three pipelines: genome evaluation, genome characterization, and genomic purity assessment. The PEPR Genome Evaluation Pipeline provides an automated method for evaluating and refining a reference genome sequence. User’s provide a high quality reference genome as input to the pipeline. Pilon was chosen for the genome evaluation step as it not only assesses the accuracy of the genome but also corrects errors in the assembly. Other methods are available for evaluating reference genomes, e.g. amosValidate [15] and ALE [1], however these methods only assess assembly accuracy and do not correct missassemblies. The resulting reference assembly represents a consensus genome for the population of cells used to generate the material being characterized. The genome evaluation pipeline does not attempt to identify or characterize low frequency structural variants within the material or vial-to-vial variability of the
PeerJ PrePrints | https://dx.doi.org/10.7287/peerj.preprints.1435v1 | CC-BY 4.0 Open Access | rec: 15 Oct 2015, publ: 15 Oct 2015
PEPR: Pipelines for Evaluating Prokaryotic References
9
Escherichia coli Enterococcus faecium Nanoluc luciferase Enterococcus sp. Stenotrophomonas maltophilia Gemella morbillorum Campylobacter coli synthetic construct
Organism
Pseudomonas mendocina Streptococcus pneumoniae Roseburia hominis Shuttle vector Bacillus cereus unidentified cloning NanoLuc reporter Streptococcus mitis Human papillomavirus Gallibacterium anatis
Platform
Streptococcus oralis
miseq
Homo sapiens
pgm
Methylobacterium populi Achromobacter xylosoxidans 0
50
100
150
Reads Fig. 5 Breakdown of contaminants by organism.
reference genome. The reference genome, once validated, and if nessessary refined by the Genome Evaluation Pipeline, is used as input for the Genome Characterization Pipeline. The Genome Characterization Pipeline calculates base level statistics using replicate sequencing data from orthogonal measurement methods. Additionally, the Genome Characterization Pipeline generates summary statistics for the sequencing datasets used in the material characterization procedure as well as long read data if it was used to generate the reference assembly, if applicable. The results from the Genome Evaluation and Characterization pipeline are loaded into peprDB, a SQLite database. Loading the data into a SQLite database makes it easier to perform additional analyses of the material characterization and evaluation results.
PeerJ PrePrints | https://dx.doi.org/10.7287/peerj.preprints.1435v1 | CC-BY 4.0 Open Access | rec: 15 Oct 2015, publ: 15 Oct 2015
10
Nathan D. Olson et al.
4.1.1 Process for using PEPR If another lab wishes to characterize a new reference or quality control material, they could follow this process: 1. Ideally, the user should generate a large batch of material and aliquot it to reduce inhomogeneity. 2. Identify a high-quality genome assembly. If a good reference assembly does not exist for the sample, then long-read sequencing like PacBio may be required to generate an assembly, and ideally mapping technologies would be used to validate the assembly. 3. Short-read whole genome sequencing, preferably from two orthogonal sequencing technologies, should be generated from multiple vials of the material, ideally 2 technical replicate libraries from at least six randomly selected vials. 4. PEPR can then be run to assess base-level purity and homogeneity, genomic contaminants, and mis-assemblies. The methods presented in this work provide a straightforward pipeline that can be used by any laboratory to characterize new reference materials or in-house quality controls.
4.2 PEPR Application: Characterization of Candidate RM 8376 using PEPR 4.2.1 Preparation of Reference Assembly PEPR requires a high quality reference assembly for input, in this work, a closed candidate reference genome was assembled from long read data generate using the Pacific Biosciences RSII platform. Optical mapping technologies and large insert mate-pair library preparation methods, including Illumina’s TruSeq Synthetic Long-Reads [9], represent orthogonal methods that can also be used to identify large misassemblies for validating reference assemblies for use in PEPR. To validate the S. aureus reference genome, whole genome mapping data generated with the OpGen optical mapping technology, was used to validate the genome assembly. The long DNA fragments (average size >200Mb) allow for the evaluation of large misassemblies (