2010 Fifth International Conference on Digital Telecommunications
Perceived Video Quality Estimation from Spatial and Temporal Information Contents and Network Performance Parameters in IPTV Pedro de la Cruz Ramos, Francisco González Vidal, Raquel Pérez Leal
[email protected] [email protected] [email protected] Departamento de Ingeniería Telemática Universidad Politécnica de Madrid Madrid, Spain
Abstract—The paper proposes a model for estimation of perceived video quality in IPTV, taking as input both video coding and network Quality of Service parameters. It includes some fitting parameters that depend mainly on the information contents of the video sequences. A method to derive them from the Spatial and Temporal Information contents of the sequences is proposed. The model may be used for near realtime monitoring of IPTV video quality. Keywords - Quality of Experience; Video Quality; Spatial Information; Temporal Information; Video Quality Metric. I.
INTRODUCTION
IPTV customers expect a Quality of Experience (QoE) comparable to traditional broadcast systems. So the ability to measure, estimate and monitor user perceived quality in near real time, and to relate it to network conditions, is critical for IPTV service providers. This paper focuses on the perceived video quality aspects of IPTV QoE. A new model for estimating the Video Quality Metric (VQM) [1] as defined in ITU-T J. 144 [2] is proposed. The model is based on an innovative combination of previous models [3] [4] [5], and takes as input easily measurable video coding and Network Quality of Service (NQoS) parameters. It includes some fitting parameters that depend mainly on the information contents of the video sequences. A new method for computing them from the standard Spatial Information (SI) and Temporal Information (TI) contents of the sequence, as defined in ITU-T P.910 [6], is proposed. All the values required for the estimation can be obtained without reference to the original video sequence. In the following sections previous work is reviewed, the estimation model is proposed, the method for computing the fitting parameters is described, results showing the feasibility of the approach are presented, the main conclusions are summarized, and some future work is outlined. II.
RELATED W O R K
In [3], the effect of Video Coding Rate (VCR) and Video Transport Stream (VTS) Packet Loss Ratio (PLR) on the Motion Picture Quality Metric (MPQM) [7] is investigated.
A fitting model is proposed, whose coefficients depend on video coding parameters and sequence complexity. In [4], the effect of several coding and network parameters on the Perceptual Distorsión Metric (PDM) [8] is studied. Instead of just providing a fitting model, a more comprehensive model, based on theoretical considerations, is derived, whose coefficients mainly depend on the complexity (information contents) of the sequence. In [5], the dependence of VQM [1] on VCR, codec type, display format (resolution) and 'motion contents', is thoroughly investigated. This model considers in detail the effects of codec type and coding parameters, but ignores the effect of the transmission network. An important aspect is the determination of the 'fitting' parameters. In [3] [4], the parameters are determined by fitting the model for each individual sequence. In [5], the sequences are classified in groups according to their 'motion contents' and values are assigned to the parameters for each class. However, nothing is said about the criteria used to classify the sequences. Thus, none of these models may be directly used for real-time monitoring of IPTV video quality. III.
VIDEO QUALITY ESTIMATION M O D E L
As objective measure of video quality we have selected VQM. It was evaluated by the Video Quality Experts Group (VQEG) [9], obtaining an excellent score (it was the only model statistically better than all other for all tests). It has been standardised by ITU-T in recommendation J. 144 [2], and the software for computing it is publicly available. Furthermore, there are publicly available results [5] for VQM as a function of coding parameters for a subset of the test sequences we have used. Our hypothesis is that, as both PDM and VQM are perceptual distortion metrics, their dependency on coding and NQoS parameters should be very similar. The results in [5] support this hypothesis. Our proposal is then to use a combination of the models described in [4] [5] in order to estimate VQM from the same parameters: VQM = Xslh{a-VCRIXRy
s
+XL-PLR-{\+VCRI{2-P-FR-SF-ABL))
(1)
where VQM VCR PLR P FR SF ABL a k
xR
Xs, XL, s s
is the Video Quality Metric is the Video Coding Rate is the Packet Loss Ratio in the Video Transport Stream (VTS) is the VTS packet size is the Frame Rate (number of frames per second) is the Slicing Factor (average number of slices per frame) is the Average Burst Length (average number of consecutive lost packets) is a fitting parameter that depends on the display format (resolution) is an enhancement factor depending on the codec (and coding parameters) is a Reference Coding Rate (RCR) are model parameters depending mainly on the complexity (information contents) of the
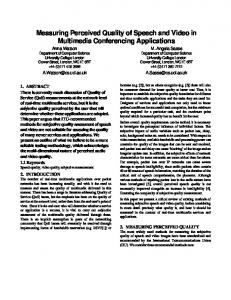
The key point is how to determine the values of the 'fitting' parameters (Xs, XL and ss) for each video sequence. Our proposal is to use the SI/TI measures [10] for this purpose. These measures are rather easy to compute, being based on simple operations such as the Sobel filter (a simple high-pass, edge enhancement digital filter widely used in image processing) and pixel-wise difference. They measure the spatial/temporal information detail as perceived by a human viewer, and are standardised in ITU-T Recommendation P.910 [6]. SI/TI are used as indexes into precomputed 'complexity tables', so that the model parameters for a given sequence are computed by interpolation between the values for the indexes nearest to the SI/TI values of the sequence. Figure 1 schematically depicts the process for populating the complexity tables from a set of reference (training) sequences: First, the SI/TI values of each sequence are computed. Then each sequence is encoded, transmitted over a simulated network, and decoded in order to obtain a distorted sequence. The reference and distorted sequences are processed in order to obtain their VQM. This process is repeated for different values of the coding and NQoS parameters. Then the VQM, coding and NQoS parameter values are fed to a fitting model in order to obtain the optimal values of the fitting parameters. The parameter values are stored in the complexity tables at the indexes corresponding to the SI/TI values of the original sequence. The whole process is repeated for as many reference sequences as possible in order to populate as many 'cells' of the complexity tables as possible. Once the complexity tables have been populated, they can be used to estimate the value of VQM for a distorted sequence, given the coding and NQoS parameters. The process is depicted in Figure 2. First NQoS, video coding and VTS parameters are obtained from the Network Management System (NMS), the decoder/Set-Top Box (STB), or measured at the network/STB interface. Then the SI/TI values of the received sequence are computed and used
Reference Sequence
II
Received Sequence Reference Encoder
\>
Network Simulator
>
Reference Decoder
>
• \
a
HI 1 1 1 '
_ ! Eh coding Parameter s
^f
>v ( QoS J V ^ Parameters
\.
>
Information Measurement
C
SI/TI
Distortion Measurement
)
"
/^
Fitting Model
N
/-
Fitting
y
V
am*
N __
"\
t
)
3
*
Tables
H Figure 1. Complexity table population process.
for interpolation in the complexity tables in order to obtain the fitting parameter values. Finally the coding, QoS and fitting parameter values are fed to the estimation model in order to obtain an (estimated) value for VQM. It must be noticed that no measurements on the reference sequence are required. IV.
CURRENT RESULTS
The following results are based on the VQEG FR-TV1 test sequences [11]. Table I lists the SI/TI values of the reference sequences. It also includes the 'motion contents' values in [5]. It can be seen that the test sequence set covers a wide SI/TI range. SRC 10 and SRC 15 are the same sequence, just coded in different formats. However, their SI/TI values are different. This seems to indicate that for the same scene, the lower the resolution, the higher the SI/TI values. The correspondence between 'motion contents' and TI would roughly be: low motion for TI