Journal of Psychosomatic Research 63 (2007) 573 – 577
Short communication
Perception of simulated driving performance after sleep restriction and caffeine Sarah N. Biggs a,b,⁎, Andrew Smith c , Jill Dorrian a,b , Kathryn Reid d , Drew Dawson b , Cameron van den Heuvel b , Stuart Baulk b a
School of Psychology, University of South Australia, Adelaide, Australia Centre for Sleep Research, University of South Australia, Adelaide, Australia c Department of Psychology, University of Adelaide, North Terrace, Adelaide, Australia d Center for Sleep and Circadian Biology and Transportation Center, Northwestern University, Evanston, IL, USA b
Received 9 February 2007; received in revised form 18 May 2007; accepted 20 June 2007
Abstract Objective: As feelings of alertness are reported to be highly correlated with performance perception, the objective of this study was to determine whether caffeine, a common countermeasure to driver sleepiness, affected a sleepy driver's ability to monitor his or her simulated driving performance. Methods: Twelve healthy young adults (six males, six females) participated in three counterbalanced, blinded, daytime conditions: control [9 h time in bed (TIB)], 100 mg caffeine (4 h TIB), and placebo (4 h TIB). Driving performance was measured through lane drift on a series of 30-min simulated driving sessions. Subjective sleepiness and perception of driving performance were measured at 5-min intervals during driving sessions via the Karolinska Sleepiness Scale and a corresponding perception scale. Results: Sleep
restriction had a significant detrimental effect on driving performance and subjective measures. Caffeine resulted in significant improvements across all measures. Subjective measures were found to be significantly correlated after sleep restriction and prior to caffeine. Correlations between actual and perceived performance were nonsignificant across all conditions. Conclusions: The strong correlation between subjective measures supports the postulation that sleepiness is used as a cue for performance prediction when sleep restricted. The relationship between perceived and actual performance after fatigue countermeasures remains inconclusive. Further research, addressing limitations, is needed. © 2007 Elsevier Inc. All rights reserved.
Keywords: Caffeine; Driver sleepiness; Perception; Simulated driving; Young drivers
Introduction While the impact of sleep restriction and fatigue countermeasures on simulated driving has received much attention, subjective monitoring of driving performance in these conditions has been largely ignored. This may be an important oversight as the ability to accurately self-monitor performance may determine whether an individual engages in risk-reducing behavior [1–3]. ⁎ Corresponding author. Discipline of Paediatrics, University of Adelaide, Women's and Children's Hospital, 72 King William Road, North Adelaide SA 5006, Australia. Tel.: +61 8 8161 6456; fax: +61 8 8161 7050. E-mail address:
[email protected] (S.N. Biggs). 0022-3999/07/$ – see front matter © 2007 Elsevier Inc. All rights reserved. doi:10.1016/j.jpsychores.2007.06.017
Self-ratings can reliably indicate performance, especially if individuals have access to internal feedback, such as feelings of sleepiness [1,4,5]. As subjective sleepiness (SS) increases, concomitant changes occur in electroencephalograph (EEG) activity [6], suggesting that individuals accurately judge neurophysiological sleepiness levels. Increases in SS are also associated with significant driving deficits [7–10]. This suggests that knowledge of sleepiness may provide information to drivers on their performance deficits. Up to 78% of drivers report drinking caffeinated beverages to alleviate sleepiness [11]. Caffeine suppresses the drive for sleep by stimulating neurons involved in arousal and inhibiting neurons involved in sleep [12–15].
574
S.N. Biggs et al. / Journal of Psychosomatic Research 63 (2007) 573–577
Caffeine consumption improves driving performance and reduces sleepiness in sleep-restricted individuals [16]; however, previous research indicates that there may also be a tendency to overestimate performance when sleepiness is masked by stimulants [4]. Thus, drivers may underestimate impairment after ingesting caffeine and continue driving when it is unsafe. This study aimed to determine whether individuals can accurately predict their driving performance (a) when sleep restricted and (b) after feelings of sleepiness have been alleviated by caffeine. It was hypothesized that predictions of driving performance would be significantly more accurate when sleep restricted than when sleepiness was alleviated with caffeine. Methods This study was approved by the University of South Australia Human Research Ethics Committee. In response to posted advertisements, 15 university students volunteered to participate, giving written consent. Prior to completion, two participants withdrew due to time constraints and one withdrew due to motion sickness caused by the driving simulator. Twelve participants (six males, six females), between 20 and 30 years of age (mean=23.8, S.D.=3.4), completed all experimental conditions. All were nonsmokers, were mild to moderate coffee drinkers (1–3 cups/day), were within normal BMI range, were regular drivers, were not currently shift workers, did not report any current health problems, and were screened for excessive sleepiness with the Epworth Sleepiness Scale [17]. A 1-h practice session was given on the driving simulator 1 week prior to the study (Fig. 1). Driving trials were counterbalanced to control for order effects. Thirty-minute sessions were chosen to eliminate confounding effects of boredom—known to produce feelings similar to sleepiness when not sleep restricted [18]—in the control condition. All sleep opportunities took place at home. Four hours of sleep restriction was chosen as it has been shown to significantly affect simulated driving [19]. Normal sleeping patterns and adherence to the sleep protocol were monitored through wrist actigraphy and telephone checks. Participants were asked to abstain from alcohol and caffeinated products from 2200 h the night before each trial. For each trial, participants arrived at the laboratory at 1300 h. A standardized set of test instructions was then given, instructing participants to attempt to maintain a stable
road position, follow posted speed limits, and respond verbally to a tone to indicate their level of sleepiness and perceived driving performance. Two subjective scales (see below), placed on either side of the computer screen, were rated consecutively at 5-min intervals during simulated driving. Responses were recorded manually by researchers via CCTV monitoring. Two 30-min simulated drives commenced at 1400 and 1500 h, respectively, coinciding with the daytime circadian nadir in alertness. Caffeine (100 mg) and placebo (lactose) capsules (identical in size, color, and taste) were administered— blind and counterbalanced—at the beginning of the appropriate break period (30 min). A 100-mg caffeine dose was chosen as (a) previous blinded laboratory studies have shown this to be the minimum amount for perception of physiological effects [12,20] and (b) this dose approximately equates to one cup of espresso coffee (85 mg), the quantity most likely to be consumed during on-road driving. Consumed in this way, caffeine reaches peak plasma concentrations after approximately 30 min [21] with a 4-h half-life [22], suggesting that effects should be maximal throughout the 30-min drive. In the control condition, no capsule was given. During the 30 min between drives, participants were allowed to read or watch TV but did not nap or leave the laboratory. Outcome measures Actigraphy Sleep/wake cycles were assessed using activity monitors (Actiware-Sleep, Mini Mitter Co., Inc., 2000). Average sleep time was 8 h 31 min (±1 h 21 min) for the 5 days prior to testing, 8 h 4 min (±1 h 9 min) for control, 3 h 47 min (±16 min) for caffeine, and 3 h 52 min (±42 min) for placebo conditions. Driving simulator performance Driving performance was measured using the York Driving Simulation (YDS) software (DriveSim 3.00, York Computer Technologies, Kingston, Ontario, Canada), sensitive to sleep deprivation and countermeasure conditions [23,24]. As the most sensitive to mild sleep restriction [19,25], lane drift was chosen as the performance outcome measure. YDS lane position is denoted as a percentage (0%— vehicle is off the road to the right, 100%—vehicle is off the road to the left). Australians drive on the left-hand side; thus, lane drift, defined as a deviation N85%, indicated a crossing
Fig. 1. Experimental protocol. Counterbalanced trials were separated by a minimum of 5 days. Each hour drive was broken by a 30-min period where caffeine, placebo (blinded), or enough rest was given.
S.N. Biggs et al. / Journal of Psychosomatic Research 63 (2007) 573–577
575
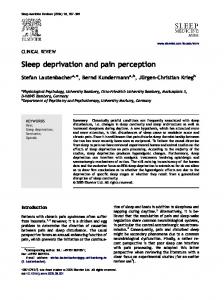
of the white markings on the left-hand side of the road. Left lane drift (LLD) incidents were logged in 1-s intervals. Driving data were collapsed into 5-min bins for correlational analysis and 30-min bins for analysis of variance (ANOVA) using custom software. Subjective scales SS was measured using the Karolinska Sleepiness Scale (KSS) [26]. This scale has been validated with EEGmeasured changes in objective sleepiness [27] and contains 9 points with the following anchors: 1=extremely alert and 9=very sleepy, great effort to keep awake, fighting sleep. The Perception of Driving Performance (PDP) Scale was developed by the authors. The PDP Scale requires participants to rate their ability to maintain a stable road position in the following 5 min using a 9-point scale with the following anchors: A=excellent and I=terrible. Letters were chosen so as not to be confused with the numerical scaling of the KSS. All ratings on the PDP Scale were transformed from letters to numbers (A=1 through I=9) for analysis. Results Driving performance, SS, and PDP A two-way repeated measures ANOVA revealed significant difference in LLD, KSS, and PDP Scale across conditions and after treatment (Table 1). Fig. 2 shows results for planned mean comparisons. Significant differences were found in all measures after sleep restriction as compared to control. There was also a significant treatment effect with caffeine resulting in a significant decrease in LLD, KSS, and PDP Scale. Significant differences were found in KSS and PDP Scale, but not LLD, after placebo. Correlation between subjective measures and actual performance Time-series correlations between KSS and PDP Scale were highest at time lag zero across all conditions. Mean r values are displayed in Table 2. Significant correlations between KSS and PDP Scale were found in the sleeprestricted conditions, before treatment. After treatment, only the placebo condition showed significant correlations between the subjective scales. Table 1 Repeated measures ANOVA results for left lane drift (LLD), SS (KSS), and PDP (PDP Scale) Condition
Treatment
Fig. 2. Repeated measures ANOVA shows a main effect of sleep restriction (black bars) and a main effect of treatment (white bars). Planned mean comparisons show the following: (A) LLD significantly increases after sleep restriction in both the caffeine and placebo conditions (^P b.05), as compared to control. LLD shows significant reductions after caffeine but not after placebo (*P b.05). (B) SS (KSS) significantly increases after sleep restriction in both the caffeine and placebo conditions (^^^P b.0001), as compared to control. Both caffeine (**P b.001) and placebo (*P b.05) produce significant decreases in SS during the second 30-min drive. (C) Participants perceived their driving as significantly worse after sleep restriction in both caffeine (^P b.05) and placebo (^^P b.001), as compared to control. Driving was perceived as significantly better after both caffeine and placebo (*P b.05).
Time-series correlations revealed no significant correlations between PDP Scale and LLD. Mean r values are displayed in Table 2. Discussion
Measure
F(2,22)
P
F(1,11)
P
LLD KSS PDP Scale
4.56 21.95 10.38
b .05 b .0001 .001
6.38 8.96 10.53
b .05 b .05 b .05
Sleep restriction significantly decreased simulated (LLD) and perceived (PDP) driving performance and increased SS. Caffeine had a beneficial effect on all measures. Surprisingly,
576
S.N. Biggs et al. / Journal of Psychosomatic Research 63 (2007) 573–577
Table 2 Time-series correlations between SS (KSS) and PDP (PDP Scale) and between left lane drifting incidents (LLD) and PDP SS and PDP
LLD and PDP
Pretreatment Condition Control Caffeine Placebo
r
Posttreatment P
a
.47 .76 a .85 a
NS b .05 b .01
r
Pretreatment P
a
.51 .56 a .83 a
r
NS NS b .01
Posttreatment P
a
.29 .56 a .46 a
NS NS NS
r
P a
.2 .11 a .13 b
NS NS NS
Time-series correlation coefficients were calculated for each participant at −3 to +3 time lag periods. Each time lag period represented 10 min. Skewed r value distributions were controlled using Fisher's r–z transformations. NS=nonsignificant. a b
Time lag zero. Time lag 1 (+10 min).
SS decreased after placebo, possibly due to placebo or break effects [1,16]. No significant differences were found in LLD or SS between caffeine and control, suggesting that caffeine returned driving performance and SS to baseline levels. Interestingly, participants perceived their driving as worse than normal after caffeine. As caffeine is normally taken in drinks, participants may not have had a relevant self-schema for caffeine in a capsule, discounting its enhancing properties. Prior indication of participants' attitudes toward caffeine in this form would benefit future studies. As expected, driving was perceived as significantly worse than control after placebo. Correlations between subjective measures were significant in the sleep restriction and placebo conditions. Indeed, PDP closely tracked levels of sleepiness when sleep restricted, consistent with the suggestion that SS mediates self-assessment of performance [1]. However, correlations between SS and PDP were not significant following caffeine. Correlations between subjective measures also failed to reach significance in the control condition. This implies that when sleepiness is not at the fore, perception of performance is assessed through alternate means [28]. Contrary to previous metacognitive studies [1,5], the nonsignificant correlations between LLD and PDP across all conditions, before and after treatment, suggest that participants were unable to accurately predict their driving performance, regardless of sleepiness. It is possible that sleepiness alone may not be sufficient for full acknowledgement of performance deficits [29]; however, study limitations must be acknowledged here. Firstly, despite validation [30,31], simulator studies lack realism, which may reduce prediction accuracy [18]. Additionally, data from 3 of the 12 participants were either corrupted or outlying and consequently transformed [32]. Larger subject numbers would strengthen further research. Also, the requirement to rate SS and PDP at the sound of a tone may have had an alerting effect. The addition of EEG recordings to validate SS and the PDP would enhance future studies. Nonetheless, results demonstrate that when sleepiness can be accurately assessed, it is a likely cue for predicting performance. As most driver sleepiness campaigns promote caffeine to increase alertness and as perception of perfor-
mance is often the catalyst for adopting risk-reducing behaviors, further research in this area is vitally important. Acknowledgments The authors wish to thank Dr. Nicole Lamond for all her expert assistance and advice throughout the study. We also wish to thank Michael Gratton for the development of the software program used to collapse driving data. References [1] Dorrian J, Lamond N, Dawson D. The ability to self-monitor performance when fatigued. J Sleep Res 2000;9:137–44. [2] Fairclough SH, Graham R. Impairment of driving performance caused by sleep deprivation or alcohol: a comparative study. Hum Factors 1999;41:118–28. [3] Harrison Y, Horne JA. The impact of sleep deprivation on decision making: a review. J Exp Psychol Appl 2000;6:236–49. [4] Baranski JV, Pigeau RA. Self-monitoring cognitive performance during sleep deprivation: effects of modafinil, D-amphetamine and placebo. J Sleep Res 1997;6:84–91. [5] Baranski JV, Pigeau RA, Angus RG. On the ability to self-monitor cognitive performance during sleep deprivation: a calibration study. J Sleep Res 1994;3:36–44. [6] Horne JA, Baulk SD. Awareness of sleepiness when driving. Psychophysiology 2004;41:161–5. [7] Akerstedt T, Peters B, Anund A, Kecklund G. Impaired alertness and performance driving home from the night shift: a driving simulator study. J Sleep Res 2005;14:17–20. [8] Horne JA, Reyner LA. Beneficial effects of an “energy drink” given to sleepy drivers. Amino Acids 2001;20:83–9. [9] Reyner LA, Horne JA. Falling asleep whilst driving: are drivers aware of prior sleepiness? Int J Legal Med 1998;111:120–3. [10] van der Hulst M, Meijman T, Rothengatter T. Maintaining task set under fatigue: a study of time-on-task effects in simulated driving. Transp Res Part F 2001;4:103–18. [11] Arnold PK, Hartley LR, Corry A, Hochstadt D, Penna F, Feyer AM. Hours of work, and perceptions of fatigue among truck drivers. Accid Anal Prev 1997;29:471–7. [12] Boutrel B, Koob GF. What keeps us awake: the neuropharmacology of stimulants and wakefulness-promoting medications. Sleep 2004;27: 1181–94. [13] Porkka-Heiskanen T, Strecker RE, Thakkar M, Bjorkum AA, Greene RW, McCarley RW. Adenosine: a mediator of the sleep-inducing effects of prolonged wakefulness. Science 1997;276:1265–8. [14] Reyner LA, Horne JA. Efficacy of a ‘functional energy drink’ in counteracting driver sleepiness. Physiol Behav 2002;75:331–5.
S.N. Biggs et al. / Journal of Psychosomatic Research 63 (2007) 573–577 [15] Van Dongen HP, Price NJ, Mullington JM, Szuba MP, Kapoor SC, Dinges DF. Caffeine eliminates psychomotor vigilance deficits from sleep inertia. Sleep 2001;24:813–9. [16] Horne JA, Reyner LA. Counteracting driver sleepiness: effects of napping, caffeine, and placebo. Psychophysiology 1996;33:306–9. [17] Johns MW. A new method for measuring daytime sleepiness: the Epworth Sleepiness Scale. Sleep 1991;14:540–5. [18] Lal SK, Craig A. A critical review of the psychophysiology of driver fatigue. Biol Psychol 2001;55:173–94. [19] Otmani S, Pebayle T, Roge J, Muzet A. Effect of driving duration and partial sleep deprivation on subsequent alertness and performance of car drivers. Physiol Behav 2005;84:715–24. [20] Griffiths RR, Evans SM, Heishman SJ, Preston KL, Sannerud CA, Wolf B, et al. Low-dose caffeine discrimination in humans. J Pharmacol Exp Ther 1990;252:970–8. [21] Mumford GK, Evans SM, Kaminski BJ, Preston KL, Sannerud CA, Silverman K, et al. Discriminative stimulus and subjective effects of theobromine and caffeine in humans. Psychopharmacology (Berl) 1994;115:1–8. [22] Kamimori GH, Karyekar CS, Otterstetter R, Cox DS, Balkin TJ, Belenky GL, et al. The rate of absorption and relative bioavailability of caffeine administered in chewing gum versus capsules to normal healthy volunteers. Int J Pharm 2002;234: 159–67. [23] Arnedt JT, Geddes MA, MacLean AW. Comparative sensitivity of a simulated driving task to self-report, physiological, and other
[24]
[25]
[26] [27]
[28] [29]
[30] [31]
[32]
577
performance measures during prolonged wakefulness. J Psychosom Res 2005;58:61–71. De Valck E, De Groot E, Cluydts R. Effects of slow-release caffeine and a nap on driving simulator performance after partial sleep deprivation. Percept Mot Skills 2003;96:67–78. Peters RD, Wagner EK, Alicandri E, Fox JE, Thomas ML, Thorne DR, et al. Effects of partial and total sleep deprivation of driving performance. Public Roads 1999;62:2–7. Akerstedt T, Gillberg M. Subjective and objective sleepiness in the active individual. Int J Neurosci 1990;52:29–37. Kaida K, Takahashi M, Akerstedt T, Nakata A, Otsuka Y, Haratani T, et al. Validation of the Karolinska Sleepiness Scale against performance and EEG variables. Clin Neurophysiol 2006;117:1574–81. Osber T, Shrauger JS. Self-prediction: exploring the parameters of accuracy. J Pers Soc Psychol 1986;51:1044–57. Moller HJ, Kayumov L, Bulmash EL, Nhan J, Shapiro CM. Simulator performance, microsleep episodes, and subjective sleepiness: normative data using convergent methodologies to assess driver drowsiness. J Psychosom Res 2006;61:335–42. George CF. Driving simulators in clinical practice. Sleep Med Rev 2003;7:311–20. Philip P, Sagaspe P, Taillard J, Valtat C, Moore N, Akerstedt T, et al. Fatigue, sleepiness, and performance in simulated versus real driving conditions. Sleep 2005;28:1511–6. Tabachnick BG, Fidell LS. Using multivariate statistics. 3rd ed. New York: Harper Collins, 1996.