-DV
sadasivans 23/1/12 12:09
TBIT_A_639806
2008 – Style 4 (USA4)
(XML)
RefSty-(V Harvard)
Behaviour & Information Technology Vol. 00, No. 0, Month 2012, 1–24
Perceptions of electronic navigation displays Talia Lavie* and Tal Oron-Gilad Department of Industrial Engineering and Management, Ben-Gurion University of the Negev, Beer Sheva, Israel (Received 2 November 2010; final version received 8 November 2011) This study evaluated aesthetics and usability of in-vehicle electronic navigation maps. Experiment 1 examined map displays that varied in the amount of information presented, abstraction level, graphic/colour style and the existence of landmarks in both urban and rural environments using objective and subjective measures. Twenty participants performed navigation/localisation tasks using various map configurations while driving a driving simulator and completed usability and aesthetic questionnaires. The minimal detail map produced better performances and higher usability and aesthetic ratings when using maps with no landmarks. Adding information in the form of landmarks was found advantageous compared to additional textual information. Abstractions were most advantageous when combined with minimal amount of detail. Moderate abstractions were sufficient for obtaining the desired benefits when more details were present. The graphic/colour style affected subjective perceptions. Overall, high correlations were found for the perceived aesthetics and usability scales, however, low correlations were found between actual usability (i.e. performance) and perceived usability pointing to the importance of using both objective and subjective usability measures. Experiment 2 examined how maps varying in their aesthetic level (aesthetic versus non-aesthetic), different colour arrangements, and 2D versus 3D landmarks affect subjective and objective measures. Participants distinguished between usability and aesthetic perceptions and usability perceptions were less affected by aesthetics when the aesthetic level of the maps was low. Colour arrangement did not affect the measures examined. Both 2D and 3D landmarks were found to be aesthetic and usable. We conclude this article with guidelines for designing in-vehicle navigation map displays. Keywords: aesthetics; usability; map displays; in-vehicle; navigation
1.
Introduction and motivation
Electronic navigation maps utilising global positioning systems (GPS) aim primarily to support drivers when travelling within unfamiliar areas. These systems display the required route along with the driver’s location marking subsequent to the driver reaching the desired destination. Since electronic maps need to support a number of cognitive tasks such as visual search, location assessment and complex integrative route planning (Yeh and Wickens 2001), it is imperative to select an appropriate display format. Electronic navigation maps may take a variety of forms (Montello et al. 2004) varying in their scale (ratio of a distance on the map to the actual distance on the ground), dimensions (e.g. 3D and 2D), perspective (e.g. bird’s eye view, north-up), the precision of the spatial information, the inclusion of detail, etc. Obviously, the form in which the electronic map is displayed will affect task performances and the driver’s perceptions of the navigation map. Moreover, according to Schreiber (2009), designers of navigation systems need to distinguish between the different map
*Corresponding author. Email:
[email protected] ISSN 0144-929X print/ISSN 1362-3001 online Ó 2012 Taylor & Francis http://dx.doi.org/10.1080/0144929X.2011.639806 http://www.tandfonline.com
functions and the goals that the user wants to achieve. That said, currently, navigation systems present the information in the same way regardless of its relationship to the context and situation (Lee et al. 2008). The aim of the current study was to examine different display formats to better support the driver’s usability and aesthetic requirements. In terms of usability, since electronic navigation maps are used while driving, when drivers should not take more than quick glances at them, it is essential that they do not impair driving safety. As for the aesthetics of the navigation map, previous research has shown that users rapidly form stable aesthetic impressions of interfaces (Lindgaard et al. 2006, Tractinsky et al. 2006) and that aesthetics affects the evaluation of user interfaces, and the perception of other system attributes, including its usability (e.g. Ben-Bassat et al. 2006). Moreover, previous research has looked at the connection between the visual aesthetics of computer interfaces and usability (i.e. Tractinsky 1997, Tractinsky et al. 2000, Lavie et al. 2011, Moshagen and Thielsch 2010). Research on the visual aesthetics of computer
2
T. Lavie and T. Oron-Gilad
interfaces found that aesthetics is highly correlated with the system’s perceived usability both before (Tractinsky 1997) and after (Tractinsky et al. 2000) the interaction, as well as with user satisfaction (Tractinsky et al. 2000). Thus, a more appealing navigation map may also be perceived to be more useful compared to a less appealing one and will generate higher driver satisfaction. Similarly, Moshagen and Thielsch (2010) found that visual aesthetics of websites does not impair performance if usability is being held constant. In addition, high aesthetics enhanced performance under conditions of poor usability. The authors concluded that visual aesthetics compensates for poor usability by speeding up task completion. However, in spite of their reduced completion times, they did not perceive usability as being higher under conditions of high visual aesthetics. In a study conducted on mobile phones, Sonderegger and Sauer (2010) found that participants using the highly appealing phone rated their appliance as being more usable than participants operating the unappealing phone. Furthermore, the visual appearance of the phone had a positive effect on performance, leading to reduced task completion times for the attractive phone. Hassenzahl and Monk (2010) reviewed 15 studies examining the relationship between perceived beauty and perceived usability and reported that although relatively positive correlations were found in all studies, the variance was high. The authors attributed their findings to methodological problems and attempted to re-examine the relationship. Hassenzahl and Monk (2010) concluded from their research that the relationship between beauty and goodness has been overplayed and that the connection is mediated by the quality of goodness (the overall evaluation of a product in a given context). Lavie and Tractinsky (2004) have found that users’ perceptions of web aesthetics consist of two main dimensions: ‘classical aesthetics’ and ‘expressive aesthetics’. While ‘classical aesthetics’ represents qualities embraced by classical notions of what constitutes aesthetic design, ‘expressive aesthetics’ captures perceptions of creativity and originality. A more recent website aesthetic scale was developed by Moshagen and Thielsch (2010), the visual aesthetics of website inventory (VisAWI). Their scale includes four dimensions; simplicity and diversity, colourfulness and craftsmanship. While previous research has examined various usability issues and design guidelines for navigation systems (e.g. Egenhofer 1993, Green et al. 1995, Ross et al. 1995, Campbell et al. 1998, Burnett 2000, Baldwin 2006, Wang et al. 2006), most of them have not examined empirically how the usability is affected
by variations in the display format. We examine actual usability by looking at the time it takes users to answer navigational questions using various maps (response times). We assert maps should be designed so that navigational tasks could be performed as quickly as possible so that the driver’s glances at the map will require minimal time. The perceived usability examined in this study is based on the user’s perceptions of whether the way the map is designed supports his or her navigational tasks. As for aesthetics, only few studies related to aesthetic aspects of maps (i.e. Schreiber 2009), and even these few studies have not examined aesthetics in an experimental settings. We used an aesthetics scale that was based on Lavie and Tractinsky’s (2004) aesthetics scale, which was adjusted to fit the perceptions of map aesthetics and that could examine how the users perceive more hedonic aspects of the map. Lavie et al. (2011) examined the aesthetics and usability of map displays that varied in the amount of information they presented (original, reduced and minimal detail), their abstraction level (original, abstract and schematic) and colour schema (bold, mild and greyscale), using objective and subjective usability measures. They found that maps with minimal detail produced best performances and highest evaluations. Abstractions (i.e. straightening of less relevant curviness the route and its surrounding graphical areas) were advantageous when combined with reduced amount of detail and specific colour schemes. Moderate abstractions were sufficient for obtaining the desired benefits. The colour schema mainly affected objective measures, pointing to the importance of good contrast between the cursor and the map colours. Their study also revealed high correlations between the perceived aesthetics and perceived usability scales. The current study aimed to validate the results found by Lavie et al. (2011) and to further examine additional design attributes in order to obtain better understanding of the elements affecting the aesthetics and usability of electronic navigation maps. Specifically, the current study varies from Lavie et al. (2011) in the following aspects: (1) instead of manipulating the colour palates and saturation level of the maps, which showed little to no effect on aesthetics or usability, the current study examines the use of graphic styles, a higher level of graphic sophistication; (2) the presence of landmarks and how landmarks affect aesthetic perceptions, usability perceptions, and actual usability is studied and (3) while previously only rural road maps were examined, we now examine both rural and urban road maps. The following sections address these aspects in detail.
Behaviour & Information Technology 2. Attributes affecting navigation map usability and aesthetics Five attributes were postulated to affect the usability and aesthetics of electronic navigation maps, including: (1) the amount of data displayed on the map, (2) abstraction level, (3) colour/graphic style, (4) landmarks and (5) the navigated environment. Previous research (including Lavie et al. 2011) has pointed to the importance of the first four attributes in relation to map design, yet the navigated environment that is displayed by the maps has not been adequately examined. These five attributes are not comprehensive, additional attributes may also impact the usability and aesthetics of navigation maps (e.g. the complexity of the information, see Schreiber 2009), yet they were all chosen due to their fundamental importance to map design. The following sections will shortly review each of the attributes and clarify how we examined each one of them in Experiments 1 and 2. 2.1.
Amount of data displayed on the map
Using maps for navigation requires extracting information concerning the navigation task. Cluttered maps, i.e. maps containing substantial amount of information (routes, landmarks, towns, etc.) make it difficult to parse out the relevant information and to extract what is needed from the clutter (Wickens et al. 2004). Clutter makes the maps difficult to read, especially while driving (Agrawala and Stolte 2001). Additionally, the visual search process usually advances in a serial manner, in which items in the search field are examined sequentially. The more cluttered the display, the more time, on average, will be required until an item is found (Treisman and Gelade 1980). Researchers therefore suggested limiting the amount of information presented to the driver while driving (Streeter et al. 1985, Labiale 1990, Parks and Ashby 1991, Wickens et al. 2004). This assertion was confirmed by Lavie et al. (2011) who found that maps with minimal detail produced best performances and highest evaluations. The effects of the amount of data were also seen in research conducted on websites. Tuch et al. (2009) for example, examined the effects of the visual complexity of websites on subjective ratings and psychophysiological responses. They found that visual complexity was related to increased experienced arousal, more negative valence appraisal, decreased heart rate and increased facial muscle tension. Visual complexity also resulted in increased reaction times and decreased recognition rates. The authors concluded that visual complexity of websites has multiple effects on human cognition and emotion, including experienced pleasure and arousal, facial expression,
3
autonomic nervous system activation, task performance and memory. Contrary to the studies demonstrating the advantages of including less information on maps, Schreiber (2009) argues that ‘little information irritates the user and evokes an uneasy feeling, even if the content is irrelevant for the current task’ (p. 282). However, her study did not examine the amount of information on the map, and rather looked at three different types of maps: an abstract map, a simple graphic map and an aerial photo map, in two differing situations: a road trip and a city trip. Experiment 1 examined maps with two levels of information: more and less information. Lavie et al. (2011) showed that there was no benefit to using an ‘original’ non-modified all-detail map, and that two levels of detail-reduction generate sufficient disparity. They also found that maps with less information produced higher usability and aesthetic evaluations. Section 3.3.1. describes how the information content was manipulated. We hypothesised that when driving along a predetermined route, the perceived aesthetics and perceived and actual usability will be higher in the minimal detail condition. 2.2.
Abstraction level
Abstraction refers to the amount of distortion in the map relative to the physical features of the topography. The motivation for abstraction relies in part on the fact that people tend to simplify representations of environments in their mental models. Many forms of abstractions exist, ranging from abstractions that omit information less relevant to a task to abstractions that preserve the information (or some of it), but simplify or distort it (Monmonier 1996, Lee et al. 2008). The latter typically uses a variety of cartographic generalisation techniques in order to improve the clarity of the map and to emphasise the most important information (Agrawala and Stolte 2001). For instance, a road can be presented as straight, even though it has curves along it if the curves do not add any information relevant to the navigation task. A number of electronic map mechanisms were developed based on abstraction methods, including the LineDrive system (Agrawala and Stolte 2001), and the MOVE system (Maps Optimised for Vehicular Environments) (Lee et al. 2008). Lee et al. (2008) found that abstracted and simplified route representations support the way people use maps. Lavie et al. (2011) found abstractions to be advantageous only when combined with reduced amount of detail and specific colour schemes. They also found that moderate abstractions (i.e. straightening of less relevant curviness the route and its surrounding graphical areas) were sufficient for
4
T. Lavie and T. Oron-Gilad
obtaining the desired benefits. On the other hand, Schreiber (2009) found the abstract map to be rated less appealing and less functional compared to aerial and simple maps. However, she did not use any known evaluation scales for the aesthetics or usability constructs. In addition, she examined maps with different characteristics, as opposed to the other studies (i.e. Agrawala and Stolte 2001, Lee et al. 2008, Lavie et al. 2011) that examined similar maps with variations in abstractions. Experiment 1 examined maps with two levels of abstraction (see Lavie et al. 2011): moderate and high, as will be described in Section 3.3.2. Based on Lavie et al.’s (2011) study, we hypothesised that when driving along a predetermined route, the perceived aesthetics, and perceived and actual usability will be affected by the interaction between the abstraction level and the detail level as they both affect the lucidity of the maps.
2.3. Colour and graphic style 2.3.1. Colour If used correctly, colour can be a powerful tool to improve the usefulness of an information display, but it can seriously reduce functionality if used inappropriately (Murch 1984). Although research into the psychology of colour is not a well-developed area, several studies have provided evidence of a relationship between colours and emotions (i.e. Wilson 1966, Valdez and Mehrabian 1994, Papachristos et al. 2005). Colour has been shown to affect people’s moods, emotions and perceptions (Papachristos et al. 2005). More specifically, according to Valdez and Mehrabian (1994), colour information such as hue, brightness and saturation has the potential to affect our perceptions, physiological reactions, emotional reactions or behavioural intentions (Valdez and Mehrabian 1994). Long-wavelength, for example (e.g. red and yellow) has been viewed as negatively arousing compared to short-wavelength colours (e.g. blue and green) (Wilson 1966). These physiological reactions have also seemed to be indicative of various psychological outcomes such as anxiety or pleasure (Valdez and Mehrabian 1994). Most of the few studies that dealt with aesthetic aspects of applying colour in information displays mainly examined websites, and focused on the role of aesthetics in website usability. They tended to treat colour in a subjective and qualitative manner (Brady and Phillips 2003, Kim et al. 2003, Papachristos et al. 2005). Coursaris et al. (2008) looked at the effects of colour temperature and gender on perceptions of website aesthetics and demonstrated favourable perceptions of aesthetics when cool colour combinations
(blue–light blue) were used, as opposed to warm colour combinations (red–orange). Cyr et al. (2010) examined how colour (grey, blue and yellow) affects trust, e-loyalty and satisfaction of websites by also looking at different cultures. Their research demonstrates that website colour appeal is a significant determinant for website trust and satisfaction with differences between the different cultures. In addition to the importance of colour in website design, the way colours are applied in electronic maps is also a central design consideration; it may direct users’ attention, emphasise areas on the map and obscure other map features, as well as, generate emotions affecting the way people respond to the maps. Appel et al. (1977) have confirmed what was noted by Francis Guthrie 125 years earlier, that four colours are sufficient to shade 2D maps so that no neighbouring regions share the same colour (in Francis et al. 2010). Thus, the benefits of colour coding in maps have been previously demonstrated (Yeh and Wickens 1997, Remington et al. 2000, Francis et al. 2010), yet only few empirical studies examined the relation between colour and aesthetics and usability of maps. Lavie et al. (2011) examined bold, mild and greyscale colour schemes, and did not find them to affect aesthetic and usability perceptions. Instead, the colour schema mainly affected the objective measures (performances) primarily due to variations in contrast between map elements. It is possible that merely applying different colour palettes is not sufficient for generating distinct aesthetic and usability perceptions and emphasis should be given to the overall graphic style of the map and to the way colours are applied in a more coherent way. We are not aware of empirical research examining how the overall graphic style of the map affects users’ interaction with it. 2.3.2.
Graphic style
Graphic style refers to many design aspects that are communicated through the layout, typography, fonts, colour palettes, textures, themes, motifs, various design effects and so forth. A style may for example, include modern motifs, as opposed to more realistic ones, or it can have a younger, fresh style, as opposed to an older, more sophisticated one. Although many guidelines were generated on how to design a good layout, what fonts to use, colour combinations and so forth, they were all used with relation to usability aspects and were not regarded in terms of their stylishness. Moreover, to the best of our knowledge, how style affects people’s perceptions of the interface has not yet been directly examined in the context of HCI, and its relation to aesthetics and usability has been neglected.
Behaviour & Information Technology In Experiment 1, we examined three colour/graphic styles: ‘contemporary blue’, ‘realistic green’ and ‘traditional elegant monochromatic’. Each graphic style is primarily comprised of four shades (Appel et al. 1977) and a unique emphasis of the route. The process of selecting the graphic styles is described in Section 3.3.3. We hypothesised that unlike the mere use of colour, the impact caused by the maps’ graphic styles will affect users’ perceptions of the aesthetics and usability of the maps. Based on a preliminary experiment conducted in order to generate the maps (demonstrating the supremacy of the ‘realistic green’ styled map, detailed in Section 3.3.3), and connections previously found between the aesthetic and usability perceptions (i.e. Tractinsky et al. 2000, 2006, Lavie et al. 2011), we hypothesised the ‘realistic green’ styled map will be perceived as most aesthetic and usable. However, the actual usability (performances) should not be affected by the different graphic styles, as contrary to Lavie et al. (2011), the differentiation and contrast between cursor and other markings was high in all three styles and thus should not produce any differences in performances. Experiment 2 examined two additional aspects of the graphic/ colour style: (1) aesthetic versus nonaesthetic maps (i.e. maps that were intentionally designed to be aesthetic or non-aesthetic); and (2) the arrangement of the colours on the maps using the same graphic style. Since in Experiment 1 all maps were designed so that the colours of the maps were arranged to support the navigation route (i.e. the area around the route was marked differently compared to more distant areas), we wanted to examine a map colouring arrangement in which the colour s were positioned arbitrarily. We hypothesised that users’ will have lower aesthetic and usability perceptions for the nonaesthetic map. It may seem obvious that the aesthetic perceptions of a non-aesthetic map will be low; however, the usability perceptions are theorised to be low because of the high connection found between usability and aesthetic perceptions (Tractinsky et al. 2000, 2006, Lavie et al. 2011). In addition, we hypothesised that the arrangement of the colours on the map will affect the actual usability and that when the colours will not be arranged to support the route, the actual usability (navigation performances) will be poorer. 2.4.
Landmarks
Landmarks have been defined as external reference points which are easily observable from a distance, distinct from their background (Lynch 1960), or as known places for which the individual has a well formed representation (Kaplan 1976). Landmarks
5
have been shown to support drivers in navigation tasks (Streeter et al. 1985, Green 1992, Kimura et al. 1997, Burnett 1998, 2000, Jackson 1998), and are valued as information items by drivers. They were rated as the second most popular information format requested by drivers from a passenger for aiding navigation following left–right directions (Streeter et al. 1985, Wochinger and Boehm-Davis 1997, Burnett 1998). Deakin (1996) compared between three street maps with different landmark treatments and examined the influence of landmarks on street maps in a simulated route-following task. The first map included added landmark information represented by geometric symbols, the second map included the same added landmarks represented by stereotype sketches from a horizontal view, and the third did not include added landmarks. She found that added landmark information decreased the number of wayfinding errors when navigating in an unfamiliar city, and that both methods of landmark symbolisation were equally effective. Although the advantages of landmarks have been previously established, to our knowledge their effects combined with other attributes such as the amount of detail were not previously examined in an experimental setting. Experiment 1 compared maps with and without landmarks along with two level of information presented by landmarks (more and less landmarks corresponding to the amount of detail on the map). Design considerations concerning landmarks are given in Section 3.3.4. We hypothesised that when driving along a predetermined route, the presence of landmarks will facilitate performances and increase usability evaluations for all maps (with more and less detail and for the two abstraction levels). In terms of aesthetics, since previous research has shown the strong connection between usability and aesthetic perceptions (Tractinsky et al. 2000, 2006, Lavie et al. 2011), we hypothesised that the presence of landmarks will also increase aesthetic evaluations. In addition, landmarks will have a greater impact when more information is presented on the map and when the map is less abstract. The basis for this hypothesises originates in Treisman’s theory of feature integration (Treisman and Gelade 1980). According to her theory, feature search can be performed fast and pre-attentively for targets defined by primitive features (such as colour, orientation and intensity), as opposed to serial slower searches that require more attention. Landmarks, which are displayed in maps as symbols should therefore be easier to perceive compared to textual information (such as street names). Hence, the additional cognitive load produced by maps with more detail on them and that are less abstract should be
6
T. Lavie and T. Oron-Gilad
reduced by using landmarks rather than additional textual information. Experiment 2 looked at different types of landmarks, more specifically 2D versus 3D landmarks. As far as we are aware of, previous research has not directly compared between 2D and 3D landmarks in navigation maps. The subject however was examined in the context of virtual environments. According to Vinson (1999), for example, landmarks consisting of familiar 3D objects make navigation easier in virtual environment whereas landmarks consisting of colourful abstract paintings do not. According to the author 3D, objects are easier to remember compared to abstract art. We hypothesised that the 3D landmarks will therefore facilitate performances. 2.5.
The navigated environment
Urban and rural maps usually differ in the density of the information presented on them, the types of landmarks they include the size of the roads and so forth. That said, we came across only one study that examined perceptions of both urban and rural navigation maps differing in their attributes. Schreiber (2009) in her study compared three different maps using both a road trip and a city trip and found different results for the maps. She observed that in situations of lowcognitive impact (i.e. road trip) people preferred to use complex maps and conceived them as being most aesthetic. Conversely, in situations of high-cognitive load (i.e. city trip) complex maps generated higher workload and the simple graphic maps were preferred. We believe that additional empirical exploration of whether urban and rural navigation maps should have similar constructs is called for. Navigation systems currently employ maps that are designed similarly for all driving environments and do not address potential differences between the maps. Our study attempted to investigate differences between urban and rural maps. Because of the inherent structural differences between the urban and rural environments we hypothesised that different aesthetics and usability perceptions will emerge, i.e. that findings will not necessarily be consistent among rural and urban maps. In sum, two experiments were conducted to evaluate the aesthetics and usability of electronic navigation maps differing according to the display attributes described above. We hypothesised that: (1) Amount of detail: The perceived aesthetics and perceived and actual usability will be higher in the minimal detail condition. (2) Abstraction level: The perceived aesthetics and perceived and
actual usability will be affected by the interaction between the abstraction level and the detail level as they both affect the lucidity of the maps. (3) Colour and graphic style: Users’ will have lower aesthetic and usability perceptions for the non-aesthetic map. The arrangement of the colours on the map will affect the actual usability and that when the colours will not be arranged to support the route, the actual usability (navigation performances) will be poorer. (4) Landmarks: The presence of landmarks will facilitate performances and increase aesthetic and usability evaluations for all maps (with more and less detail and for the two abstraction levels). Landmarks will have a greater impact when more information is presented on the map and when the map is less abstract. 3D landmarks will facilitate performances. (5) Navigation environment: Different aesthetics and usability perceptions will emerge in the rural and urban maps. We now describe each experiment separately. 3. Experiment 1 method Experiment 1 aimed to evaluate the perceived aesthetics, the perceived usability and the objective usability metrics of maps differing according to five attributes: (1) amount of data displayed on the map, (2) abstraction level, (3) colour/graphic style, (4) presence of landmarks and (5) type of navigation environments. In this experiment, we have employed a driving simulator in order to more realistically mimic the nature and demands of a real driving task. 3.1.
Participants
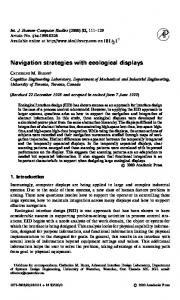
Twenty students (average age of 25) from the Department of Industrial Engineering and Management at Ben-Gurion University of the Negev, participated in the study for course credit. 3.2. Apparatus 3.2.1. Experimental system The experimental system (see Figure 1) consisted of two sub-systems: (1) Driving simulator. The driving simulator was the M400 of STISIM Drive (System Technology, Inc.), where three 1900 screens
Behaviour & Information Technology
7
Figure 1. An illustration of the experimental system including: the three screens of the driving simulator and steering wheel, the small screen presenting the maps in the navigation system, and the numeric keypad used for answering navigational questions and ratings.
create together a 1208 drivers’ view. A Game controller (Formula force EX of Logitech) was used for the steering wheel and for the set of pedals mimicking the gas and brakes. The simulator measures various driving parameters according to the definition of the scenarios. The urban road simulated a drive in a city, whereas the rural road simulated a drive in a hilly countryside road with slopes and turns. Road scenes included additional traffic. (2) Navigation system. This system displayed maps on an 8-inch (600 6 800 pixels) screen with a floating triangle indicating the participant’s location on the map. The display was located to the right of the participants’ centre field (between the centre and right screens of the driving simulator, as shown in Figure 1). 3.2.2. Questionnaire tool The system presented participants with two types of questions: (1) Questions concerning different locations on the maps that were presented on the navigation screen. These questions either referred to different locations relative to the location indicator, for example, ‘the location of the town ELIZABETH is straight ahead / to the right / to the left of your driving course’, or to the locations of landmarks relative to the indicator, for example, ‘the nearest gas station is straight ahead / to the right / to the left of your driving course’. The questions in the landmarks condition referred to landmarks and in the no landmark condition to street
names and roads. These questions made it possible for users to rate the map, while looking at it on the navigation screen. Participants answered using the numeric keypad (4 represented left, 6 right, and 2 straight ahead); (2) Questions inquiring about the maps perceived usability and aesthetics. Five usability items were used for evaluating the map’s usability by consulting the literature on usability evaluation and selecting the questions that are most relevant for maps. The items included: ‘the maps is easy to learn’, ‘the maps is easy to use’, ‘the information presented on the map is clear’, ‘it is easy to find information on the map’ and ‘the maps is easy to read’ (Nielsen 1994). The aesthetic scale included 10 items based on the map aesthetic scale generated by Lavie et al. (2011), a revised variation of the web aesthetic scale developed by Lavie and Tractinsky (2004) tailored to accommodate evaluations of maps. The items included: attractive, beautiful, colourful, modern, pleasant, aesthetic, simple, not loaded, clean and organised. The questions were presented in an individualised random order. For each item the participant was requested to rate the degree the statement fits the map on a 7-point scale, between 1 (‘does not fit at all’) and 7 (‘strongly fits’). Again, the numeric keypad was used to enter the ratings. 3.3.
Map generation
A total of 48 maps, 24 urban and 24 rural were generated. All maps were based on two original road maps (one urban and one rural) that were altered according to: (1) amount of data: more detail, minimal
8
T. Lavie and T. Oron-Gilad
detail (2) abstraction levels: more abstract, less abstract (3) colour style: traditional elegant style using monochromatic colours, stylised realistic green applying some 3D effects, and stylised contemporary style using complimentary blue colours and (4) landmarks: with and without landmarks (as described on Sections 3.3.1–3.3.5). Additionally, the locations of the street names and towns were altered among maps to avoid the influence of prior acquaintance with the area. To simulate progression in the drive and in order to allow each participant to experience each individual map more than once, for each map (of the 48) two replications were made with variations in the position of the floating triangle indicating the driver’s current location. Thus, the position triangle appeared at two different locations, once at the beginning of the drive and once in the middle of the route. The following sections describe the maps in more detail. 3.3.1. Amount of detail The amount of detail was manipulated as follows: In the rural maps by removing all – small towns from the map so that the map with less detail presented only big towns in the near vicinity of the route. In the urban maps, the maps with minimal detail presented only names of streets that were located on the driver’s route or intersecting with it, whereas in the more detailed maps, street names and significant locations were presented throughout the entire map. Figure 2 presents examples of the maps. It should be noted that even in the case of the more information presented on the map some information was removed compared to the original map. Since previously (Lavie et al. 2011) it was established that reducing the amount of detail from the map has an effect on perceived and actual usability and perceived aesthetics, a decision not to use maps containing massive amount of information (i.e. the original road maps) was made. Thus, information that was less important to the navigation task was removed (e.g. small towns, roads and towns far from the near vicinity of the driver’s route in the rural map, and distant streets and locations in the urban map). 3.3.2. Abstraction level We employed generalisation techniques similar to the ones used by Agrawala and Stolte (2001), Lee et al. (2008), and Lavie et al. (2011), in which the lengths of roads are slightly distorted, angles at turning points are altered, and the shapes of the individual roads are simplified and smoothed. In addition to the above techniques, we used similar simplifications for the
background geographical areas of the map. The abstractions were made in two levels: (1) in the moderate abstraction version lines were straightened between major points on the route and between cities in the circumference of the background geographical colour-coded areas (compared to the original map), (2) in the very abstract version, additional straitening was employed to the route and background colourcoded areas were shaped as polygons. Figure 3 presents an example of the two abstraction levels (see Lavie et al. 2011 for a detailed description of the abstraction techniques). 3.3.3.
Colour/graphic style
By using different graphic styles in addition to selecting different colour palates for the maps, separate graphic features emerge. For example, three dimensionality and shading can provide a specific impression. Thus, utilising graphic style provides a higher level of graphics than altering colour alone. All maps were designed by a professional graphic designer with the intention to be aesthetically pleasing and to avoid low contrast among text and background map elements. The final three map styles examined included: (1) a traditional style using monochromatic colours and employing elegant traditional styling; (2) a contemporary modern style using blue shades attempting to capture a more novel style and (3) a realistic style using green shades attempting to capture the real look of the terrain along with some 3D effects applied on the route. Those were selected based on a preliminary experiment (described below). 3.3.3.1. Preliminary experiment for selecting graphic styles. Seventeen students, 7 males and 10 females (with the average age of 25.5) from the Department of Industrial Engineering and Management at Ben-Gurion University of the Negev participated in this study and received course credit for their participation. Six map samples (see Figure 4) were presented to participants on a 15-inch screen (in a randomised order). While looking at each map, participants completed a questionnaire inquiring about the map’s perceived aesthetics (see Lavie et al. 2011 for information regarding the aesthetic scale). Additionally, they were requested to rate (on a 7-point scale) their general impression from the map and their general satisfaction from the colours of the maps. After viewing all six maps, participants completed three additional questions: (1) which map they liked the most, (2) which map had the preferred colours and (3) which map was most suitable for use in navigations systems.
Behaviour & Information Technology
9
Figure 2. Examples of maps with more (right maps) and less (left maps) information for the rural (upper row) and urban (bottom row) settings.
3.3.3.2. Results preliminary experiment. Aesthetic ratings for each map, as well as, preference frequencies are shown in Table 1. Ten participants (59%) preferred the stylised realistic style (map #3) over any other map, w2(3, 17) ¼ 19, p 5 0.01. The stylised realistic map (map #3) was perceived as the map with the best colours, w2(5, 17) ¼ 22.1, p 5 0.01 and as the most appropriate for use in navigation systems (see also Table 1). Based on the results, we have selected three maps: (1) the stylised realistic styled map, which received the
highest scores and preferences. Since there were no significant differences among the other styles the two additional maps were chosen as follows; (2) the stylised contemporary map, using complimentary blue colours. Although this map received relatively low ratings in all scales, according to Coursaris et al. (2008) blues colours (warm colours) are more favourable compared to cooler colours; and (3) the traditional elegant style, using monochromatic colours because we felt it important to include a monochromatic colour style in our experiment.
10
T. Lavie and T. Oron-Gilad
Figure 3. Zoom-into a sample detail of the rural map (with more (left) and less (right) details) showing examples of moderate (left) and more abstract (right) maps.
Figure 4. Map styles examined in the preliminary experiment, the graphic styles of Experiment 1 were chosen based on the results of this preliminary experiment.
3.3.4. Landmarks Maps were represented either without landmarks, with few significant landmarks (in the more information condition), or with significant landmarks only (in the minimal information condition). The landmarks were
designed to match the general graphic style of the map, and therefore their design corresponded with the different graphic styles used for the maps (see Figure 5). The landmarks represented gas stations, fast food restaurants, hotels, important buildings, parks and shops.
11
Behaviour & Information Technology
Table 1. Mean aesthetic ratings (column c) and number of the participants who rated each separate map as favoured with regard to preference, best colours and appropriateness (columns d to f). Map no. 1 2 3 4 5 6
Map description
Mean aesthetic rating/SD
Preferred map
Best colours
Most appropriate
Bold simple style, using a standard background Simple clean style, using an art palette Stylised realistic style, applying some 3D effects Stylised contemporary style, using complimentary blue colours Traditional elegant style, using monochromatic colours Traditional classic style, using realistic colours
3/1.2 3.5/1.1 4.4/1.2 3.4/1.1 3.9/1.4 3.5/1.4
1 2 10 1 2 1
1 2 10 1 2 1
1 2 10 1 2 1
Figure 5. Examples of landmarks for the modern green (right), traditional grey (centre) and contemporary blue (left) graphic styles.
3.3.5. Navigation environment We presented maps in both urban and rural environments. Urban maps presented information of street names, major places (such as stations or an important square) and major roads in the close proximity of the selected route on a scale of 1:200 m covering 2.8S km2. The rural environment presents information of town names and major places (such as a harbour or port) in the close and far proximity of the selected route. The map scale is 1:20 km and covers a much broader area of 180S km2. 3.4. Experimental design A mixed between-within-subject experimental design was employed with the between variable being the navigation environment (urban vs. rural). The within variables included: graphic style (traditional elegant style, stylised realistic green and stylised contemporary style), abstraction level (moderate abstraction, very abstract), the amount of detail (more and minimal) and the presence of landmarks (with and without landmarks). The dependent variables were: (1) aesthetic perceptions, (2) perceived usability, (3) time to complete the navigation task, i.e. response time and (4) driving performances. 3.5. Procedure Participants arrived at the driving simulator lab one at a time. After a short briefing and familiarisation with
the task and driving of the simulator the participant started the experimental session. Participants drove either the rural or the urban road while answering locational questions related to the navigation maps presented. The road driven in the driving simulator matched the navigation map, rural hilly road and urban road, respectively. Participants answered the locational questions using a numeric keypad (the keys 4, 6 and 8 indicated left, right and straight ahead, respectively). Each participant was presented with 48 variations of maps (three graphic styles, two detail levels, two abstraction levels, with and without landmarks, and two cursor locations on the route demonstrating progression. Thus, to create a more familiarity with a map configuration, each participant viewed two versions of it: (1) once when the cursor was located at the beginning of the route; (2) once when the cursor progressed along the route; 12 s were allocated for each locational task (question), after which the next task (question) appeared, even if no response was given. Each participant saw an individually randomised sequence of maps. After viewing two versions of each map (two with landmarks and two without landmarks), participants completed the aesthetics and usability questionnaires. During the time they completed the questionnaire, they were requested to stop driving by using the brakes on the driving simulator. Driving was resumed after completing the questionnaire. It took participants around 45 min to complete the entire experiment. 4.
Experiment 1: results and discussion
We first performed ANOVA tests to examine whether there were significant differences between the urban and rural maps for all the dependant measures (response times, aesthetic ratings and usability ratings). No significant differences were found for the conditions examined (amount of detail, abstraction, graphic style and landmarks). Thus, overall similar results were obtained for both environments. This result
12
T. Lavie and T. Oron-Gilad
contradicts our assumption. Nevertheless, more significant effects were found for the rural maps when it came to subjective evaluations, and a minor advantage was found for the urban map in terms of the time it took drivers to answer questions. Since rural and urban maps depict different characteristics it is logical that the results will not be identical. 4.1. Response time (time to answer a locational question) Response time was measured in milliseconds and calculated from the time the map and locational question appeared on the screen to the moment the user responded. Participants were given 12 s to respond; else response time was marked as 12 s (altogether, the rate of no-response was very low, 5.0% for the urban maps and 4.1% for the rural maps). A five-way ANOVA with repeated measures on the five variables (colour graphic style, abstraction level, detail level, landmarks and task repetition) was performed on response times for the urban and rural maps separately. As predicted, detail level affected response times for both types of maps [Urban map: F(1,9) ¼ 8.44, p 5 0.05, Z2 ¼ 0.73. Rural map: F(1,9) ¼ 23.48, p 5 0.01, Z2 ¼ 0.9]. Those were shorter for the map with the minimal detail (urban – mean response time of 5.2 s, SD ¼ 0.2 and 5.9 s, SD ¼ 0.3, respectively; rural – mean response time of 5.0 s and 6.1 s, respectively). Corresponding to previous research (Lavie et al. 2011) maps with minimal detail led to shorter performance times. Task repetition (i.e. the second time the same map was presented with cursor progression) affected response times in the rural map, F(1,9) ¼ 5.44, p 5 0.05, Z2 ¼ 0.5. Response times decreased in the second task
demonstrating learning of the map (mean response times of 5.8 s, SD-0.2 for the first repetition and 5.3. SD ¼ 0.3 s for the second repetition). This effect was not found in the urban map in which no learning effect was exhibited and the mean response time in both repetitions resembled response time with the rural map in the first task (5.7 s). The interaction Task repetition 6 landmarks was significant for the urban maps, F(1,9) ¼ 7.5, p 5 0.05, Z2 ¼ 0.5 (see left panel of Figure 6). Planned comparisons showed that for the first task repetition, response times for the maps with landmarks were shorter (in 0.6 s), F(1,9) ¼ 23.4, p 5 0.01. On the other hand, no differences were found for the second task repetition between the two landmark conditions. Since the questions in the landmarks condition referred to landmarks and in the no landmark condition to street names and roads, it appears that while it takes time to learn a map in order to perform tasks concerning street names and roads, no learning is necessary when it comes to questions referring to landmarks. In the later, response times were faster (in about 1.7 s) to begin with and remained that way. The interaction detail level 6 landmarks was significant in the rural maps, F(1,9) ¼ 135.4, p 5 0.01, Z2 ¼ 0.9 (see right panel on Figure 6). Detail level affected response times in the maps that did not include landmarks, and faster responses were found for the maps with minimal detail, F(1,9) ¼ 119, p 5 0.01, yet, no differences were found between the detail levels when landmarks were employed. The closer examination of the detail level shows it has an effect mainly on maps with no landmarks. The existence of landmarks also facilitated the learning of the maps as seen in the better performance times received for maps with landmarks, compared to textual
Figure 6. Mean response times for the two repetitive tasks with and without landmarks for the urban maps (on the left panel) and mean response times for the two detail levels with and without landmarks (right panel) for the rural maps.
Behaviour & Information Technology information, in which performances improved in the second repetition. The interaction abstraction level 6 detail level 6 landmarks was significant for the urban map, F(1,9) ¼ 7.79, p 5 0.05, Z2 ¼ 0.58 (see Figure 7). Different result patterns were found for the maps that included landmarks and those that did not. In the case of the maps without landmarks, a significant difference was found between the minimal detailed map and the more detailed map in the more abstract condition, F(1,9) ¼ 13.1, p 5 0.01, but no difference was found in the less abstract condition. On the other hand, no significant differences were found between the conditions in the maps including landmarks. The results here show that high levels of abstractions along with minimal detail level produce faster responses. However, they also reveal that the detail level and abstraction level do not affect response times when landmarks are concerned. No effects were found for colour/graphic style. This finding contradicts Lavie et al. (2011) who found maps with different colour schemas to produce different performance times. We attribute this result to the fact that the three graphic styles had similar contrasts between the cursor and the background (as opposed to the colour schema applied by Lavie et al. (2011). 4.2. Aesthetic and usability perceptions Mean aesthetic and usability ratings were calculated for the aesthetic and usability scales. A four-way
13
ANOVA with repeated measures on the four variables (graphic style, abstraction level, detail level and landmarks) was performed on the results of the aesthetic and usability ratings for both the urban and rural maps. Colour/graphic style affected the aesthetic ratings for both urban and rural maps, [Urban: F(2,18) ¼ 4.31, p 5 0.05, Z2 ¼ 0.67; rural: F(2,18) ¼ 6.35, p 5 0.01, Z2 ¼ 0.84], and affected the usability ratings only for the rural map [F(2,18) ¼ 3.25, p 5 0.05, Z2 ¼ 0.5]. The ‘realistic green’ map was rated as more aesthetic and with higher usability in all cases (aesthetics: urban and rural: realistic green – mean aesthetic ratings of 4.4, SD ¼ 0.3, and 4.6, SD ¼ 0.3; elegant blue – mean ratings of 3.8, SD ¼ 0.3, and 3.7, SD ¼ 0.4, traditional grey – mean ratings of 3.7, SD ¼ 0.4 and 3.5, SD ¼ 0.2, respectively; usability: rural map: realistic green – mean usability ratings of 4.7; SD ¼ 0.2, elegant blue – mean ratings of 3.7, SD ¼ 0.4, traditional grey – mean ratings of 3.8, SD ¼ 0.3). As hypothesised, the colour/graphic style affected the subjective perceptions. The green realistic styled map was perceived as more aesthetic and more usable. These results differ from Lavie et al. (2011) in which the maps with the different colour schemas produced similar subjective evaluations. Lavie et al. (2011) manipulated the colours applied on the maps disregarding the entire graphic style of the map. The detail level affected the aesthetic and usability ratings of both the urban and rural maps, [aesthetics: urban: F(1,9) ¼ 6.32, p 5 0.05, Z2 ¼ 0.61; rural:
Figure 7. Mean response time using different level of detail in each of the abstraction levels and each landmark condition for the urban map.
14
T. Lavie and T. Oron-Gilad
F(1,9) ¼ 17.5, p 5 0.05, Z2 ¼ 0.96; usability: rural: F(1,9) ¼ 15.29, p 5 0.01, Z2 ¼ 0.8; urban: F(1,9) ¼ 6.91, p 5 0.01, Z2 ¼ 0.6]. The map with minimal detail was rated as more aesthetic and with higher usability in both areas (aesthetics: urban and rural: minimal detail – mean aesthetic ratings of 4.1, SD ¼ 0.3, and 4.3, SD ¼ 0.2, reduced detail – mean aesthetic ratings of 3.8, SD ¼ 0.3 and 3.6, SD ¼ 0.4, respectively; usability: urban map: minimal detail – mean usability ratings of 4.5, SD ¼ 0.3, reduced detail – mean ratings of 3.9, SD ¼ 0.3; rural map: minimal detail – mean ratings of 4.5, SD ¼ 0.3, reduced detail – mean ratings of 3.7, SD ¼ 0.3). This corresponds to previous research (Lavie et al. 2011) that found maps with minimal detail to be perceived as more aesthetic, with higher usability. The interaction abstraction level 6 detail level was significant for the rural maps in terms of both aesthetic
and usability ratings, [(Aesthetics: F(1,9) ¼ 16.63, p 5 0.01, Z2 ¼ 0.95 (see upper left panel Figure 8; Usability: F(1, 9) ¼ 5.99, p 5 0.05, 0.52, see bottom left panel Figure 8)]. While a significant difference was found between the two detail levels in the more abstract conditions [Aesthetics: F(1,9) ¼ 19.53, p 5 0.01; Usability: F(1,9) ¼ 17.2, p 5 0.01], no differences were found between them in the less abstract condition. Similar to results obtained in performance times, the combination of higher abstraction level and less detail produced different results, compared to the combination of less abstract maps and more detail levels. More abstract maps were only found to be advantageous when combined with minimal amount of information. In this case both methods limit the information on the maps. However, when more information was present the less abstract map was more advantageous.
Figure 8. Mean aesthetic (upper panel) and usability (lower panel) ratings of rural maps varying in their detail level as a function of the abstraction level (left panel) and mean aesthetic ratings of rural maps varying in their detail level as a function of landmarks (right panel).
Behaviour & Information Technology The interaction detail level 6 landmarks was significant for both rating scales for the rural maps, [Aesthetics: F(1,9) ¼ 5.2, p 5 0.05, Z2 ¼ 0.53, see upper right panel Figure 8; usability: F(1,9) ¼ 8.86, p 5 0.05, Z2 ¼ 0.48, see bottom right panel Figure 8]. Significant differences were found between the two detail levels in both landmark conditions [Aesthetics: no landmarks: F(1,9) ¼ 16.02, p 5 0.01; with landmarks: F(1,9) ¼ 11.75, p 5 0.01; Usability: F(1,9) ¼ 15.1, p 5 0.01, F(1,9) ¼ 7.4, p 5 0.05, respectively]. Again, the detail level had an effect mainly on maps with no landmarks and questions on streets and roads produce different results compared to questions about landmarks. Thus, in terms of usability, adding landmarks is less intrusive and easier to perceive compared to adding textual information (such as street names, etc.). Finally the interaction abstraction level 6 detail level 6 landmarks was significant for the usability ratings, F(1,9) ¼ 8.15, p 5 0.05, Z2 ¼ 0.52, for the rural map (see Figure 9). The minimal detail map was rated highest in all abstraction conditions and especially high for the map with no landmarks on them (F(1,9) ¼ 6.1, p 5 0.05). Planned comparisons comparing between the two detail levels in all conditions revealed significant differences between them only for the more abstract conditions for both the maps with no landmarks, (F(1,9) ¼ 19.87, p 5 0.01), and, for the maps with landmarks (F(1,9) ¼ 7.95, p 5 0.05).
4.3.
15
Aesthetic-usability connection
Spearman Rho correlations were computed among all measures as summarised in Table 2. Corresponding with previous research (Tractinsky 1997, Tractinsky et al. 2000, Lavie et al. 2011) our study demonstrated high correlations between the aesthetic and usability perceptions in all map variations (particularly for the rural maps). On the other hand, we found negative low correlations between the perceived usability and actual usability (as measured by response time). It seems that actual performances did not impact map perceptions. It is especially interesting to see that participants’ perceived usability as indicated by the questionnaire, was different from the actual usability that was observed by their response times. When looking at the spread of the aesthetics and usability ratings (see Figure 10), for the rural map the ratings tend to vary. The urban ratings on the other hand, are more moderate for all cases. 4.4. Results of the driving simulator A four-way ANOVA with repeated measures on the four variables (graphic style, abstraction level, detail level and landmarks) was performed on the standard deviation of the lane position (i.e. deviations relative to the centre of the road) obtained from the driving simulator for both the urban and rural roads. Variability in lane position is expected to increase
Figure 9. Mean usability ratings using different detail levels in each of the abstraction levels and landmark conditions for the rural map.
16
T. Lavie and T. Oron-Gilad
when task demand is higher. No significant effects were found and it appears that the driving task was not affected by the amount of detail, abstraction level, graphic style and existence of landmarks in the navigation maps. Although lane deviations were shown in the past as sensitive to task demand in studies related to distracted driving (e.g. talking on the cellular phone while driving (see for example, Hancock et al. 2003)) we did not expect the different map attributes to affect driving performances in our study. We believe that more prominent differences between the maps or navigation tasks should be applied in order to find differences in driving performances between the conditions. Thus, in the current study all map conditions distracted the driver from the main driving task in a similar way. 5.
Experiment 2
5.1. Motivation Experiment 1 reinforced our previous findings (Lavie et al. 2011) with regard to Level of detail and Table 2. Summary of Spearman Rho 2-tailed correlations performed between all measures. Rural
RT*** Usability
Urban
Usability
Aesthetics
Usability
Aesthetics
70.13*
70.15* 0.82**
70.02
70.48 0.79**
Notes: *p 5 0.05; **p 5 0.01; ***Correlations with RT were conducted on log transformations.
Figure 10.
abstraction level. However, findings with regard to colour\graphic style and the use of landmarks were new. Specifically, manipulation of graphic style yielded differences not reported previously. As such, the motivation for Experiment 2 was to further examine: (1) the use of graphical style and (2) landmark designs that were not examined previously. In Experiment 1, style and colour affected subjective perceptions. The green realistic styled maps were perceived as more aesthetic and more usable. However, all maps were perceived to be relatively aesthetic. We therefore wanted to examine maps with graphic styles that may not be perceived as aesthetic and see how that affects usability perception and actual usability. Additionally, in the rural maps used in Experiment 1, the maps were colour coded to support the navigation task. Thus, the area surrounding the main route was colour coded using different colours to convey relatively close and more distant areas. We aimed to explore whether using the same graphic style in a way that does not support the navigation task/ route will yield similar results. Since no significant differences were found between the urban and rural maps in Experiment 1 and since the route was more prominent and emphasised in the rural maps, only the rural maps were used in Experiment 2. With regard to landmarks, in Experiment 1, we did not find main effects for landmarks for any of the measures (aesthetic perceptions, usability perceptions and response times). We did, however, find landmarks to be more advantageous when more information was present and when abstractions were not applied. It may be that the particular attributes of the landmarks may have had an effect on the results and
Aesthetic and usability distribution for rural (left panel) and urban (right panel) maps.
Behaviour & Information Technology thus additional types of landmarks should be explored.
5.2. Map and landmark generation 5.2.1. Maps In order to examine a non-aesthetic map, we created two additional maps in addition to the existing green realistic styled maps (see Figure 11). In a preliminary experiment, similar to the method employed in the preliminary experiment of Experiment 1 (Section 3.3.3) we examined the aesthetics of each map by asking 20 users to rate their aesthetics on the aesthetics scale
17
(as described by Lavie et al. 2011). The aim was to select the most aesthetic and most non-aesthetic maps to use in Experiment 2. A repeated measures ANOVA found Option 1 to be perceived as most non-aesthetic (on a 7-point scale), F(2,38) ¼ 13.43, p 5 0.01, with a mean rating of 3.2 for Option 1, 4.1 for Option 2, and 4.6 for Option 3). We therefore decided on using Option 1 as the nonaesthetic map (from now on referred to as the ‘nonaesthetic map’) and Option 3 (the Green realistic styles map) as the aesthetic map (from now on referred to as the ‘aesthetic map’). After selecting the non-aesthetic graphic style we designed the maps in an arbitrary colour arrangement (as presented in Figure 12).
Figure 11.
The additional maps created for Experiment 2 (two left maps: options a and b) and the original map (right map).
Figure 12. route.
An illustration of an ‘arbitrary’ colour arrangement, i.e. the colour coded areas do not correspond to the driver’s
18
T. Lavie and T. Oron-Gilad
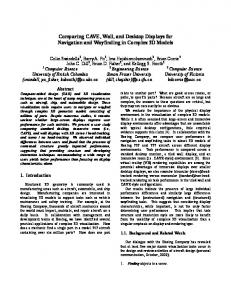
5.2.2. Landmarks In addition to the two dimensional flat landmarks used in Experiment 1 three dimensional more realistic landmarks were added. Figure 13 (right panel) presents sample landmarks. Following the preliminary experiment and landmarks design, we generated 12 maps differing according to: (1) their aesthetic level (aesthetic versus nonaesthetic maps), (2) colour arrangement (corresponding to the route or not) and (3) type of landmarks (3D, 2D and with no landmarks). All maps were based on the rural map. 5.3. Experiment 2 method 5.3.1. Participants Eleven additional students participated in the study (with an average age of 25). They received monetary compensation for their participation. 5.3.2. Apparatus Contrary to Experiment 1, the driving simulator was not used and instead a simpler tracking task similar to the one used previously in Lavie et al. (2011) was applied. The basis for this decision was that in both cases (when using the driving simulator or the simple tracking task) we did not find any effects for the driving or tracking task. The PC-based experimental system consisted of three sub-systems, a simple tracking system, a navigation system (similar to Experiment 1) and an online questionnaire. In the tracking system, participants were required to maintain a blue square as close as possible to a moving ‘X’ target. The tracking system appeared on a 21-inch screen at the centre of the participant’s visual field. The tracking task was controlled using arrows on a keypad. At predefined times, both the navigation and the tracking systems were halted and a questionnaire appeared on top of the tracking system screen. While examining the navigation map participants could complete the perceived aesthetics and usability questionnaires at their own pace. Once the
Figure 13.
Illustrations of the 2D and 3D landmarks.
questionnaire filing was completed a button press returned the system to its tracking mode. The subjective assessment included aesthetic and usability items identical to the ones used in Experiment 1. 5.3.3.
Procedure
Participants performed the tracking and navigation tasks simultaneously. In the navigation task, similar to Experiment 1, each map (out of the 12) was presented twice, with the cursor progressing on the road from time to time simulating progress in the drive. Eventually each participant performed 24 tasks (12 maps 6 2 repetitions), with 12 s allocated to each navigation task, after which the next task appeared, even if no response was given. Each participant saw an individually randomised sequence of maps. After performing the task repetitions for each map, the tracking task froze and the questionnaires were presented. Participants were then required to complete the aesthetics and usability questionnaires on the navigation map they have just experienced. Questionnaire items were presented in a random order. Participant were requested to rate the degree to which the statement fits the map on a 7-point scale (1 (‘does not fit at all’) and 7 (‘strongly fits’)). 5.3.4. Experimental design A 2 6 2 6 3 within-subject experimental design was employed. The independent variables included: map aesthetics (aesthetic, non-aesthetic), colour correspondence to route (corresponding, not corresponding) and landmarks (3D, 2D and no landmarks). The dependent variables were: (1) aesthetic perceptions, (2) perceived usability, (3) time to answer the navigation questions and (4) performance on the tracking task. 6. Experiment 2: results and discussion 6.1. Response times Response time was measured in milliseconds and calculated from the time the map with the navigation
Behaviour & Information Technology question appeared to the moment the user responded. The participants were given 12 s to answer each question and therefore if they have not responded, response time was marked as 12 s (altogether, the rate of no-response was very low, 2.3%). A significant main effect was found only for the ‘landmarks’ condition, (F(2,20) ¼ 37.2, p 5 0.01, Z2 ¼ 0.82. Response times were fastest when using maps with 3D landmarks, followed by maps with 2D landmarks, and were significantly slower for maps with no landmarks (mean response times of 5.5, SD ¼ 0.4, 5.8, SD ¼ 0.3, and 8.7, SD ¼ 0.3, respectively). Tukey post hoc tests revealed significant differences between both maps with 2D and 3D landmarks and maps with no landmarks (both p 5 0.01), however, no differences were found between the two landmark conditions. 6.2. Aesthetic and usability perceptions Mean aesthetic and usability ratings were calculated for the aesthetic scale. A three-way ANOVA with repeated measures on the three variables (map aesthetics, route correspondence and landmarks) was performed on the results of the aesthetic and usability ratings. In terms of the aesthetic ratings, a main effect for Map Aesthetics was found (F(1,10) ¼ 6, p 5 0.01, Z2 ¼ 0.7). The aesthetic map was perceived as more aesthetic compared to the non-aesthetic map (mean ratings ‘aesthetic’ map ¼ 4.6, SD ¼ 0.2, ‘non-aesthetic’ 3.6, SD ¼ 0.2). As expected, participants distinguished between the aesthetic and non-aesthetic maps. No significant main effect was found for usability ratings. The ‘non-aesthetic’ maps ratings were slightly (and insignificantly) lower with mean usability ratings of 4 (SD ¼ 0.6) for the ‘non-aesthetic’ map and 4.5 (SD ¼ 0.3) for the ‘aesthetic’ maps. Thus, the aesthetic perceptions of the maps did not affect the usability perceptions and the non-aesthetic maps were not perceived as less usable. A main effect was also found for the landmarks for both aesthetic and usability ratings, [aesthetics: F(2,20) ¼ 5.6, p 5 0.01, Z2 ¼ 0.67; usability: F(2,20) ¼ 8.9, p 5 0.1, Z2 ¼ 0.78], and maps with 3D landmarks were perceived as most aesthetic and with higher usability, followed by the 2D landmarks. The maps with no landmarks were perceived to be least aesthetic (aesthetic mean ratings of 4.6, SD ¼ 0.2, 4.2, SD ¼ 0.1 and 3.7, SD ¼ 0.1 respectively; usability: 4.6, SD ¼ 0.1, 4.4, SD ¼ 0.1 and 3.8, SD ¼ 0.1, respectively). However, Tukey post hoc analysis revealed a significant aesthetic difference only between the maps with 3D landmarks and maps with no landmarks (p 5 0.01) and significant usability differences between both
19
landmarks conditions (3D and 2D) and the no landmark condition (all p 5 0.01) but no difference was found between the 3D and 2D conditions. An interaction map aesthetics 6 landmarks was found for the usability ratings, F(2,20) ¼ 4.7, p 5 0.05, Z2 ¼ 0.7 (see Figure 14). Tukey post hoc tests showed that although no significant differnces were found between the usability ratings of the ‘aesthetic’ and ‘non-aesthetic’ maps for maps with 2D and 3D landmarks, the difference was significant for maps with no landmarks (all p 5 0.01). The benefits of landmarks were seen in Experiment 1, especially when more information was present. In Experiment 2, we wanted to further examine the effects of landmarks characteristics. Both 3D and 2D landmarks were more beneficial compared to maps with no landmarks, supporting the results of Experiment 1. Although 3D landmarks were perceived to be slightly more aesthetic and usable and facilitated faster responses, none of the differences were significant. No differences were found between maps with colours corresponding to the route and maps with noncorresponding arranged colours for both scales. It appears that the arrangement of the colours did not affect any of the measures. Finally, no significant differences were found for the tracking task. 6.3. Usability aesthetics connection As for the relation between usability and aesthetics, a Spearman rho conducted revealed moderate correlations between the perceived usability and perceived aesthetics ratings, r ¼ 0.54 (p 5 0.01). Low negative correlations were found between response time and perceived usability, r ¼ 70.24, and between response time and aesthetics, r ¼ 70.13.
Figure 14. Mean usability ratings of maps varying in the landmarks as a function of the aesthetics.
20 7.
T. Lavie and T. Oron-Gilad General discussion
As expected, the amount of detail displayed on the map affected all examined measures. Maps with minimal details were perceived as more aesthetic, with higher usability, and led to shorter performance times. This finding supports previous research demonstrating the benefits from limiting the amount of detail presented to the driver while driving (Streeter et al. 1985, Labiale 1990, Parks and Ashby 1991), and corresponds with Lavie et al.’s (2011) results. However, we have found that the amount of detail affects the objective (usability) and subjective (aesthetic and usability) measures differently when the maps contain landmarks as opposed to when they do not contain landmarks. It appears that the detail level had an effect mainly on maps with no landmarks. In our study, in the landmark condition, the detail level referred to the amount of landmarks present on the map. Consequently, the minimal-detailed maps included fewer landmarks as opposed to the maps with more detail on them. In terms of usability, while reducing the clutter on the display by removing information on street names and roads increased its usability, trimming down the number of landmarks did not increase usability. It appears that additional landmarks are less intrusive and easier to perceive compared to additional textual information (such as street names and roads, etc.) The existence of landmarks also facilitated the learning of the maps as seen in the better performance times received for maps with landmarks, compared to textual information, in which performances improved only in the second repetition. These findings correspond with Treisman’s feature integration theory (Treisman and Gelade 1980). In terms of aesthetic perceptions, minimalist, simple designs that include less textual information were perceived to be more aesthetic compared to maps with more textual information on them. Yet, fewer landmarks did not affect the perceived aesthetics of the maps. Thus, irrelevant information presented in the form of symbols (landmarks) on maps did not make the maps appear less aesthetic. However, it seems that the existence of landmarks is more important than their nature. Both 3D and 2D landmarks were more beneficial compared to maps with no landmarks and although 3D landmarks were perceived to be slightly more aesthetic and usable and facilitated faster responses, none of the differences were significant. Our results contradict Vinson’s (1999) findings that pointed to the advantage of 3D landmarks. However, Vinson (1999) has examined 3D landmarks in the context of virtual environments, which may differ from the context of navigational maps. It may be that in navigation maps the existence of the image is sufficient and not the actual way it is presented. That said, our
results support Tufte’s (1983) notion of ‘chart junk’. According to the theory of ‘chart junk’, visual elements that are not part of the minimum set of visuals necessary to communicate the information understandably should be avoided. In the case of our study, the 3D elements do not add additional information and therefore may not have additional value. The results regarding the abstraction level were less clear-cut. Variations in abstraction level did not affect performance and subjective evaluations (aesthetic and usability) alone. Instead, the abstractions had an effect only when combined with the level of information presented on the map, and only for maps that did not include landmarks. More abstract maps were only found to be advantageous when combined with minimal amount of information. In this case, both methods limit the information on the maps. However, when more information was present the less abstract map was more advantageous. Applying abstractions on maps are often used to improve the clarity of the map and to emphasise the most important information. It seems that this technique is of value only when maps do not include too much information. Thus, while previous research pointed to the benefits of utilising abstractions (Agrawala and Stolte 2001, Lee et al. 2008), our research demonstrates that this is true only under certain conditions. This may also explain the contradicting results found by Schreiber (2009) that did not find the abstract map to be advantageous. Since she did not report on any additional manipulations conducted on the maps, we can assume they included more information compared to both the maps used in our experiment (in which we reduced the amount of information). Finally, when the information appeared as landmarks the abstraction also did not have any impact, and landmarks minimised the advantages found for the abstraction. As for the graphic style and colour, the green realistic styled map was perceived as more aesthetic and more usable compared to the other two styles examined. These results are quite different from Lavie et al. (2011) in which the maps with the different colour schemas produced different performance times but similar subjective evaluations. As opposed to the current study, Lavie et al. (2011) manipulated the colours applied on the maps (mainly by applying different saturation levels and different hues) disregarding the graphic style of the map. We ascribe the difference in the results obtained for performance times to the fact that we applied a better contrast between the cursor and map colours for all maps in this study. Actually, the fact that no differences were found in terms of performance times among the map styles demonstrate that sufficient contrast was applied for all maps. The fact that the colour/graphic style had no
Behaviour & Information Technology effect on response time further suggests that variations in colour in addition to the graphic style, when applied with good contrasts may not affect performances. Thus, this may allow more choices and flexibility for the designer of the maps use more creativity in applying graphic style and palettes. In terms of the subjective evaluations, it appears that the entire style of the map is more influential on evaluations, compared to just altering map colours. That said, the colour variations of the maps we have used were not necessarily isoluminant (when two colour variations do not process the same luminance values). Colour and luminance are processed separately by the visual system, and then integrated so we can perceive images. When two colour variations are isoluminant they look the same to our luminance processing pathway, while potentially looking quite different to the colour processing path. This may have affected the usability and aesthetic perceptions since they may be processed differently in our visual perception system. Research usually focuses on guidelines for applying different colours to applications and displays, if for usability purposes or for aesthetic ones. Our research showed that the entire graphic style of the application should be considered as well. However, more research should be conducted in this respect to examine additional graphic styles and visual elements. As for the arrangement of the colours on the maps, Experiment 2 demonstrated that it did not affect any of the measures. While it is reasonable that the colour arrangement should not affect aesthetic perceptions since it is structured from the same graphical style utilising the same colours, one could expect it to affect usability. In our study, the localisation questions were always compared to the participants’ location on the main route. Therefore, when the colour arrangement supports the task it should have facilitated performing the task faster. It may be that because in all maps the same route was used, the participants did not need additional cues to find their location faster. This matter should be further examined in a study in which the participants’ use variation of routes. In such case different results may be obtained. Experiment 1 demonstrated high correlations between the aesthetic and usability perceptions for all map variations. This finding corresponds with previous research (Tractinsky 1997, Tractinsky et al. 2000, Lavie et al. 2011). One explanation to the high connection found between the perceived aesthetics and perceived usability may be the ‘halo’ effect aesthetics may have on usability perceptions (Hassenzahl 2004). The halo effect is a cognitive bias in which one perception of a trait (in this case aesthetics) affects another (i.e. usability). In addition, participants’ may have the tendency to have consistent answers in a with-
21
in subject design. Since participants experienced all conditions and were required to answer questions concerning usability and aesthetics they may have tended to maintain consistent answers. Finally, our aesthetics scale was developed based on Lavie and Tractinsky’s (2004) ‘classical aesthetic’ factor. Since some of the items from the ‘classical aesthetics’ factor reflect both classical aesthetics and perceived usability at the same time, it is reasonable that high correlations will be found between aesthetics and perceived usability. On the other hand, moderate to low correlations between the perceived usability and actual usability (response time) were found. In other words, the usability impressions seem not to be based on the participants’ real performances, but rather on the impressions created by the maps. However, while previous research has found that people tend to have negative or positive usability evaluations (Lavie et al. 2011) and aesthetic evaluations (Tractinsky et al. 2006; Lavie et al. 2011) of objects, our study has not found this effect. In Experiment 2, as expected, we found significant differences between the perceived aesthetics of the maps, and participants distinguished between aesthetic and non-aesthetic maps. However, no differences were found in their usability perceptions. Thus, in this case, aesthetic perceptions of the maps did not strongly affect usability perceptions and the non-aesthetic maps were not perceived as less usable. This result demonstrates that people distinguish between aesthetic and usability perceptions. However, since we did find lower usability ratings for the ‘non-aesthetic’ map we do not believe it will be accurate to conclude that the aesthetic perceptions here did not affect the usability perceptions at all. The relative high correlations (although slightly lower compared to Experiment 1) between the perceived usability and aesthetics strengthens this notion. However, the gap between the results needs to be explained. One explanation may be that aesthetic perceptions affect usability perceptions to a certain point and beyond that point, i.e. when the map is clearly not aesthetic, that connection weakens. The actual usability was not affected by the aesthetic level of the map, as expected. This subject should be further explored. In terms of navigation environments, contrary to our assumption, we did not find any significant differences between rural and urban maps. We ascribe this result to the fact that similar features were examined for both maps (i.e. the level of detail, abstraction, graphic style and landmarks). We believe that this aspect needs to be further enforced in additional studies. Although similar result patterns were found for both the rural map and urban map, considerably more significant effects were found for the
22
T. Lavie and T. Oron-Gilad
rural maps when it came to subjective evaluations. A minor advantage for the urban map was found in terms of the time it took drivers to answer questions. In terms of subjective evaluations, only the strong effects were seen in the urban maps. Since rural and urban maps depict different characteristics it is logical that the results will not be identical. As for the driving task, as expected, we found no significant effects. Previous research has pointed to the danger of looking away from the road while driving (Lee et al. 2007), and therefore designers of navigation systems should strive to limit the time users spend looking at the map. Decreasing the duration of the navigation task for example, can do just that. This can be accomplished by for example minimising the amount of data displayed on the map. 8.
Study limitations and future research
This study is also subject to a number of limitations. First, a relative small number of participants were used in both experiments. Although interesting result patterns were obtained in both experiments, the results should be further examined using a larger sample of participants. This notion is strengthened by the fact that some of the variables examined, such as the graphic style, were not looked at empirically before. It would be therefore very useful to examine additional aspects of graphic style and colour use. For example, the different graphic styles (in both experiments) also incorporated variations in colour and were not isoluminant. These variations can have additional influences on perceptions and may have also affected some of our results. We suggest this subject should be further examined to isolate additional colour-related characteristics that may have affected the results. An additional limitation refers to the differences between the ‘no landmarks’ condition and ‘with landmarks’ condition. In our study, the ‘no landmarks’ condition inquired about a road name (textual representation), while the ‘with landmarks’ condition inquired about a landmark (graphical representation). Obviously, different results may be obtained if both conditions were presented similarly, in a textual manner. However, since landmarks are rarely represented textually we did not look at this aspect in this current study. It should be noted that the aesthetics scale we have used in this study was based on the scale Lavie et al. (2011) adopted from Lavie and Tractinsky’s (2004) and adjusted to fit map displays. However, although we believe the aesthetic scale was sufficient for our purposes, scale development is an on-going process (Spector 1992), and therefore further validation should
be taken to establish this scale as a scale for examining the aesthetics of maps. Although our study examined four important attributes for map design, additional attributes that were not examined in our study may also have an impact on the usability and aesthetics of maps. Finally, our study focused only on map displays, however, most navigation systems also include turnby-turn directions (visual and auditory), and manoeuvre lists in addition to electronic maps. The additional display formats should also be studied. 9. Conclusions and recommendations Designing electronic navigation maps involves more than just addressing the usability challenges. Like many other products, the design should consider the complete user experience (see: ISO 9241-210 2010). In this work, we focus on both the aesthetic aspects related to the design of electronic navigation maps along with the perceived and actual usability. Our study continues Lavie et al.’s (2011) work that evaluated aesthetic and usability aspects of electronic navigation maps differing according to different display attributes. Our study reinforced Lavie et al.’s (2011) findings demonstrating the strong effect the amount of detail has on these measures and the connection between the abstraction level and amount of detail. In addition, our study has fortified the advantages of using landmarks (both 2D and 3D) instead of textual information and the importance of considering the entire graphic style of the map. Our study also provides additional confirmation for the relation between perceived usability and aesthetics, a connection that is very strong when it comes to map displays. However, it also shows that this connection is more fragile when the aesthetics level is low. It also opened some questions that additional studies should look at, including: the connection between usability and aesthetics when one of them is from the outset low while the other is not, the way the colour are distributed on the map as means for supporting the navigation task and the characteristics of the landmarks. Based on our results, we summarised a number of recommendations that could be used to guide designers of such systems. (1) In terms of textual information such as street names, towns, etc., the maps should present only the most relevant information, i.e. information that is near the route and important for navigation. Additional information should be eliminated. (2) Presenting information in a symbolic style is advantageous, and therefore, when possible, it
Behaviour & Information Technology
(3)
(4)
(5)
(6)
is better to present information in the form of landmarks instead of text. Presenting more information in a symbolic style does not impair the map’s usability or aesthetics. As long as the symbol is clear it is does not matter whether it is presented in 2D or 3D. High levels of abstractions are more useful when minimal information is present on the map. However, when maps contain more information, applying moderate levels of abstractions is sufficient. The general look of the map should be emphasised, including the entire graphic style selected, and it is not enough to focus on the selection of the colours that will be used on the map. Designing a map that meets all usability principles is not sufficient, and emphasise should also be placed on the maps’ aesthetics. It is not sufficient to solely examine the maps’ actual usability (i.e. performance reflected by accuracy of locating a target/place or by time to find a target) or its perceived usability, and the two measures should be examined jointly for a full understanding of a map’s usability.
References Agrawala, M. and Stolte, C., 2001. Rendering effective route maps: improving usability through generalization. In: Proceedings of the ACM SIGGRAPH, 12–17 August, Los Angeles, CA. New York: ACM Press, 241–250. Appel, K., Haken, W., and Koch, J., 1977. Every planar map is four colorable. Part II. Reducibility. Illinois Journal of Mathematics, 21 (3), 491–567. Baldwin, C., 2006. User-centered design of in-vehicle route guidance systems. In: D. De Waard, K.A. Brookhuis, and A. Toffetti, eds. Developments in human factors in transportation, design, and evaluation. Maastricht, the Netherlands: Shaker Publishing, 51–61. Ben-Bassat, T., Meyer, J., and Tractinsky, N., 2006. Economic and subjective measures of the perceived value of interface aesthetics and usability. ACM Transactions on Computer–Human Interaction, 13 (2), 210–234. Brady, L. and Phillips, C., 2003. Aesthetics and usability: a look at color and balance [online]. Usability News, 5.1. Available from: http://www.surl.org/usabilitynews/51/ aesthetics.asp [Accessed November 2011]. Burnett, G.E., 1998. Turn right at the King’s Head: drivers’ requirements for route guidance information. Unpublished PhD dissertation. Loughborough University, UK. Burnett, G.E., 2000. Usable vehicle navigation systems: are we there yet? In: Vehicle Electronic Systems 2000. Stratford upon Avon, UK: ERA Technology Ltd. Campbell, J.L., Carney, C., and Kantowitz, B.H., 1998. Human factors design guidelines for advanced traveler information systems (ATIS) and commercial vehicle operations. Washington, DC: Federal Highway Administration (FHWA-RD-96-146).
23
Coursaris, C., Swierenga, S., and Watrall, E., 2008. An empirical investigation of color temperature and gender effects on web aesthetics. Journal of Usability Studies, 3 (3), 103–117. Cyr, D., Head, M., and Larios, H., 2010. Colour appeal in website design within and across cultures: a multimethod evaluation. International Journal of Human– Computer Studies, 68, 1–21. Deakin, A.K., 1996. Landmarks as navigational aids on street maps. Cartography and Geographic Information Science, 23 (1), 21–36. Egenhofer, M.J., 1993. What’s special about spatial? Database requirements for vehicle navigation in geographic space. In: Proceedings of the ACM SIGMOD International Conference on Management of Data, 26–28 May, Washington, DC. New York: ACM Press, 398–402. Francis, G., Bias, K., and Shive, J., 2010. The psychological four-color mapping problem. Journal of Experimental Psychology, 16 (2), 109–123. Green, P., et al., 1995. Preliminary human factors design guidelines for driver information systems. Technical Report No. FHWA-RD-94-087. Springfield, VA: National Technical Information Service. Green, P.A., 1992. American human factors research on invehicle navigation systems. Technical Report No. UMTRI-92-47. Ann Arbor, MI: University of Michigan Transportation Research Institute. Hancock, P.A., Lesch, M., and Simmons, L., 2003. The distraction effects of phone use during a crucial driving maneuver. Accident Analysis Preview, 35 (4), 501– 514. Hassenzahl, M., 2004. The interplay of beauty, goodness, and usability in interactive products. Human–Computer Interaction, 19 (4), 319–349. Hassenzahl, M. and Monk, A., 2010. The inference of perceived usability from beauty. Human-Computer Interaction, 25 (3), 235–260. ISO 9241-210, 2010. Ergonomics of human-system interaction – Part 210: Human-centred design for interactive systems. Geneva: ISO. Jackson, P.G., 1998. In search of better route guidance instructions. Ergonomics, 41 (7), 1000–1013. Kaplan, S., 1976. Adaptation, structure and knowledge. In: G.T. Moore and R.G. Gollege, eds. Environmental knowing: theories, perspectives and methods. Stroudsburg, PA: Dowden, Hutchinson and Ross, 32–45. Kim, J., Lee, J., and Choi, D., 2003. Designing emotionally evocative homepages: an empirical study of the quantitative relations between design factors and emotional dimensions. International Journal of Human–Computer Studies, 59 (6), 899–940. Kimura, K., Marunaka, K., and Sugiura, S., 1997. Human factors considerations for automotive navigation systems-legibility, comprehension, and voice guidance. In: Y.I. Noy, ed. Ergonomics and safety of intelligent driver interfaces. Chapter 8. Mahwah, NJ: Lawrence Erlbaum Associates, 153–167. Labiale, G., 1990. In-car road information: comparisons of auditory and visual presentation. In: Proceedings of the Human Factors and Ergonomics Society 34th Annual Meeting. Santa Monica, Human Factors and Ergonomics Society, 623–627. Lavie, T., Oron-Gilad, T., and Meyer, J., 2011. Aesthetics and usability of in-vehicle navigation displays. International Journal of Human-Computer Studies, 69 (1–2), 80– 99.
24
T. Lavie and T. Oron-Gilad
Lavie, T. and Tractinsky, N., 2004. Assessing dimensions of perceived visual aesthetics of web sites. International Journal of Human–Computer Studies, 60 (3), 269–298. Lee, J., Forlizzi, J., and Hudson, H., 2008. Iterative design of MOVE: a situationally appropriate vehicle navigation system. International Journal of Human–Computer Studies, 66 (3), 198–215. Lee, Y.C., Lee, J.D., and Ng, B.L., 2007. Visual attention in driving: the effects of cognitive load and visual disruption. Human Factors, 49 (4), 721–733. Lindgaard, G., et al., 2006. Attention web designers: you have 50 ms to make a good first impression! Behavior and Information Technology, 25 (2), 115–126. Lynch, K., 1960. The image of the city. Stoke On Trent: MIT Press. Monmonier, M., 1996. How to lie with maps. Chicago, IL: The University of Chicago Press. Montello, D.R., et al., 2004. Spatial memory of real environments, virtual environments and maps. In: G. Alleen, ed. Human spatial memory, remembering where. Mahwah, NJ: Lawrence Erlbaum Associates, 251–285. Moshagen, M. and Thielsch, M.T., 2010. Facets of visual aesthetics. International Journal of Human–Computer Studies, 68 (10), 689–709. Murch, G.M., 1984. Psychological principles for effective use of color. IEEE Computer Graphics and Applications, 4 (11), 49–54. Nielsen, J., 1994. Heuristic evaluation. In: J. Nielsen and R.L. Mack, eds. Usability inspection methods. New York: John Wiley & Sons, 25–64. Papachristos, E., Tselios, N., and Avouris, N., 2005. Inferring relations between color and emotional dimensions of a Web site using Bayesian Networks. In: Proceedings of Interact 2005, September 2005. Vol. 3585. Rome: Lecture Notes in Computer Science, 1075– 1078. Parks, A.M. and Ashby, M.C., 1991. The effects of different in-vehicle route information displays on driver behavior. In: Proceedings of Vehicle Navigation and Information Systems Conference. Warrendale, PA: Society of Automotive Engineers, 61–70. Remington, R.W., et al., 2000. Visual search in complex displays: factors affecting conflict detection by air traffic controllers. Human Factors, 42 (3), 349–366. Ross, T., et al., 1995. Human factors design guidelines for information presentation by route guidance and navigation systems. CEC DRIVE II Project V2008 HARDIE, Deliverable 19, 79. Schreiber, J., 2009. Bridging the gap between useful and aesthetic maps in car navigation systems. In: Proceedings of the 11th International Conference on Mobile HCI, Bonn, Germany, NY: ACM Press. Spector, P., 1992. Summated rating scale construction, quantitative applications in the social sciences. Beverly Hills, CA: Sage Publications.
Streeter, L.A., Vitello, D., and Wonsiewicz, S.A., 1985. How to tell people where to go: comparing navigational aids. International Journal of Man-Machine Studies, 22 (5), 549–562. Sonderegger, A. and Sauer, J., 2010. The influence of design aesthetics in usability testing: Effects on user performance and perceived usability. Applied Ergonomics, 41 (3), 403–410. Tractinsky, N., 1997. Aesthetics and apparent usability: empirically assessing cultural and methodological issues. In: Conference Proceedings of CHI’97. New York: ACM Press, 115–122. Tractinsky, N., Shoval-Katz, A., and Ikar, D., 2000. What is beautiful is usable. Interacting with Computers, 13 (2), 127–145. Tractinsky, N., et al., 2006. Evaluating the consistency of immediate aesthetic perceptions of web pages. International Journal of Human–Computer Studies, 64 (11), 1071–1083. Treisman, A.M. and Gelade, G., 1980. A feature-integration theory of attention. Cognitive Psychology, 12 (1), 97– 136. Tuch, A.N., et al., 2009. Visual complexity of websites: effects on users’ experience, physiology, performance, and memory. International Journal of Human-Computer Studies, 67 (9), 703–715. Tufte, E., 1983. The visual display of quantitative information. 2nd ed. Cheshire, Connecticut: Graphics Press. Yeh, M. and Wickens, C.D., 1997. Effects of color coding, intensity coding, and decluttering on visual search in electronic map displays. University of Illinois Beckman Institute Technical Report. Urbana, IL: Beckman Institute. Valdez, P. and Mehrabian, A., 1994. Effects of color on emotions. Journal of Experimental Psychology, 123 (4), 394–409. Vinson, N., 1999. Design guidelines for landmarks to support navigation in virtual environments. In: Proceedings of CHI ‘99. Pittsburgh, Pennsylvania: ACM Press, 278–285. Wang, Y., et al., 2006. In-vehicle navigation system design based on HCI optimization. In: IEEE International Conference on Vehicular Electronics and Safety, 13–15 December, Shanghai, China. New York: IEEE, 299–304. Wickens, C.D., et al., 2004. The role of highlighting in visual search through maps. Spatial Vision, 17, 373–388. Wilson, G.D., 1966. Arousal properties of red versus green. Perceptual and Motor Skills, 23 (3, pt. 1), 947–949. Wochinger, K. and Boehm-Davis, D., 1997. Navigational Preference and driver acceptance of advanced traveler information systems. Ergonomicas and safety of intelligent driver interfaces. In: Y. Noy, ed. Ergonomics and safety of intelligent devices. Hillsdale NJ: Lawrence Erlbaum, 345–362.