The authors are indebted to the Australian Transport Safety Bureau, Commonwealth. Department of Transport and Regional Services, Australia, and the Roads & Traffic ...... review, a collaborative research program commenced for the Federal Office .... The perceptual countermeasures to speeding project has four stages, ...
ROAD SAFETY RESEARCH REPORT CR 182 1999
Perceptual Countermeasures: Experimental Research
Prepared by: Stuart Godley Brian Fildes Thomas Triggs Lorraine Brown Monash University Accident Research Centre
Department of Transport and Regional Services Australian Transport Safety Bureau Roads and Traffic Authority of New South Wales
Perceptual Countermeasures: Experimental Research
Stuart Godley, Brian Fildes, Thomas Triggs and Lorraine Brown Monash University Accident Research Centre
AUSTRALIAN TRANSPORT SAFETY BUREAU DOCUMENT RETRIEVAL INFORMATION Report No.
Date
Pages
ISBN
ISSN
CR 182
November 1999
84
0 642 25555 5
0810-770X
Title and Subtitle Perceptual Countermeasures: Experimental Research Authors Godley S.T., Fildes B.N., Triggs T.J. & Brown, L.J. Performing Organisation Monash University Accident Research Centre Wellington Road CLAYTON VICTORIA 3168 Sponsored by / Available from Australian Transport Safety Bureau PO Box 967 CIVIC SQUARE ACT 2608 Project Officer: John Goldsworth
Roads and Traffic Authority NSW PO Box K HAYMARKET NSW 1238 Project Officer: James Holgate
Abstract Perceptual Countermeasures to speeding (PCMs) are relatively low cost, non-obtrusive roadmarkings usually involving only paint, gravel, or both. They are designed to reduce travel speeds through influencing speed perception, mental workload, risk perception, and/or driver comfort. The aim of the present project was to systematically evaluate the effectiveness of a representative range of PCMs using the driving simulator at MUARC. Six experiments were conducted on the simulator, each involving 24 to 36 participants with full driving licences. Participants drove on a number of simulated roads containing various PCM treatments as well as others acting as control roads. Treatments evaluated on the approach to an intersection included transverse lines, peripheral transverse lines, a herringbone pattern, the Wundt illusion, and trees on the road edge. On roads involving continuous driving, PCMs evaluated included narrow “perceptual” lane widths, painted hatched medians, gravel medians, painted chequered edgelines, and low visual contrast gravel edgelines. Several curve enhancement treatments were also evaluated, including inside hatching, centreline hatching, and novel reflector post positioning. Several of the PCMs evaluated were concluded to be effective at reducing travel speeds, including: full lane width and peripheral transverse lines; a hatched median (especially with a narrow perceptual lane width), with or without intermittent gravel edgelines; and enhanced reflector post spacings.
Keywords PERCEPTUAL COUNTERMEASURES, SPEEDING, SIMULATION, TRANSVERSE LINES, MEDIANS, EDGELINES, LANE WIDTH, WUNDT, HERRINGBONE, REFLECTOR POSTS, CURVE ENHANCEMENT, ROAD SAFETY. NOTES: (1) (2)
This report is disseminated in the interests of information exchange. The views expressed are those of the author(s) and do not necessarily represent those of the Commonwealth, the RTA or Monash University.
Reproduction of this page is authorised
ii
ACKNOWLEDGMENTS The authors are indebted to the Australian Transport Safety Bureau, Commonwealth Department of Transport and Regional Services, Australia, and the Roads & Traffic Authority of NSW for their sponsorship, interest and assistance with this project. Project leader John Goldsworthy was extremely helpful in overseeing and facilitating this research for which we are particularly grateful. The study team are also grateful to the Transport Accident Commission, who generously provided us access to their driving simulators for this research which was mos appreciated. We would like to thank Chris Karadaglis for programming the simulator data bases for the first four simulator experiments. We would also like to thank Nebojša Tomaševi} for programming the simulator data bases for the final two simulator experiments, as well as for parsing the simulator output data for all experiments. We are also especially thankful to the participants who volunteered to take part in the simulator experiments.
iv
Contents EXECUTIVE SUMMARY ................................ ................................ ................................ ...... XI Simulator Approach................................ ................................ ................................ ....................... xi Transverse lines................................ ................................ ................................ ............................ xii Lane Edge & Herringbone Treatment ................................ ................................ ........................... xii The Drenthe Province Treatment ................................ ................................ ................................ .. xii Centreline and Edgeline Treatments................................ ................................ .............................. xii Curvature Treatments ................................ ................................ ................................ .................. xiii Conclusions................................ ................................ ................................ ................................ .xiii Recommendations ................................ ................................ ................................ ....................... xiii 1. INTRODUCTION ................................ ................................ ................................ ............... 1 1.1
Definition ................................ ................................ ................................ .......................... 1
1.2
Project Background................................ ................................ ................................ ............ 1
2. GENERAL METHOD ................................ ................................ ................................ ......... 3 2.1
Participants ................................ ................................ ................................ ........................ 3
2.2
Simulator ................................ ................................ ................................ ........................... 3
2.3
General Design ................................ ................................ ................................ .................. 3
2.4
Procedure................................ ................................ ................................ ........................... 4
2.5
Data Collection & Analyses ................................ ................................ ............................... 5 2.5.1 Data Collection................................ ................................ ................................ ........ 5 2.5.2 Data Analysis Approach ................................ ................................ .......................... 5
3.
PERCEPTUAL COUNTERMEASURES FOR DECELERATING MANOEUVRES ....... 7 3.1
3.2
4.
Experiment 1: Transverse Lines and other similar PCMs................................ .................... 7 3.1.1 Background ................................ ................................ ................................ ............. 7 3.1.2 Experimental Design ................................ ................................ ............................... 8 3.1.3 Results & Discussion................................ ................................ ............................... 9 3.1.4 Conclusions................................ ................................ ................................ ........... 13 Experiments 2 & 3: Illusory Lane Width Narrowing................................ ......................... 14 3.2.1 Experiment 2: Method ................................ ................................ ........................... 15 3.2.2 Experiment 2: Results................................ ................................ ............................ 16 3.2.3 Experiment 3: Method ................................ ................................ ........................... 17 3.2.4 Experiment 3: Results................................ ................................ ............................ 17 3.2.5 Experiments 2 & 3: Conclusions................................ ................................ ............ 18 PERCEPTUAL COUNTERMEASURES FOR ROADS WITH CONTINUOUS DRIVING................................ ................................ ................................ ..................... 21
4.1
Experiment 4: Drenthe Province Edgeline & Centreline Perceptual Countermeasure ........ 21 4.1.1 Background ................................ ................................ ................................ ........... 21 4.1.2 Method................................ ................................ ................................ .................. 22 4.1.3 Results ................................ ................................ ................................ .................. 23 4.1.4 Conclusions................................ ................................ ................................ ........... 25
v
4.2
4.3
4.4 5.
CURVE ENHANCEMENTS AS PERCEPTUAL COUNTERMEASURES ................... 35 5.1
6.
Experiment 7: Curve Enhancement ................................ ................................ .................. 35 5.1.1 Background ................................ ................................ ................................ ........... 35 5.1.2 Method................................ ................................ ................................ .................. 36 5.1.3 Results ................................ ................................ ................................ .................. 37 5.1.4 Conclusions................................ ................................ ................................ ........... 39 GENERAL DISCUSSION ................................ ................................ ........................... 41
6.1
6.4
Treatments for decelerating towards a hazard ................................ ................................ ... 41 6.1.1 Transverse Lines & Similar Treatments ................................ ................................ . 41 6.1.2 Lane & Road Edge Treatments ................................ ................................ .............. 42 Treatments for roads with Continuous Driving ................................ ................................ . 43 6.2.1 The Drenthe Treatment................................ ................................ .......................... 43 6.2.2 Centreline and Edgeline Treatments................................ ................................ ....... 44 6.2.3 Perceptual Lane Width Reduction ................................ ................................ .......... 44 6.2.4 Road environment ................................ ................................ ................................ . 45 CURVED ROAD TREATMENTS ................................ ................................ .................. 45 6.3.1 Enhanced Edgeline & Centreline Treatments ................................ ......................... 45 6.3.2 Post Spacing and height ................................ ................................ ......................... 47 PCM Conclusions ................................ ................................ ................................ ............ 48
6.5
Recommendations for Further Research ................................ ................................ ........... 49
6.2
6.3
7.
Experiment 5: Medians and Lane Width as Perceptual Countermeasures .......................... 26 4.2.1 Background ................................ ................................ ................................ ........... 26 4.2.2 Method................................ ................................ ................................ .................. 26 4.2.3 Results ................................ ................................ ................................ .................. 27 4.2.4 Conclusions................................ ................................ ................................ ........... 29 Experiment 6: Edgelines and the Surrounding Environment ................................ ............. 30 4.3.1 Background ................................ ................................ ................................ ........... 30 4.3.2 Method................................ ................................ ................................ .................. 31 4.3.3 Results ................................ ................................ ................................ .................. 31 4.3.4 Conclusions................................ ................................ ................................ ........... 33 Summary of Experimental Findings of PCMs for Continuous Driving.............................. 34
REFERENCES ................................ ................................ ................................ ........... 51
APPENDICES ................................ ................................ ................................ ..................... 53 APPENDIX
................................ ................................ ................................ ....................... 54
APPENDIX B................................ ................................ ................................ ....................... 56 APPENDIX C................................ ................................ ................................ ....................... 58 APPENDIX D................................ ................................ ................................ ....................... 60 APPENDIX E ................................ ................................ ................................ ....................... 62 APPENDIX F ................................ ................................ ................................ ....................... 64
vi
Tables Table 1.1:
Categories and examples of perceptual countermeasures, and experiments they were evaluated in................................ ................................ ................................ ..................... 2
Table 3.1:
PCMs evaluated in Experiment 1 ................................ ................................ .................... 8
Table 3.2:
Four treatments used in Experiments 2 & 3 ................................ ................................ ... 15
Table 4.1:
Treatments and controls used in Experime nt 4................................ ............................... 22
Table 4.2:
Treatments and controls used in Experiment 5 ................................ ............................... 27
Table 4.3:
Treatment and controls used in Experiment 6 ................................ ................................ 31
Table 5.1:
Curve Enhancement Treatments used in Experiment 7 ................................ .................. 37
Table 6.1:
Summary of results for transverse line treatments ................................ .......................... 41
Table 6.2:
Findings for the lane & road edge treatments................................ ................................ . 42
Table 6.3:
Summary of findings for variations of the Drenthe treatment ................................ ......... 43
Table 6.4:
Summary of findings for the novel centre and edgeline treatments ................................ . 44
Table 6.5:
Summary of centreline and edgeline treatments from the curvature experiment ............. 46
Table 6.6:
Summary of post treatments from the curvature experiment ................................ .......... 47
vii
Figures Figure 2.1:
TAC simulator at Monash University Accident Research Centre................................ ... 4
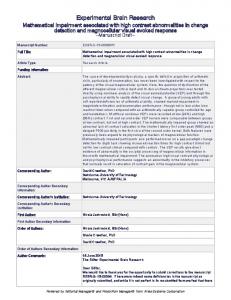
Figure 3.1:
Transverse lines (left top); peripheral herringbone pattern (right top); peripheral transverse lines (left bottom); and edge of the road trees (right bottom). ........................ 8
Figure 3.2:
Mean speed (±SE) for the control and three treatment roads (decreasing transvers lines, constant transverse lines, and peripheral transverse lines) both before and after speed adaptation. ................................ ................................ ................................ .......... 9
Figure 3.3:
Mean speed (±SE) for the peripheral transverse lines and the two transverse lines (decreasing and constant spacings) both before and after speed adaptation. ................... 9
Figure 3.4:
Mean speed (±SE) for the decreasing spacing transverse lines and the constant spacing transverse lines, both before and after speed adaptation. ................................ . 11
Figure 3.5:
Mean speed (±SE) for the three roads with road markings at decreasing distances apart, transverse lines, peripheral transverse lines, and the herringbone pattern. .......... 12
Figure 3.6:
Mean speed (±SE) for control road, edge of the roads trees, and the three roads with road markings with decreasing distances apart (transverse lines, peripheral transverse lines, and the herringbone pattern). ................................ ................................ ............. 13
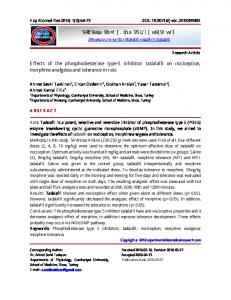
Figure 3.7:
Herringbone pattern with lines pointing backward (top), herringbone pattern with lines pointing forward (middle), and the Wundt illusion as appropriate for an intersection approach (bottom), as presented for the plan view ratings......................... 15
Figure 3.8:
Herringbone pattern with backward orientated lines (left) and the Wundt Illusion, as seen from a driver’s perspective................................. ................................ ................. 16
Figure 3.9:
Subjective lane width ratings (±SE) for the three treatments relative to the control. (Note: less than zero indicates narrower than the control, greater than zero indicates wider than the control, and zero indicates the same as the control). ............................. 16
Figure 3.10: Speed (±SE) for the control road and the three herringbone patterns combined............ 17 Figure 3.11: Speed (±SE) for the forward pointing herringbone pattern and the two backward pointing herringbone patterns (combined)................................. ................................ .. 17 Figure 3.12: Speed (±SE) for two backward pointing herringbone patterns, one with decreasing spacings and the other with constant spacings. ................................ ............................ 18 Figure 3.13: Mean speed (±SE) for the half Wundt’s treatment and control road............................. 18 Figure 4.1:
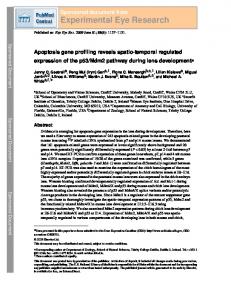
The Drenthe Province PCM (excluding the post mounted reflectors). .......................... 21
Figure 4.2:
Simulator image of the Drenthe Province PCM................................. .......................... 21
Figure 4.3:
Mean speed (±SE) for the Drenthe PCM, narrow control and wider control for both speed limit conditions combined. ................................ ................................ ................ 23
Figure 4.4:
Lateral placement (metres from the car centre to the inside edge of the centreline), (±SE) on the Drenthe treatment road, the four narrow lane roads, and the wider control road ................................ ................................ ................................ ................ 24
Figure 4.5:
Lateral deviations (±SE) on the three treatment roads and narrow control road, for the two speed limit conditions................................. ................................ .................... 24
Figure 4.6:
Steering deviations (±SE) for the three treatment roads, the same width control road, and the wider control road. ................................ ................................ ......................... 25
Figure 4.7:
Reaction time (±SE) to the secondary calculation task. ................................ ............... 25
Figure 4.8:
The narrow (2.5 metre) perceptual lane width roads with a median containing painted hatching (left) and white gravel (right)................................. ........................... 26
vii
Figure 4.9:
Mean speed (±SE) for the wide (3.6 m), medium (3.0 m), and narrow (2.5m) lan widths. ................................ ................................ ................................ ....................... 27
Figure 4.10: Lateral position deviations (left) and steering deviations (right) for the wide (3.6 m), medium (3.0 m), and narrow (2.5 m) lane perceptual widths. ................................ ...... 28 Figure 4.11: Subjective workload ratings of the NASA-TLX. for the three lane widths (3.6 m, 3.0 m, & 2.5 m) and control and median strip roads (Min = 0, Max = 100). ...................... 28 Figure 4.12: Mean speed (±SE) for the control roads (standard centerline) and the roads with medians (averaged across the medium and narrow lane widths). ................................ . 29 Figure 4.13: Mean speed (±SE) for the three median/centreline conditions. ................................ .... 29 Figure 4.14: The chequered edgeline treatment road in the rural environment (left) and the Drenthe PCM edgeline with the hatched median in the walled/industrial environment (right)................................. ................................ ................................ ........................ 30 Figure 4.15: Mean speed (±SE) for the control, chequered, and Drenthe edgeline treatment roads for the straights and curves. ................................ ................................ ........................ 31 Figure 4.16: Lateral deviations (left) and steering wheel deviations (right), (±SE) for the thre roads across the straights and curves................................. ................................ .......... 32 Figure 4.17: Mean lateral position (metres from the car centre to the inside edge of the edgeline), (±SE) for the control, chequered, and Drenthe edgeline treatment roads for th straights and curves. ................................ ................................ ................................ ... 32 Figure 4.18: Mean speed (±SE) for roads with the three edgeline types for the rural and industrial surroundings................................. ................................ ................................ .............. 33 Figure 5.1:
Treatments for Experiment 7, the inside hatching (left), and reflector p osts with diverging lateral positions on both sides (right). ................................ .......................... 35
Figure 5.2:
Treatments for Experiment 7, the inside hatching (left), and reflector posts with diverging lateral positions on both sides (right). ................................ .......................... 36
Figure 5.3:
Mean speed (±SE) for the inside curve (left) and outside curve (right) with 55 c hatching (and 3.4 metre lane width). ................................ ................................ ........... 37
Figure 5.4:
Mean speed (±SE) for the inside curve (left) and outside curve ( right) with 35 c hatching (and 3.5 metre lane width). ................................ ................................ ........... 38
Figure 5.5:
Speed (±SE) on the left (inside) curve with reflector posts. ................................ ......... 38
Figure 5.6:
Speed (±SE) on the right (outside) curve with reflector posts ................................ ...... 39
Figure A1:
Road treatments used in Experiment 1. ................................ ................................ ....... 55
Figure B1:
Road treatments used in Experiments 2 & 3. ................................ ............................... 57
Figure C1:
The five lane delineation markings used in Experiment 4. ................................ ........... 59
Figure D1:
The seven lane delineation patterns used for Experiment 5. ................................ ......... 61
Figure E1:
The three lane delineation treatments used in Experiment 6. ................................ ....... 63
Figure F1:
Treatments and controls used in the first curve of Experiment 7. ................................ . 65
Figure F2:
Treatments and controls used in the second curve of Experiment 7. ............................ 67
Figure F3:
Treatments and controls used in the third curve of Experiment 7. ................................ 69
ix
x
EXECUTIVE SUMMARY Speeding has long been recognised as a major factor in road crashes in Australia tha deserves priority attention. While police enforcement quite rightly has been the major weapon against excessive speeding, there have been a number of calls for supplementary measures to reduce speed related road trauma. A review of the research and action needs in speed management was undertaken in 1994 that highlighted low cost perceptual countermeasures (PCMs) as a priority research issue. Following the review, a collaborative research program commenced for the Federal Office of Road Safety and the Roads and Traffic Authority of New South Wales. The Monash University Accident Research Centre (MUARC) in conjunction with ARRB Transpor Research has undertaken the research. Earlier published reports have included a literature review (CR 4/94), and a validation study of the driving simulator at MUARC (CR 169). This report describes the results of a series of simulator studies that systematically tested a number of PCMs using licensed drivers in the MUARC driving simulator. SIMULATOR APPROACH On-road testing of new treatments can be problematic if they have not been shown to be a benefit first in an off-road test environment. A driving simulator is an ideal tes environment as it provides a safe, inexpensive and ethical facility to address these issues. The driving simulator at MUARC was developed by the Transport Accident Commission using the latest silicon graphics projections and provides a 180 degree front view as well as a rear image. The simulator also provides “road feel” through three positive feedback dampers under the car and a quadraphonic sound system. From earlier work, the simulator had been shown to be a valid test environment for evaluating PCMs. A number of participants were recruited to “drive” the simulator and a total of seven human factor experiments were conducted to test systematically a range of PCMs, including: •
Transverse road markings;
•
Lane edge & herringbone treatments;
•
The Drenthe province treatment from the Netherlands;
•
Centreline and other edgeline treatments; and
•
Several enhanced curvature treatments.
Drivers drove a series of test tracks which had previously been programmed to include similar treated and untreated road locations. Speed and lateral position measures were compared at both the treated and untreated locations. Differences were tested statistically to demonstrate significance using Analysis of Variance techniques.
xi
TRANSVERSE LINES Transverse lines are high contrast, painted or thermo-plastic strips about 60cm wide that are placed across the driving lane for up to 400m on the approach to an intersection or hazard. They are generally spaced at decreasing spacings in the direction of travel. The results from this study showed that transverse lines can be effective at reducing trave speed by up to 11 km/h, both immediately after entering the treatment zone (suggesting an alerting effect) as well as throughout the treatment area (consistent with a perceptua effect). However, it did not seem to matter if the transverse lines were at decreasing or constant spacings. A half Wundt Illusion treatment (forward facing chevrons across the lane) had little effec on travel speed compared to transverse lines. LANE EDGE & HERRINGBONE TREATMENT Peripheral transverse lines (approximately 60cm from the lane edge) also resulted in significant speed reductions on the approach to an intersection, although not as large as the full-width lane lines. A herringbone pavement marking system with decreasing line frequency had been previously suggested as a PCM to speeding in the lead-up to a road hazard. This was a variation of peripheral transverse lines angled at approximately 45deg to the edgeline tha can be placed either pointing towards the approaching vehicle or away from it. The results showed some speed reductions for herringbone edgeline treatments, similar to those for the peripheral transverse lines above. In addition, it did not seem to matter if these lines were perpendicular to the edge of the road or slanted either towards or away from the driver. A novel tree planting alongside the road at diminishing spacings had no effect on travel speed. THE DRENTHE PROVINCE TREATMENT This treatment was first developed in the Netherlands and has been used there to counte speeding on 80 km/h rural highways. The standard version comprises a gravel centreline (with while intermittent strips) as well as intermittent gravel edgeline treatments and provides 2.25m of free road surface between these treatments. Variations of the Drenthe treatment examined here included white painted edgeline treatments (no gravel) and solid gravel edgeline treatment. The results showed that only the standard Drenthe treatment elicited significant speed reductions of up to 2 km/h but did cause vehicles to move 16 cm closer to oncoming traffic. Other variations failed to produce significant speed reductions. CENTRELINE AND EDGELINE TREATMENTS The next series of tests examined the effectiveness of novel median treatments (white gravel and white hatching) and two edgeline treatments (a chequered pattern and low xii
contrast intermittent gravel edgelines. These treatments are intended to be used for long stretches of road as a speed countermeasure. Hatched median strips were successful in reducing travel speed by 3 km/h. In conjunction with a low visual contrast gravel edgeline, it further reduced speeds by 3 km/h. These speed reductions only occurred on straight road sections. The chequered edgeline and gravel median, however, did not influence travel speeds. Narrow lanes (below 3 metres) also produced significant speed reductions, although the traffic mix would need to be taken into account when choosing this treatment. CURVATURE TREATMENTS Previous research has suggested that some road curves are hazardous because they are perceived by drivers to be less curved than they really are. Thus, low cost PCM treatments for these hazardous curves need to correct this illusion by over-stating the amount o curvature. Examples include enhanced edge and centreline lines or roadside posts (both constant height and ascending patterns) that suggest a sharper curve. The results showed that edgeline enhancements actually led to higher travel speeds and tended to shift the vehicle closer towards the centreline. An enhanced centreline, on the other hand, resulted in no significant changes in travel speeds and lateral position. An enhanced post layout on the outside of the curve only was the best post configuration in terms of reduced travel speed for left curves. An enhanced post layout on the outside of the curve with ascending post heights led to less speed reduction on the left curve than the non-ascending posts, but also led to a speed reduction on the right curve. Post spacing treatments generally had little effect on the lateral position of the vehicle. CONCLUSIONS A number of these PCMs appeared effective at reducing travel speed, including: •
Full-width transverse lines;
•
Peripheral transverse lines and lane edge herringbone treatments;
•
Hatched median (especially with a lane width narrower than 3 metres), with or withou intermittent gravel edgelines;
•
Enhanced post spacings (possibly with ascending heights) for road curves.
It was noted that the effects of these treatments need to be further evaluated on the road to demonstrate finally the speed reduction benefits, both immediate and longer-term, as wel as their safety benefits. RECOMMENDATIONS A number of recommendations for further research are listed in the report, including a cost-benefit analysis of promising treatments and examination of other PCM treatments that might be applicable.
xii
1. INTRODUCTION Speeding has long been recognised as a major factor in many road crashes. Excessive speed was noted as a definit cause in 8 per cent of crashes and up to twice this as a probable cause in studies overseas (Treat, Tumbus, McDonald, Shinar, Hume, Mayer, Stanisfer, & Castellan, 1977). Others have suggested that these findings are conservative (e.g. Ruschman, 1981), arguing that a number of other studies suggest that speeding is really involved in up to 37 per cent of fatal crashes. In Australia, excessive speeding has been noted as a contributing factor in up to 30 per cent of fatal crashes (Haworth & Rechnitzer, 1993). On this basis, speed related road trauma is likely to cost the Australian community up to A$1 billion annually (A$260 million in Victoria). A variety of approaches have been adopted to control excessive speeding on the road and these are explained fully in the Speed Revie by Fildes and Lee (1993) and the Traffic La Enforcement review by Zaal (1994). While police enforcement and traffic engineering measures are quite rightly the main weapons against excessive speeding, there have been a number of calls for supplementary measures to help counteract speeding. Fildes and Lee (1993) undertook an assessment of the needs for further research and action to reduce excessive speeding on the road which involved leading Australian experts. The highest priority in both categories was for further development of low cost perceptual countermeasures, aimed at reducing travel speed on the road. 1.1
DEFINITION
Perceptual countermeasures against excessive speeding refer to manipulations of the road scene presented to a driver that can influence his or her subsequent behaviour. For the most part, these treatments tend to be relatively low cost additions or modifications to the road or the immediate roadside setting that can lead to a change in the way the driving environment is perceived by drivers. A typical example would be a pattern painted on the road surface to induce the illusion that one is travelling much faster than without the treatment. 1.2
PROJECT BACKGROUND
The perceptual countermeasures to speeding project has four stages, of which, the curren report documents the third stage. The first stage was a literature revie of perceptual countermeasures (PCMs) by Fildes and Jarvis (1994). This revealed a range of road treatments likely to affect a driver's perception of speed on the road, some of which had been trialed overseas. These included transverse lines, herringbone and checked patterned edgelines and/or medians, low contrast rumble centreline and edgelines, rumble comb edgeline treatments, various median strip treatments, curve enhancing lines, and raised pavement markers. While some of these treatments had been evaluated in terms of their crash reduction and/or behavioural change, the majority of them had not. Moreover, a systematic study of their relative effectiveness had not been carried out to date, including consideration of whether these treatments are necessarily optimal in reducing travel speed on the road. The second stage of the project was a simulator validation study (Fildes, Godley, Triggs, & Jarvis, 1997). The driving simulator (also used in the current stage) was formerly owned b
1
the Transport Accident Commission of Victoria, but was donated to Monash University Accident Research Centre in July 1998. The validation study compared driving through perceptual treatments (transverse rumble strips) on roads in an instrumented car with driving through the same treatments on the simulator. This was done on the approach to two intersections and two curves. The investigation concluded that mean speed and lateral position were valid dependent measures to use on the simulator when evaluating PCMs. For the third and current stage of the project, a representative range of PCMs was evaluated using the driving simulator. Experiments were conducted to determine whether participants reduced speed, and if they did, what was the underlying psychological reason for the speed reductions. Three broad categories of PCMs were evaluated. As shown in Table 1.1, one or more experiments examined PCMs in each category. Table 1.1: Categories and examples of perceptual countermeasures, and experiments they were evaluated in PCM CATEGORY
CHAPTER
Decelerating Vehicles
Chapter 3
Continuous Roads
Chapter 4
Curve Enhancements
Chapter 5
• • • • • • • • •
EXAMPLES Transverse lines Wundt illusion Herringbone illusion Lane width reduction Medians Wide edgelines Rumble edgelines Lane edge hatching Guide posts
• • • • • •
EXPERIMENTS Experiment 1 Experiment 2 Experiment 3 Experiment 4 Experiment 5 Experiment 6
•
Experiment 7
The present report is a summary document of the seven experiments in Table 1.1. Chapter 2 outlines the General Method for all of the simulator experiments. Chapters 3 to 5 briefl report the perceptual treatments evaluated, and briefly describe the main results and conclusions from each experiment. Chapter 6 provides a General Discussion. A full scientific report is also available as an accompaniment to this summary report. Included is a full description of all experimental procedures, data analysis techniques, statistical results, and discussions of each experiment. Those interested should contact Monash University Accident Research Centre for copies of this comprehensive document.
2
2. GENERAL METHOD Below is a generic description of how each experiment was conducted on the simulator. Permission was sought from and granted by the Monash University Standing Committee on Ethics in Research in Humans Committee for the experiments in this stage of the project. 2.1
PARTICIPANTS
Each experiment involved between 24 and 36 participants, both male and female, o various ages. All had a full Victorian driving licence and a minimum of three years driving experience. Participants were recruited from Monash University through pamphlets placed on car windscreens in the university car park, and notices placed on university notice boards. They were paid $10 for a one hour simulator session. 2.2
SIMULATOR
The TAC simulator, used in the current research program, is a mid-range fixed-based driving simulator. It has a full car body with normal controls, including automatic transmission. The presentation of the visual stimuli was through computer graphics projected onto four screens. These produced 180 degrees of forward lateral vision, and 60 degrees of rear lateral vision. The vertical visual angles of all screens were 60 degrees. Visual images were updated at a rate of 30 Hz. The simulator also included a quadraphonic surround sound audio system, and a motion platform providing vertical movements. From the driver’s point of view, the simulator vehicle was used and reacted in the same way as a real car. Therefore even to “start” the vehicle, the ignition key was used, resulting in engine noises similar to a normal car. A photo of the simulator car, the front screens, and projection units can be seen in Figure 2.1. A full description of the simulator can be found in Fildes, Godley, Triggs, & Jarvis (1997), as well as in the full version of the curren report. 2.3
GENERAL DESIGN
In each simulator experiment, participants drove through a number of scenarios in a counterbalanced order. Each scenario consisted of one or more treatments, as well as areas of normal (control) roads. A fully repeated measures design was used in all experiments except Experiment 4, which used a partial repeated measures design. The road environments were rural, except in Experiment 6, when both rural and industrial surroundings were used. Driving performance during perceptual road treatments was compared with the same participant’s performance when driving through other treatment sites and/or one or more control roads. The various treatments evaluated in the same experiment generally onl varied from another treatment on one aspect. For example, the edgeline of two treatmen roads may be different, but the median, lane width, and surrounding scenery were identical. Control roads consisted of standard lane delineation. In some experiments, more than one version was used, varying such aspects as the lane width or surrounding scenery for purposes of comparison with treatment roads with these variations.
3
Dependent variables differed between the experiments. For the decelerating vehicles experiment series (described in Chapter 3), only mean speed was analysed. For the continuous driving series of experiments (described in Chapter 4), variables used were mean speed, mean lateral position, lateral variation (standard deviation of lateral position), and steering effort (standard deviation of the steering wheel angle). The latter two variables were used as measures of driver workload. Additional workload measurements were obtained from a secondary auditory-verbal calculation task from Harms (1991), (Experiment 4), and through the NASA Task Load index (NASA-TLX) subjective workload questionnaire from Hart and Staveland (1988), (Experiments 5 and 6). For the curve enhancement experiment (Experiment 7), variables used included mean speed, mean lateral position, and the standard deviation of both lateral position and the steering wheel angle.
Figure 2.1:
2.4
TAC simulator at Monash University Accident Research Centre
PROCEDURE
Participants read a project explanatory statement and signed an informed consent form (approved by the Monash University Ethics Committee). Following this, they read experimental instructions specific to the particular experiment. These generally informed participants to drive in the same way they would in a real vehicle on a real road in the conditions they experience. The first contact with the simulator was a familiarisation drive. This involved the experimenter sitting in the car with the participant and explaining various aspects of the simulator. This drive typically lasted two to three minutes. After each drive throughout the experiments, the participant vacated the car. This was done to reduce the possibility of the participant experiencing simulator discomfort, and lasted for approximately one minute. All drives after the familiarisation were done with the participant alone in the car whilst the experimenter controlled the computers and monitored the participant from the simulator control room. The second drive presented was always a practice scenario. These used similar databases to the experimental drives for the particular experiment excluding the perceptual road treatments. These drives continued for approximately five minutes.
4
Following these two drives, participants drove between 2 and 7 experimental drives. The order of presentation of these drives was counterbalanced between participants. At the end of the experiment, participants were thanked for their participation and paid $10. Simulator sessions lasted one hour. 2.5
DATA COLLECTION & ANALYSES
2.5.1
Data Collection
The simulator collects data for every possible dependent measure thirty times a second. single data file is recorded for every drive each participant completes. To enable practica usage of such data, data marks were placed on the scenario path. These marked the position of the start and end of ever measurement area or data collection area (DCA) of interest. In this way, each data file could be parsed to calculate the means and/or standard deviations of each variable of interest within each DCA. The data collected for the other variables, and for all variables in the areas driven outside the marked DCAs, was discarded. Such parsing creates a single ASCII file, with single scores for each participan for each variable of interest for each DCA. 2.5.2
Data Analysis Approach
Each data analysis (with the partial exception of one of the two analyses in Experiment 1), used an analysis of variance with planned orthogonal contrasts (Hays, 1973). The planned approach means that contrasts to be tested are nominated a priori (before the experiment is conducted) on the basis of theoretical reasoning (rather than the direction of the data). As such, the results of an overall ANOVA are irrelevant, so the overall test is not conducted. For multi-factorial designs, these contrasts are planned for each factor. For each factor, contrasts are chosen to be orthogonal (independent) to each other contrast in the same factor. These contrasts are known as main effect contrasts. If there are k levels of a factor, there is a maximum of k-1 orthogonal contrasts for that factor. The multiplication of each main effect contrast from one factor with each contrast from each other factor produces orthogonal interaction contrasts . If there are k-1 orthogonal contrasts for the first factor and j-1 in the second, then the maximum number of orthogonal interaction contrasts is ( k − 1) × ( j − 1) . Interaction contrasts are orthogonal to main effect contrasts. In ANOVAs, each factor is usually treated as a single family, and a family-wise error rate is controlled at α = 0.05. However, when all contrasts are orthogonal, a decision-wise error rate of α = 0.05 can be applied to each individual contrast, whilst controlling the familywise error rate at α = 0.05. That is, (Bonferroni) adjustments of the alpha level are no needed to account for the number of contrasts tested.
5
6
3.
PERCEPTUAL COUNTERMEASURES FOR DECELERATING MANOEUVRES
Perceptual countermeasures for decelerating manoeuvres are placed on the approach to hazards such as intersections, roundabouts, and motorway exit ramps. They are designed to encourage drivers to decelerate more rapidly than they usually would through influencing their perception. There are two categories of such PCMs, and these are reported separatel in Sections 3.1 and 3.2. 3.1
EXPERIMENT 1: TRANSVERSE LINES AND OTHER SIMILAR PCMs
3.1.1
Background
Transverse lines are high contrast, painted or thermo-plastic strips, usually 60 cm wide. They are placed across the driving lane, over lengths of 50 to 400 metres, and usually on the approach to a hazard. Transverse lines are generally spaced at decreasing distances apart in the direction of travel. An example can be seen on the top left of Figure 3.1. Some on-road evaluations of transverse lines have been conducted in the UK, Israel and Australia, with mixed results. Taking into account all of these evaluations, it is not clear whether transverse lines are an effective long term countermeasure to speeding. That is, whether they will influence drivers’ speed perception (and so should have a similar speed reduction influence on drivers no matter how many times a driver experiences them), or will only alert drivers of an approaching hazard (and become ineffective over time if drivers choose to ignore them). The current experiment evaluated this issue of alerting and perception by examining the location of speed reductions with respect to the treatment, as well as comparisons with a peripheral transverse lines treatment (designed to primarily influence speed perception only), seen in bottom left of Figure 3.1. There is no evidence that decreasing the distance between each line is necessary to produce speed perception changes. This was evaluated by comparing speed reductions fro transverse lines with decreasing spacing between the lines with the same treatment with a constant distance between the lines. It has also been suggested that transverse lines will only reduce travel speeds if drivers are speed adapted (e.g. Helliar-Symons, 1981), that is, if they perceive they are travelling slower than they are because they have been travelling at a constant speed for a prolonged time. However, this assertion has never been specifically evaluated prior to this experiment. Several PCMs were designed as less expensive alternatives to transverse lines for evaluation in this experiment. The design of these was based on the theoretical reasoning that transverse lines influence speed perception through peripheral vision. As such, these treatments used lines or trees in the periphery of drivers vision, and spaced at the same decreasing spacings as used for transverse lines (using the recommendations of HelliarSymons, 1981). The three alternatives evaluated were peripheral transverse lines (Figure 3.1. bottom left), herringbone pattern (Figure 3.1, top right), and trees on the side of the road (Figure 3.1, right bottom).
7
Figure 3.1:
3.1.2
Transverse lines (left top); peripheral herringbone pattern (right top); peripheral transverse lines (left bottom); and edge of the road trees (right bottom).
Experimental Design
Experiment 1 was a wholly repeated measures design involving participants driving the TAC simulator on rural roads with a 100 km/h speed limit. These roads included the six treatments described below in Table 3.1. The configuration of these treatments can be seen in Appendix A. The treatments were placed over approximately 400 m, ending 35 m before a give-way cross-intersection. As can also be seen in Table 3.1, of the six treatments, four were evaluated twice, after normal driving for approximately one kilometre, and after extensive driving for four kilometres on a straight road at a constant speed so that drivers would be in a state similar to being speed-adapted (see Denton, 1976). Table 3.1: PCMs evaluated in Experiment 1 Driver
Treatments Evaluated
After normal driving
Transverse lines with decreasing spacings Transverse lines with constant spacing Peripheral transverse lines with decreasing spacings Peripheral herringbone pattern with decreasing spacings Trees on the road edge with decreasing spacings Plain road control
After extensive driving (similar to speedadaptation)
Transverse lines with decreasing spacings Transverse lines with constant spacing Peripheral transverse lines with decreasing spacings Plain road control
8
The dependent variable used was mean speed. The data analyses were based on the 400 metres of the treatment areas and the 100 metres before the treatments. This 500 metres were divided into 5 sections of 100 metres in length for the analyses to enable the exploration of the deceleration patterns. 3.1.3
Results & Discussion
Perceptual & Alerting Effects of Transverse Lines Speeds at the transverse line patterns and the peripheral transverse lines sites became significantly slower than at the control site during their 400 m long treatment areas, but not prior to it. Furthermore, speeds converged in the final 100 metres of treatment. This can be seen in Figure 3.2 and 3.3. The full lane width transverse lines did reduce travel speed compared to the control road, by 8 km/h when drivers were not speed-adapted, and by 11 km/h after speed-adaptation (averaged over the treatment area). Therefore, these results suggest that they are an effective perceptual countermeasure to speeding. This was expected from the majority of the past research. However, the aim of the curren experiment was to investigate why these speed reductions occurred to be able to predic their likely long term speed reduction effectiveness. Control Control (Speed Adapted) Treatments (Non-Adapted) Treatments (Adapted)
110
Speed (km/h)
100 90 80 70 60 50 40 Pretreatment 100m
Figure 3.2:
1st 100
2nd 100
3rd 100m
4th 100m
Data Collection Area
Mean speed (±SE) for the control and three treatment roads (decreasing transverse lines, constant transverse lines, and peripheral transverse lines) both before and after speed adaptation. Peripheral Transverse Lines
100
Peripheral T-lines (Adapted)
Speed (km/h)
90
T-Lines (Non-Adapted) T-Lines (Speed Adapted)
80 70 60 50 40 Pretreatment 100m
Figure 3.3:
1st 100
2nd 100
3rd 100m
4th 100m
Data Collection Area
Mean speed (±SE) for the peripheral transverse lines and the two transverse lines (decreasing and constant spacings) both before and after speed adaptation.
9
Alerting
If alerting played an important role in the speed reduction effectiveness of transverse lines, then it would be expected that full lane width transverse lines would result in more alerting than peripheral transverse lines. Furthermore, alerting effects would be expected to be shown as speed reductions before the lines were reached, and possibly immediately after they were reached. There was some evidence of this from slightly slower speeds before the transverse lines sites than the peripheral lines site by 4.4 km/h (seen in Figure 3.3). Thus, some speed reductions resulting from transverse lines may be the result of alerting effects, and so may not endure in the long term. However, as will be discussed below, this is only a minor contribution compared to their speed reduction influences. Speed perception
The only speed difference found between the full lane width and peripheral transverse line patterns was in the first 100 metres of treatment (and up to the first 200 meters). During this section, the full width lines induced slower speeds than the peripheral lines (from the initial greater alerting they produce). After this area, the speed profiles of peripheral and full lane width transverse lines were very similar, suggesting they both had similar influences on drivers’ speed perception. The speed reductions found during the first 300 metres of the transverse lines and peripheral lines, seemed to have occurred because of an ongoing influence of the lines. That is, it was not only because the drivers initially slowed down due to an alerting mechanism. This can be said because the edge of the road trees also led to an initial speed reduction in the first 100 metres, albeit smaller than for transverse lines. However, for the tree treatment, drivers then appeared to compensate for this lost speed, and the final 300 metres was driven faster than the control road was. There is no reason why a similar effec would not have also occurred for the transverse lines if it was not for some on-going influence. This influence is likely to have been through changes in speed perception. Decreasing spacing
To evaluate whether the decreasing spacings of transverse lines are necessary for speed perception to be effected, speed reductions were compared with an equivalent set o transverse lines that were positioned at constant intervals apart. If the spacing of the transverse lines had any influence on speed perception, then there had to be a larger speed reduction caused by the decreasing spaced transverse lines than the constant spaced lines. However, as can be seen in Figure 3.4, this was not found in the current experiment, with no speed differences being found at all between the two types of transverse lines. Furthermore, after speed adaptation, when it has been theorised that transverse lines should have a greater effect on speed due to a greater pre-treatment speed underestimation, there was still no indication of a difference in speed reductions between the two spacing regimes. Therefore, it appears that the spacing scheme of transverse lines does not affec drivers’ speed.
10
Constant Transverse Lines Constant T-Lines (Adapted) Decreasing Transverse Lines Decreasing T-Lines (Adapted)
100
Speed (km/h)
90 80 70 60 50 40 Pretreatment 100m
Figure 3.4:
1st 100
2nd 100m
3rd 100m
4th 100
Data Collection Area
Mean speed (±SE) for the decreasing spacing transverse lines and the constant spacing transverse lines, both before and after speed adaptation.
Limit of the influence
The final issue regarding transverse lines is that during the last 100 metres of treatment, speeds were the same as they were at the control road. In addition, they started to merge as early as 200 metres from the end of the treatment. This may be expected as velocities had already been reduced by the time this area was reached, so less speed reduction (compared to the control) could occur. Similar results were also found by Jarvis and Jordan (1990) 80 metres before the intersection. In addition, their before and after treatment speeds started to merge in the final 100 metres of treatment. They interpreted this pattern of speed reduction, however, as indicating that transverse lines only reduce speed in areas where the driver cannot yet make an accurate judgement of the hazard. When they can make this judgement, drivers make speed choices based on their perception of the intersection itself, and not the lines. Thi was probably the case in the current experiment as well. If drivers make speed judgements entirely based on the intersection in the final 100 metres of treatment, it could be argued that transverse lines do not need to be extended as far as 35 metres before the intersection. Rather, they may be able to stop 135 metres before the intersection to reduce implementation costs without affecting speed behaviour adversely. A similar suggestion was made by Jarvis and Jordan (1990). However, not placing lines in the last 135 m may diminish the alerting qualities of the lines, and lead to less of an initia speed reduction. This can be predicted from the findings of Burney (1977), who concluded that transverse lines need to be near a hazard to be effective in reducing speeds. Ending the lines as far back as 135 metres before the intersection may not reach this criterion. Therefore, this idea would benefit from a similar simulator investigation to the presen experiment to ensure that it does not change speed behaviour. Effect of Speed Adaptation It was hypothesised that transverse lines only reduce speed after speed adaptation (HelliarSymons, 1981), or at least that they will be more effective after speed adaptation (Burney, 1977; Denton, 1971). This latter notion was partially supported here, as seen in Figure 3.2, as the three treatments tested (both transverse lines and the peripheral transverse lines), were slower than the control roads after drivers were expected to be in a state similar to speed adapted (more so than after normal driving). This was only statistically significant in
11
the second last 100 metres of treatment compared to the final 100 meters as an interaction. Averaged across the total measurement area, the treatments and control did not differ significantly (only at a 10% trend level) before and after speed adaptation. This lack of full statistical significance was possibly due to the convergence of speeds in the final 100 metres of the treatments and controls. Future research, therefore, may clarify this result. Thus, speed adaptation is not necessary for transverse lines to reduce speed. However, the may be slightly more effective when driving is speed-adapted, but future research is needed to clarify this. Averaged over the treatment area, the numerical extra reduction after adaptation was 3.5 km/h for the peripheral transverse lines, and 5 km/h for the combined transverse line sites. Effectiveness of Alternatives to Transverse Lines Peripheral line
Peripheral transverse lines did lead to speed reductions, by an average of 6.6 km/h before speed adaptation and 9.2 km/h after adaptation (compared to the control). However, they produced smaller speed reductions than full lane width transverse lines. As discussed above, the main difference found between the full width and peripheral lines was the addition initial speed reduction for the full width lines, suggesting peripheral lines possess less alerting properties. These results can be seen in Figure 3.5. 110
Herringbone
100
Peripheral Transverse Lines Decreasing Transverse Lines
90 80 70 60 50 40 Pretreatment 100
Figure 3.5:
1st 100m
2nd 100
3rd 100m
4th 100m
Data Collection Area
Mean speed (±SE) for the three roads with road markings at decreasing distances apart, transverse lines, peripheral transverse lines, and the herringbone pattern.
It was predicted that the peripheral herring lines (at a 45° angle), may have resulted in a larger speed reduction than the peripheral transverse lines (at a 90° angle). This was from the possibility that they gave the driver an impression of an approaching narrowing lane width. However, this was not found, and the speed results for each of these treatments were equivalent to each other in all ways. This suggests that the lane narrowing illusion could not be seen by the drivers, or if it was, it was ignored. Therefore, peripheral transverse lines do lead to speed reductions in a similar way to transverse lines, but without as much initial impact during the first 100 metres of treatment. Thus, peripheral lines do seem to be an appropriate substitute for transverse lines. The speed difference averaged over the treatment area compared to the full lane width lines was only 1.4 km/h for non-adapted driving, and 3 km/h after speed adaptation. Importantly they are cheaper to implement (from less paint), and have a lower maintenance (due to minimal driving over them). Whether the lines are placed at 45° or 90° to the kerb, does not seem to influence driving. This issue, however, is investigated further in Experiments 2 and 3. 12
Edge of the road tree
Trees on the side of the road did not reduce travel speed as much as they were expected, as can be seen in Figure 3.6. Transverse lines influence speed perception and reduce trave speed partially through peripheral vision, and edge of the road trees are also perceived through peripheral vision. Thus, it was expected that the trees may have a similar effect on peripheral speed estimations as transverse lines. However, this was not found, and the trees did not reduce travel speeds averaged over the treatment area. Control
100
Road Edge Trees
90
Roads with Line Markings
80 70 60 50 40 Pretreatment 100
Figure 3.6:
1st 100m
2nd 100m
3rd 100m
4th 100
Data Collection Area
Mean speed (±SE) for control road, edge of the roads trees, and the three roads with road markings with decreasing distances apart (transverse lines, peripheral transverse lines, and the herringbone pattern).
This is not to say that the edge of the road trees did not have any effect on speed at all. They did slow speed down compared to the control in their first 100 metres. This suggests that their overwhelming peripheral visual presence has an intuitive effect on drivers to proceed slower. However, once drivers become acquainted with the presence of the trees, they choose to compensate for this initial reduction by (relatively) reducing their rate o deceleration. This was found in the final 300 metres, to a level faster than the control Therefore, on the basis of this evidence, trees are not a suitable alternative to transverse lines. 3.1.4
Conclusions
The results of Experiment 1 suggest that: •
Transverse lines are effective in reducing speed on the approach to an intersection, b up to 11 km/h.
•
Transverse lines exhibit both alerting effects on drivers (speed reductions in the initial treatment area) and speed perception influences (the main speed reduction effect).
•
Transverse lines are likely to have long term speed reduction benefits.
•
The speed reduction effectiveness of transverse lines is not influenced by the spacing between the lines (either decreasing or constant).
•
Peripheral transverse lines (protruding only 60 cm from the lane edges) were also effective at reducing speeds, and produced only slightly less speed reduction than transverse lines across the whole lane (due to less alerting properties).
•
Speed reductions from the road treatments occurred until the driver could make decisions purely from the location of the intersection alone (approximately 100 metres), whence travel speeds were no longer influenced by the treatments.
13
•
Transverse lines (and peripheral transverse lines), were possibly slightly more effective after drivers were expected to be in a state similar to speed adapted, although these treatments were also effective in reducing speed before such adaptation.
•
Placing trees on the side of the road as a substitute for transverse lines did not reduce travel speed throughout the treatment and cannot be recommended as a speed reduction device.
3.2
EXPERIMENTS 2 & 3: ILLUSORY LANE WIDTH NARROWING
The current section is concerned with PCMs that attempt to reduce driving speeds, in part, by giving drivers the impression that the approaching lane width is narrowing. Examples o these included the herringbone pattern and the Wundt pattern. Although such treatment have been implemented in the USA, it has never been established whether such patterns do actually produce lane narrowing illusions. Thus, Experiment 2 was designed to address this issue, whilst Experiment 3 examined the general speed reduction effectiveness of these treatments. Three herringbone patterns evaluated were developed from a version used by Koziol and Mengert (1977). The first pattern, illustrated in the top picture of Figure 3.7, should theoretically induce a lane narrowing illusion. This is because placing herring lines pointing inwardly backwards produces an illusion that the lane is narrowing at the end o the treatment (from a plan view at least). Two versions of the pattern were used with the herring lines at this orientation. The first used a decreasing line spacing, whilst the second used lines with a constant spacing. (This second condition was not involved in Experimen 2.) A comparison between these two treatments was used for further evaluation of the idea that similar treatments (including transverse lines) will encourage increased deceleration from decreasing spacing between their lines. The third herringbone pattern used had its lines pointing forward at decreasing distances apart. An example can be seen in the middle of Figure 3.7. This pattern should produce the illusion of an increasing lane width. Thus, a comparison of the two orientations at a drivers view was used to demonstrate whether a lane narrowing illusion occurs (if at all) because of the line orientation, rather than from the narrower unpainted pavement area. A fourth treatment, the Wundt pattern, was also evaluated. This pattern has been investigated as a PCM by both Shinar, Rockwell, and Malecki (1980) and Pyne, Carsten, and Tight (1995). From the findings of these studies, however, it cannot be determined whether the Wundt illusion provides any additional speed reduction benefit over similar lines placed on the road in a pattern not aimed at producing a lane narrowing illusion. Tha is, it has not been determined to date whether the Wundt’s illusion, when seen by a driver, will produce a visual illusion that the lane ahead is narrowing. Experiments 2 and 3 only used half of the Wundt pattern, rather than the full length. As can be seen in the bottom of Figure 3.7, this results in the treatment ending with the section of the illusion that should be perceived as narrower than the other areas. This section was in the middle of the pattern when used by Shinar, et al. (1980) and Pyne, et al. (1995). This half pattern has not been investigated to date.
14
3.2.1
Experiment 2: Method
Experiment 2 investigated the strength of the lane narrowing illusions of the herringbone and Wundt patterns. It did this by obtaining lane width ratings when images of these road treatments were seen from a plan view, as well as when seen at the same angle as a driver would view them if they were placed on the road ahead. Images of roads from the simulator were presented to participants on a computer monitor. Each participant viewed three experimental slides, with each slide containing one of the three treatment roads and a control road (with no special lane markings) for comparison purposes. In a between-participants design, participants either viewed simulator images from a plan view (90° from above), as shown in Figure 3.7, or at the same angle as seen by drivers, as presented in Figure 3.8. Their task was to rate on a scale how narrower or wider the treatment road appeared to become compared to the control road. The three treatments evaluated are presented in Table 3.2. Table 3.2: Four treatments used in Experiments 2 & 3 Treatments Evaluated Herringbone pattern with backward orientated lines and decreasing spacings Herringbone pattern with backward orientated lines and constant spacings (used in Experiment 3 only) Herringbone pattern with forward orientated lines and decreasing spacings Half Wundt pattern Plain road control (used for comparison only in Experiment 2)
Figure 3.7:
Herringbone pattern with lines pointing backward (top), herringbone pattern with lines pointing forward (middle), and the Wundt illusion as appropriate for an intersection approach (bottom), as presented for the plan view ratings.
15
Figure 3.8:
3.2.2
Herringbone pattern with backward orientated lines (left) and the Wundt Illusion, as seen from a driver’s perspective.
Experiment 2: Results
As can be seen in Figure 3.9, the backward orientated herringbone pattern led to narrower lane width ratings than the control when seen at a plan view. The forward pointing herringbone (which was predicted to receive a wider rating than the control road at a plan view), was rated as statistically different to the above herringbone pattern from the plan view, but was not rated differently to the control. From the driver’s view, the two herringbone treatment roads were not rated differently to each other. Furthermore, neither were rated as statistically different to the control road. Therefore, it can be concluded tha neither the orientation of the lines nor the narrower unpainted lane width will cause drivers to view the lane width as narrowing. The Wundt illusion was rated as narrower than the control from the plan view as predicted and shown in Figure 3.9, but from the driver’s view, it was not rated as statistically different to the control. The latter goes against the original reason Shinar et al. (1980) used the pattern, as they assumed that drivers would perceive a lane narrowing illusion.
Lane Width Rating
Wider than 15 control 10 5 0 -5 -10 -15 -20 -25 -30 Narrower than control -35 Herringbone: Backward Lines
Plan view Driver's vie
Herringbone: Forward Lines
Half Wundt Pattern
Treatment Figure 3.9:
Subjective lane width ratings (±SE) for the three treatments relative to the control. (Note: less than zero indicates narrower than the control, greater than zero indicates wider than the control, and zero indicates the same as the control).
16
3.2.3
Experiment 3: Method
To follow-up on the above findings to establish if the treatments evaluated in Experiment 2 lead to speed reductions, as well as to establish why they may do so, Experiment 3 evaluated these treatments using the simulator in terms of driving behaviour. The four treatments that appear in Table 3.2 were placed over approximately 100 metres on the approach to give-way intersections on rural roads. The dimensions of these treatments appear in Appendix B. The same procedure was used as for Experiment 1, and driving speed was also measured at a control road. The data analysis was based on four 50 metre sections of each treatment (or control), consisting of 100 metres prior to the treatments and 100 metres during the treatments. 3.2.4
Experiment 3: Results
The herringbone patterns did induce speed reductions compared to the control road by 2.03 km/h as seen in Figure 3.10. However, as can be seen in Figure 3.11, the recorded speeds did not differ amongst the three versions of the pattern used. Speed reductions across the measurement areas were also similar enough so that no interactions occurred with the herringbone treatment and control between the pre-treatment and treatment areas. Therefore, these results lend support to the hypotheses that the herringbone patterns affect driving speeds through a perception of a narrower driveable lane width, and/or speed perception influences. Control Herringbone Treatments
90 80 70 60 50 40 30 Pretreatment 1st 50
Figure 3.10:
Pretreatment Treatment 2nd 50m 1st 50 Locatio
Treatment 2nd 50m
Speed (±SE) for the control road and the three herringbone patterns combined.
90
Herringbone: Forward pointing lines
80
Herringbone: Backward pointing lines
70 60 50 40 30 Pretreatment 1st 50
Figure 3.11:
Pretreatment Treatment 2nd 50 1st 50 Location
Treatment 2nd 50
Speed (±SE) for the forward pointing h rringbone pattern and the two backward pointing herringbone patterns (combined).
As can be seen in Figure 3.12, there was also no speed reduction differences between the two herringbone patterns with lines pointing towards the approaching driver, one with decreasing spacing and the other with a constant distance between the herring lines. Thus, 17
this corroborates the conclusion of Experiment 1 that the decreasing spacings of transverse lines does not influence speed perception or travel speed. 90
Backward Herringbone: Decreasing spacing
80
Backward Herringbone: Constant spacing
70 60 50 40 30 Pretreatment 1st 50m
Figure 3.12:
Pretreatment Treatment 2nd 50m 1st 50m Location
Treatment 2nd 50m
Speed (±SE) for two backward pointing herringbone patterns, one with decreasing spacing and the other with constant spacings.
The half Wundt illusion pattern also led to a speed reduction in the treatment area by 3.75 km/h compared to the control road, but as seen in Figure 3.13, not prior to it. Taking into account the lane width ratings finding in Experiment 2, this suggests the main effect the Wundt pattern had on speed was similar to the transverse lines in Experiment 1. Thus, it appears that the Wundt illusion has no advantage over traditional transverse lines, and as such, cannot be recommended to be used instead of transverse lines. 90
Control Half Wundt's Illusion
80 70 60 50 40 30 Pretreatment 1st 50m
Figure 3.13:
3.2.5
Pretreatment Treatment 2nd 50 1st 50m Location
Treatment 2nd 50
Mean speed (±SE) for the half Wundt’s treatment and control road.
Experiments 2 & 3: Conclusions
The findings of both Experiments 2 and 3 together suggest that: •
The herringbone treatments tested here are effective in reducing speed on the approach to a hazard, but not any more effective than other similar treatments such as peripheral transverse lines.
•
The Wundt illusion is effective in reducing speed on the approach to a hazard, but not any more effective than transverse lines.
•
There was no evidence that any of the treatments evaluated gave drivers an illusion that the lane width ahead was narrowing.
18
•
Taking relative treatment costs into account, the herringbone pattern and Wundt illusion cannot be recommended for implementation on the road over peripheral and full lane width transverse lines.
19
20
4.
PERCEPTUAL COUNTERMEASURES FOR ROADS WITH CONTINUOUS DRIVING
Whilst perceptual countermeasures have traditionally been developed as “black-spot” treatments, they can also be used on roads involving continuous driving. These are expected to influence drivers’ speed for a number of reasons, including encouraging drivers to increase their level of steering effort to remain within the confines of the lane, increasing drivers’ perception of accident risk, and changing drivers’ perception of speed. To examine the most effective way to implement PCMs on continuous roads, three experiments were conducted which are presented in separate sections below. 4.1
EXPERIMENT 4: DRENTHE PROVINCE EDGELINE & CENTRELINE PERCEPTUAL COUNTERMEASURE
4.1.1
Background
Experiment 4 evaluated an existing PCM treatment that will be referred to as the Drenthe Province PCM. It was formulated in the Netherlands by the TNO research organisation and the University of Groningen. Development and evaluations have been conducted by Van der Horst and Hoekstra (1994) in a simulator study, De Waard, Jessurun, Steyvers, Raggatt, & Brookhuis (1995) in an instrumented car study, as well as by Steyvers (1998), who measured public traffic in a two-year follow-up study. The design of the treatment is shown in Figure 4.1, and an image of this treatment from the simulator can be seen in Figure 4.2. edgeline White paint & Gravel chippings
Sealed Road Edge 3m
9.5 m 0.30 m
centreline
Low contrast Gravel chippings 4m
2.25 m 4m 0.45 m
edgeline
Figure 4.1:
The Drenthe Province PCM (excluding the post mounted reflectors).
Figure 4.2:
Simulator image of the Drenthe Province PCM.
21
The Drenthe PCM had four speed reduction and/or safety enhancement aspects. Firstly, it had a narrow perceptual lane width of 2.25 m. The physical road width remained unchanged (2.75 m) to ensure that the occurrence of run-off-the road type accidents would not increase. Secondly, the Drenthe Province PCM had 45 cm wide unpainted and intermittent edgelines made from gravel chippings. These were designed to reduce visual guidance, and cause discomfort if driven over (so they would be an incentive for drivers to closely monitor their lane keeping to stay within the lane, which was intended to reduce driving speeds). The third safety aspect of the Drenthe treatment was that the centreline, which was painted intermittently, was widened to 30 cm. This extra width was thought to provide additional visual guidance to compensate for the reduced guidance of the low contrast edgelines and to increase vehicle separation. The centreline also contained gravel chippings (in both the painted and unpainted sections) in an attempt to lower the chance of lane encroachments into opposing traffic. The final safety aspects of the treatment were verge post-mounted reflectors containing “80” placed at 500 m intervals, and “80” painted on the road surface after every intersection. These additions were intended to inform and remind drivers of the speed limit of the road. No speed limit reminders had previously been provided on these roads. De Waard et al. (1995) found that travel speeds on this treatment road were 3 km/h slower than wider control roads with normal delineation on roads that were mostly curved and through woodlands, and by 1.5 km/h through open flat country (moorlands). However, mean speeds on the treated roads were still above the speed limit (approximately 84 km/h and 87 km/h, respectively). It was considered important to replicate the speed reduction findings in this research program. The influence of this treatment on driver behaviour has major ramifications for designing similar PCMs in the current project. However, the treatment had never been evaluated outside of the research group that developed it, on roads other than rural roads in the Netherlands, or with populations other than Dutch drivers. In addition, it had never been demonstrated whether driving speeds reduced (in response to the treatment) to the same extent if speed limit reminders are not included as part of the treatment. That is, if only the “perceptual” aspects of the treatment are included. 4.1.2
Method
Participants were presented with two-lane rural roads on the simulator that included straight sections, left curves and right curves (the latter two with a radius of curvature of 1000 metres). Participants were given a speed limit of either 80 km/h or 110 km/h. Whilst driving, participants also performed a secondary auditory-verbal calculation task (to measure mental workload). There were five delineation patterns on these roads that were presented to every participant, as can be seen in Table 4.1. The exact specifications of the treatments are provided in Appendix C. Table 4.1: Treatments and controls used in Experiment 4 Replication of the Drenthe Province PCM Drenthe PCM but with high contrast (painted white) edgelines without gravel Drenthe PCM but with continuous (non-intermittent) edgelines and centrelines Narrow Control road (same lane width as treatments i.e. 2.25 m) Wide Control road (2.7 m lane width) The Drenthe Province PCM and wide control road used here replicated the dimensions o the treatment and control used in the Netherlands. Unlike the on-road evaluations in the Netherlands, the speed limit reminders (on the road surface and verge posts) were no 22
incorporated into this experiment. A number of dependent variables were measured. These were mean speed, mean lateral position, lateral variation (standard deviation of lateral position), steering effort (standard deviation of the steering wheel angle), and reaction time to the secondary calculation task. These were measured separately for the straight sections, left curves and right curves. 4.1.3
Results
Mean Speed The Drenthe treatment led to slower driving than the wider control road, as found by De Waard et al. (1995) and Steyvers (1998). This difference can be seen in Figure 4.3. The speed reduction was 1.88 km/h, very similar to that found by De Waard et al. (1995) in their moorlands condition (1.5 km/h), which involved similar road-side open countr environments and curves. Steyvers (1998), however, did report larger speed reductions in his two-year follow-up study. Driving speeds were not slower for the average of the four narrower perceptual lane width roads than the wider control, and speeds were not influenced by the inclusion of the rumble centreline, nor the inclusion of the rumble edgelines when keeping the lane width constant (by using the narrow control road for comparison). Thus, although the complete Drenthe PCM led to speed reductions, there was no evidence that individual aspects of the treatment, namely lane width reduction, gravel edgelines or centreline, or low visual contrast edgelines were individually responsible for this speed reduction. 101
Speed (km/h)
99
Left Curves Right Curves Straights
97 95 93 91 89 87 85 Original Drenthe Treatment
Narrow Control Normal Control (wider (treatment lane width) lane width)
Treatments
Figure 4.3:
Mean speed (±SE) for the Drenthe PCM, narrow control and wider control for both speed limit conditions combined.
Mean Lateral Position As shown in Figure 4.4, the Drenthe PCM resulted in mean lateral positions closer to the centreline than the wider control road, as was also found by De Waard et al. (1995) and Van der Horst and Hoekstra (1994). Lateral positions were also closer to the centreline for the average of the four roads with narrower lanes than wider lanes. These findings sugges that participants shifted their lateral positions during the Drenthe PCM probably because o the reduced lane width rather than because the edgeline had a rumble aspect.
23
Lateral Position (m)
1.6 1.5 1.4 1.3 1.2 1.1
Drenthe Treatment
Figure 4.4:
Narrow Lanes
Wider Control
Treatments
Lateral placement (metres from the car centre to the inside edge of the centreline), (±SE) on the Drenthe treatment road, the four narrow lane roads, and the wider control road
The lateral placement results suggest that the Drenthe treatment will shift vehicles closer to opposing traffic compared to the wider control road. Accounting for the 20 cm difference in width between the treatment and control centreline widths and assuming that traffic in both lanes drive in the same relative lateral positions, opposing traffic on the Drenthe PCM road would be 16 cm closer than the wider control road. This may have negative consequences by increasing the potential for head-on crashes.
Standard Deviation of Lateral Placement (m)
Driver Workload There was no significant difference in the lateral deviations between the Drenthe PCM road and the wider control road. However, both De Waard et al. (1995) and Van der Hors and Hoekstra (1994) found smaller lateral variation occurred on the Drenthe PCM road than the wider control road. There were also no lateral deviation differences between the Drenthe treatment and the other narrow roads with the same lane widths. These results can be seen in Figure 4.5. 0.18
Curves
0.17
Straights
0.16 0.15 0.14 0.13 0.12 0.11 0.10
Drenthe Treatment
Narrow Lanes
Wider Control
Treatments
Figure 4.5:
Lateral deviations (±SE) on the three treatment roads and narrow control road, for the two speed limit conditions
As was found by De Waard et al. (1995), there was no difference in the steering deviations between the Drenthe treatment road and the wider control. However, as can be seen in Figure 4.6, the four narrow lane roads did receive more steering effort than the wider control road, and moreover, the average of the three treatment roads received more steering effort than the control road with the same lane width. The same level of steering effort was found for the Drenthe treatment road and the other two treatment roads. Therefore, it appears that participants increased the level of attention they gave to steering for narrower lane widths and treatment lane delineation in general, but were not specifically influenced by whether the lane delineation was rumble against what had been predicted due to the discomfort of traversing the gravel edgelines.
24
Standard Deviation of Steering Wheel Movements (degrees)
3.1 2.9 2.7 2.5 2.3 2.1 1.9 1.7 1.5 Treatment roads
Same Width Control
Wider Control
Treatments
Figure 4.6:
Steering deviations (±SE) for the three treatment roads, the same width control road, and the wider control road.
Despite the steering effort results, performance on the secondary task indicated that the gravel edgeline treatments demanded a higher level of mental workload than the treatment with the painted edgelines. That is, there is some evidence that participants concentrated more on the driving task when the gravel edgelines were present. This can be seen in Figure 4.7.
Reaction Time (msec)
1000
Speed Limit
900
80 km/h
800
110 km/h
700 600 500 400 300 Drenthe Treatment
Painted Edgeline
Treatment Roads
Figure 4.7:
4.1.4
Reaction time (±SE) to the secondary calculation task.
Conclusions
In conclusion, the current experiment suggests that: •
The Drenthe PCM reduced travel speeds by 1.88 km/h (compared to a wider control road), similar to what had been previously found in the Netherlands. This was found in the absence of speed limit reminders (unlike in the Netherlands).
•
Mean lateral positions were closer to the opposing traffic on the Drenthe PCM road, potentially increasing the chance of a head-on accident.
•
The origin of the speed reduction found is not obvious from the workload results. However, it appears likely that both lane width reduction and the inclusion of a gravel edgeline were important contributors to the speed reductions found.
Therefore, the contribution towards speed reductions from the various aspects of the Drenthe PCM need to be systematically investigated in order to determine why the treatment reduces travel speeds and how PCMs can be designed to obtain maximum speed reductions. This issue was addressed in Experiments 5 and 6.
25
4.2
EXPERIMENT 5: MEDIANS AND LANE WIDTH AS PERCEPTUAL COUNTERMEASURES
4.2.1
Background
From the findings of Experiment 4, it appears that the technique of lane width narrowing (real or perceptual) may have a potential to reduce travel speeds. However, the idea circumstances required for perceptual lane width reductions to be able to influence driving behaviour have not yet been fully defined. In evaluating the Drenthe PCM, Experiment 4, De Waard et al. (1995), Van der Horst and Hoekstra (1994), and Steyvers (1998) showed that narrow perceptual lanes can reduce speeds when combined with rumble edgelines and centreline. Thus, to further this knowledge, the issues of reducing the width of perceptua lanes without rumble lane delineation and with partial rumble delineation was investigated in Experiment 5. Three lane widths were evaluated, 3.6 m, 3.0 m, and 2.5 m. The Drenthe PCM lane was 2.25 m wide. However, in Australia, such a narrow lane would be difficult to implement on public roads due to concerns about wide vehicles. Thus, 2.5 metres was used as the minimum width as it is a more realistic lane width that could potentially be used in Australia. The 3.6 m lane width was used because it is a common lane width used in Australia. One method of perceptually reducing the lane width is by including wide medians to occupy some of the available lane width. This has the added benefit of further separating opposing vehicles. The influences of wide medians on driving, both independently of lane width and in conjunction with lane width reductions, were also investigated in the Experiment 5. Two perceptual medians, one painted and the other white gravel, were evaluated. These were designed to influence driving behaviour, independently of lane width, through speed perception enhancement and discomfort avoidance respectively. To influence speed perception, the painted median used a hatched design (i.e. closely spaced diagonal parallel lines). An example can be seen on the left of Figure 4.8. To encourage discomfort avoidance behaviour, a gravel median was used, as seen on the right of Figure 4.8. That is, as with the Drenthe PCM in Experiment 4, the rumble nature of the median may encourage drivers to avoid discomfort by devoting more attention towards lateral control, and then reducing speed as compensation.
Figure 4.8:
4.2.2
The narrow (2.5 metre) perceptual lane width roads with a median containing painted hatching (left) and white gravel (right).
Method
Experiment 5 involved driving the simulator on 100 km/h speed limit two-lane rural roads that included straight sections, right curves, and left curves (the latter two with a radius of curvature of 1000 metres). After initially driving at 100 km/h, participants drove through various experimental lane delineation patterns without access to the speedometer. After
26
driving through each treatment or control, participants completed the NASA-TLX subjective workload questionnaire. Every participants was presented with all seven treatment and control roads outlined in Table 4.2. Each pattern was situated over a 4 km distance on separate driving routes. The specifications of these roads are presented in Appendix D. Table 4.2: Treatments and controls used in Experiment 5 Wide (2.3 m) painted hatched median with a narrow (2.5 m) perceptual lane width Wide (2.3 m) white gravel median, with a narrow (2.5 m) perceptual lane width Narrow (1.3 m) painted hatched median with a medium (3.0 m) perceptual lane width Narrow (1.3 m) white gravel median, with a medium (3.0 m) perceptual lane width Control road with a narrow (2.5 m) lane width Control road with a medium (3.0 m) lane widt Control road with a wide (3.6 m) lane width The dependent variables measures were mean speed, mean lateral position, lateral variation, steering control, and subjective mental workload. Except for the subjective ratings, these variables were measured separately for the straight sections, left curve and right curves. 4.2.3
Results
Lane Width Reducing the perceptual lane width from 3.0 m to 2.5 m significantly reduced travel speeds by 2.23 km/h. However, as can be seen in Figure 4.9, this di not occur when the lane width was reduced from 3.6 m. 104
Speed (km/h)
102 100 98 96 94 92 Wide
Medium
Narrow
Lane Width
Figure 4.9:
Mean speed (±SE) for the wide (3.6 m), medium (3.0 m), and narrow (2.5m) lane widths.
As the lane width was reduced from 3.6 m, to 3.0 m, and then to 2.5m, lateral deviations were reduced (indicating that variation within the lanes reduced), and steering deviations increased (indicating that there were more steering wheel movements, that is, more effor was directed towards steering). Steering effort particularly increased during the curves. These findings can be seen in Figure 4.10.
27
3.0
Straights
2.5
Curves
Standard Deviation of Steering Wheel Angle
Standard Deviation of Lateral Placement
0.20 0.18 0.16
2.0
0.14
1.5
0.12
1.0
0.10 Wide
Medium
Narrow
Wide
Figure 4.10:
Medium
Narrow
Lane Width
Lane Width
Lateral position deviations (left) and steering deviations (right) for the wide (3.6 m), medium (3.0 m), and narrow (2.5 m) lane perceptual widths.
NASA-TLX Subjective Workload
Moreover, as seen in Figure 4.11, the subjectively experienced mental workload (from the NASA-TLX) also increased with decreasing lane width, suggesting increasing difficulty. 40 35 30
Control Median strips
25 20 15 10 Wide
Medium
Narrow
Lane Width
Figure 4.11:
Subjective workload ratings of the NASA-TLX. for the three lane widths (3.6 m, 3.0 m, & 2.5 m) and control and median strip roads (Min = 0, Max = 100).
The above three findings suggest that more effort was given to lane keeping behaviour. Thus, it would appear that to reduce the workload involved with driving in the narrowest lane, speed was reduced. Importantly, the findings of the current experiment also sugges that for this effect to occur, rumble delineation is not needed. Medians The use of wide medians produced fewer behavioural changes than the lane width reductions. The addition of a median (rather than the standard centreline), induced slower speeds on the right curves by 1.04 km/h, but not the left curves, nor the straight road sections, as can be seen in Figure 4.12.
28
Left Curves Right Curves Straights
Speed (km/h)
104 102 100 98 96 94 92 Control
Median Strip
Median Strip Condition
Figure 4.12:
Mean speed (±SE) for the control roads (standard centerline) and the roads with medians (averaged across the medium and narrow lane widths).
The mean lateral position of the car was closer (by 2 cm) to the edgeline during the curves when a median was present, but further away on straight sections than with the standard centreline (by 1 cm). No other statistically significant influences of the presence of a median were found. Notably, it did not influence lateral deviations nor steering control behaviour.
Speed (km/h)
Driving speeds were found to be slower with the hatched medians than the plain white gravel medians, but mainly on the straight road sections (by 3.08 km/h) and less so on curves (by 1.5 km/h). This can be seen in Figure 4.13. This was probably due to the influence on speed perception through drivers’ peripheral vision. This can be concluded with some confidence because the median pattern did not influence any other aspects o driving. 104
Straights
102
Curves
100 98 96 94 92 Control
Gravel
Hatched
Median Strip Condition
Figure 4.13:
4.2.4
Mean speed (±SE) for the three median/centreline conditions.
Conclusions
From the results of the present experiment, the delineation pattern with the most potential for reducing travel speeds whilst increasing road safety was the 2.5 metre wide perceptua lane width road with the 2.3 metre wide hatched median. This combination was an effective PCM for a number of reasons: •
The narrow perceptual lane increased the amount of effort devoted towards steering, resulting in less lateral position variability and slower speeds.
29
•
Rumble lane delineation does not seem to be needed for narrower lane width to lead to speed reductions. That is, the white gravel median did not produce any safety benefits.
•
The hatched pattern of the median probably enhanced speed perception on straight road sections (through extra stimulation of peripheral vision), leading to greater speed reductions than non-hatching medians.
Therefore, the present experiment demonstrated that a wide hatched median in conjunction with a 2.5 metre lane width should be an effective PCM if it was used on real roads. This combination was therefore chosen for further evaluation in Experiment 6. 4.3
EXPERIMENT 6: EDGELINES AND THE SURROUNDING ENVIRONMENT
4.3.1 Background Experiment 6 explored the speed reduction effectiveness of two edgeline designs on roads that have already been shown to reduce speeds through a 2.5 metre perceptual lane width and a hatched median. The first of these was a wide (85 cm) chequered pattern, seen on the left side of Figure 4.14. This is considerably wider than previous evaluations of wider edgelines which have generally only been up to 20 cm wide. It was considered that the width of this edgeline, as well as its visual streaming properties, may affect drivers speed perception and so lead to slower travel speeds. The second edgeline treatment involved the rumble edgeline from the Drenthe Province PCM. This edgeline treatment in conjunction with the hatched median can be seen on the right side of Figure 4.14. This edgeline was implicated as a contributor towards the speed reductions found in investigations of the Drenthe PCM by De Waard et al. (1995) and Steyvers (1998). However, these studies did not investigate the effects of this edgeline independently from lane width reductions, centreline manipulations, and speed limit reminders. Therefore, these were kept constant in the present experiment which investigated whether this edgeline influences driving, and in particular driving speed, through its rumble aspects and/or its low visual contrast.
Figure 4.14:
The chequered edgeline treatment road in the rural environment (left) and the Drenthe PC edgeline with the hatched median in the walled/industrial environment (right).
Experiment 6 also investigated the issue o road surroundings for their contributi towards the speed reduction effectiveness of PCMs. It examined whether the speed reduction effectiveness of PCMs depended on whether the road was surrounded by a wall (consisting of factories spaced close to the road) or an open, flat, and rural road-side. The results of this manipulation were planned to be used for helping to establish the best
30
location for these and similar PCMs on public roads. For this comparison, both edgeline treatment roads and a control road were evaluated with both open surroundings (farming paddocks) and walled surroundings (factories). An example of the open surroundings can be seen on the left of Figure 4.14, and an example of the walled environment can be seen on the right of the same figure. 4.3.2
Method
Experiment 6 involved driving on roads that included straight sections, left and right curves that were either surrounded by factories or by open rural land. All roads contained a 1.3 metre wide hatched median and a perceptual lane width of 2.5 metres. However, the edgeline varied between each road with the treatment and control edgelines as listed in Table 4.3. All participants drove on all six roads. The specifications of these roads is presented in Appendix E. Following each drive, participants completed the NASA-TLX subjective workload questionnaire. Table 4.3: Treatment and controls used in Experiment 6 Road-side surroundings
Edgeline (all roads included a hatched median and 2.5 m lane width).
Open (rural)
Standard 10 cm wide continuous white edgeline White painted chequered edgeline 85 cm wide Drenthe PCM edgeline (low visual contrast gravel chippings)
Walled (industrial)
Standard 10 cm wide continuous white edgeline White painted chequered edgeline 85 cm wide Drenthe PCM edgeline (low visual contrast gravel chippings)
Dependent variables were the same as Experiment 5. 4.3.3
Results
Drenthe PCM edgeline Speeds on the Drenthe PCM edgeline road were slower on the straight sections than the two painted edgeline roads (chequered and control), but were very similar during the curves. This can be seen in Figure 4.15. 104
Straights
Speed (km/h)
102
Curves
100 98 96 94 92 Control
Chequered
Drenthe
Edgeline
Figure 4.15:
Mean speed (±SE) for the control, chequered, and Drenthe edgeline treatment roads for the straights and curves.
More lateral variation, indicating lateral control was more difficult, was found during the straight road sections on the Drenthe PCM edgeline road than the average of the two 31
Standard Deviation of Lateral Position (m)
0.20
Straights
0.18
Curves
0.16 0.14 0.12
Standard Deviation of Steering Wheel Angle (degrees)
painted edgeline roads, but not during the curves. This can be seen on the left of Figure 4.16. Participants also exerted more steering effort (higher steering deviations) during the straight road sections for the Drenthe PCM edgeline road compared to the average of the two painted edgeline roads, but not for the curves. This can be seen on the right of Figure 4.16.
0.10 Control
Chequered
4.00
Straights
3.50
Curves
3.00 2.50 2.00 1.50 1.00 Control
Drenthe
Edgelin
Figure 4.16:
Chequered
Drenthe
Edgelines
Lateral deviations (left) and steering wheel deviations (right), (±SE) for the three roads across the straights and curves.
Therefore, these findings suggest that the low contrast nature of the Drenthe edgeline increased the difficulty of lateral control when the edgeline was perceived through peripheral vision (i.e. on straight road sections). This agrees with the hypothesised influence of the edgeline’s low visual contrast with the road. This seems to be the main speed reducing aspect of this edgeline. That is, the speed reductions found for this edgeline on straight road sections were a result of more difficult lateral control due to the edgeline’s low contrast. There was no evidence that the Drenthe PCM edgeline encouraged more attention to be given to steering and lateral control when lane keeping was at its most difficult (during the curves). This is opposite to what was predicted in that it was considered that greater steering effort may have led to speed reductions, but this was not found.
Lateral Placement (m)
Vehicle positions on the roads with the Drenthe PCM edgeline were further from the edgeline on the curves than in the straight road sections, but this was not so with either of the two painted edgeline roads. This can be seen in Figure 4.17. This finding agrees with the prediction that through discomfort avoidance, the Drenthe edgeline would lead to vehicles being positioned further from the rumble edgeline on curves (when driving over the edgeline should be more difficult to avoid). Thus, it appears that rather than increasing steering effort to avoid the rumble edgeline, participants simply shifted their mean latera position away from the edgeline (towards the centre of the road) during the curves but not so on the straight road sections. 1.27
LaneCentre
1.17 1.07
Straights
0.97
Curves
0.87 0.77 Control
Chequered
Drenthe
Tyres meet edgeline
Edgelin
Figure 4.17:
Mean lateral position (metres from the car centre to the inside edge of the edgeline), (±SE) for the control, chequered, and Drenthe edgeline treatment roads for the straights and curves.
32
Chequered edgeline Driving speeds (seen in Figure 4.15) on the chequered edgeline road were not different to the control road, suggesting that it did not enhance speed perception beyond what could be achieved using the hatched median. Lateral positions were marginally further from the inside edge of the chequered edgeline than they were for the control edgeline. More effort was directed towards steering (higher steering deviations) on the roads with chequered edgeline than the control edgeline road, especially during the straight road sections. The chequered edgeline road was rated as producing a higher mental workload and being more riskier than the road with the control edgeline. However, the presence of this wider edgeline did not influence lateral control. These results suggest that the chequered edgeline may have made the definition of the lane boundary less clear, causing participants to drive further from the edgeline, concentrate more on steering, but not achieve smaller latera deviations because lateral control was more difficult. Road surroundings Driving speeds were 2.45 km/h slower on the walled industrial roads than the open rural road, as seen in Figure 4.18. The mean lateral positions of participants were further from the edgeline on the walled (industrial) roads than on the open rural roads, especially on the straight road sections. The walled industrial roads were rated as more difficult to drive on, than the open rural roads. These results are similar to those found by Fildes, Fletcher and Corrigan (1987).
Speed (km/h)
104
Rural (open)
102
Industrial (walled)
100 98 96 94 92 Control
Chequered
Drenthe
Edgeline
Figure 4.18:
Mean speed (±SE) for roads with the three edgeline types for the rural and industrial surroundings.
Experiment 6 was specifically designed to determine if edgelines, in addition to the control PCM design with the hatched median, were more, or less, influential on drivers in a walled road-side rather than an open environment. In this regard, there was no evidence tha participants reacted to the evaluated edgelines differently in any way depending on the road surroundings. This suggests the edgelines did not influence drivers differently in the two environments. 4.3.4
Conclusions
The findings of the current experiment suggest that: •
The Drenthe PCM edgeline was successful in slowing travel speeds on the straight road sections only. Consequently, it can be concluded that the main influence this edgeline had on drivers was through its low visual contrast with the road surface, making lateral control more difficult on straight road sections, subsequently leading to slower speeds.
33
•
The rumble aspect of the Drenthe PCM edgeline did not seem to encourage greater lateral control or slower speed. Instead, participants strategically avoided traversing the rumble edgelines during the curves by shifting their lateral position away from the edgeline.
•
The wide chequered edgeline did not lead to reduced speeds. Thus, from the evidence available, such an edgeline as this cannot be recommended for use as a PCM.
•
Using a walled road-side did lead to slower driving speeds than the open road environment, as had been shown in previous studies.
•
When the speedometer is not available to drivers, such PCMs based on edgelines will not differentially affect drivers depending on the road-side conditions. If the speedometer was available, however, one can speculate from the findings of the presen experiment (of increased workload and riskiness ratings during the walled roads) that different levels of speedometer viewing may have resulted.
4.4
SUMMARY OF EXPERIMENTAL FINDINGS OF PCMs FOR CONTINUOUS DRIVING
From the three experiments reported in this chapter, several conclusions regarding PCMs for continuous roads can be reached. A narrow perceptual lane width appears to have grea potential for reducing travel speeds. Such a lane would be recommended to be narrower than 3.0 metres. Furthermore, if a wide painted median is the method used for reducing this lane width, head-on accidents should also be reduced. If the edgelines are shifted further from the road edge as well, accidents should further be reduced. A hatched median may lead to further speed reductions in addition to those provided by reductions in lane widths. However, using gravel lane delineation with a reduced perceptual lane width, either in a median or the edgelines, will probably not produce any greater reductions in travel speed than a reduced perceptual lane width alone. Specifically, the Drenthe PCM edgeline, independently from the other aspects of the Drenthe PCM (2.25 m lane width and a wide gravel edgeline), appears to have limited potential for the basis of a PCM. Finally, the visual pattern used within edgelines appears to have considerably less influence on drivers than medians.
34
5.
CURVE ENHANCEMENTS AS PERCEPTUAL COUNTERMEASURES
Under certain circumstances, road curves can appear to be less curved than they really are, thereby causing drivers to enter then at inappropriately high speeds (Fildes, 1986). Curve enhancements set out to offset these illusions and ensure that drivers adopt more suitable approach and entry speeds into these curves. It is expected that this strategy will have road safety benefits in reduced crashes at these locations. This issue was addressed in Experiment 7. 5.1
EXPERIMENT 7: CURVE ENHANCEMENT
5.1.1
Background
Rockwell, Malecki and Shinar (1975) applied a painted line treatment to the inside edge o a rural road curve to accent the inside perspective angle and increase perceived curvature. An example from a driver’s view can be seen in the left portion of Figure 5.1, and from a plan view on the left of Figure 5.2. They found that this treatment resulted in a reduction in speed in the approach to the curve, but not during the curve itself. Experiment 7 set out to further evaluate this treatment using the driving simulator. To specifically decipher the influence the hatching was having on drivers (that is, through the change in curve direction or just through the actual presence of the hatching), driving performance during this curve was contrasted to driving on a curve that had hatching on the outside of the edgeline. Furthermore, the above concept of changing the direction of the inside curve through hatching curve was also evaluated for the outside of a curve. This was achieved by applying hatching on the centreline.
Figure 5.1:
Treatments for Experiment 7, the inside hatching (left), and reflector posts with diverging lateral positions on both sides (right).
Hungerford and Rockwell (1980) used post delineators to create “positive perceptua illusions” on rural curves. The posts were placed in an ascending laterally diverging system, with the height increasing from ground level to 10 feet and the lateral placemen increasing from 0 to 20 feet. This arrangement was designed to create the perceptua illusion of the curve being tighter than it was in reality, thus inducing safer curve negotiation as a result. Examples of this treatment can be seen on the right of Figures 5.1 and 5.2. Hungerford and Rockwell (1980) showed slides of this arrangement and other delineation systems to subjects, who were asked to rate the perceived sharpness of the curve. The ascending in/out system was perceived by subjects to make the curve tighter than it was in reality. The ascending in/out treatment and other delineation systems were then applied to several rural curves in Ohio. The ascending laterally diverging post
35
delineator system was found to produce a reduction of velocity in the approach zone of the curve. This result was most evident in high speed drivers. The treatment also produced a visual shift to the right by drivers in general
Figure 5.2:
Treatments for Experiment 7, the inside hatching (left), and reflector posts with diverging lateral positions on both sides (right).
Hungerford and Rockwell’s (1980) curve enhancement techniques were also evaluated in Experiment 7. For those treatments, the posts on the outside of the curve increased in height with varied lateral placement while the posts on the inside of the road were in a standard configuration. This was compared to a similar treatment which had the laterall diverging/converging posts on the outside of the curve without any height variation. A third alternative treatment varied the lateral placement of the posts on both sides of the road. All of these treatments were compared to a control road that contained a standard configuration of posts (see Table 5.1). 5.1.2
Method
Participants drove on 100 km/h speed limit rural roads that included straight sections and curves. Every participant drove through each of the nine curves appearing in Table 5.1 twice, once as a left curve, and once as a right curve. The curves had an angle of 28.7 degrees, a radius of curvature of 1000 metres, and a length of 500 metres. Specifications o the treatments appear in Appendix F. The inside edge of the curve represents the closes edge to the driver when completing a left curve (and furthest edge for a right curve), whilst the outside of a curve represents the further edge for a left curve (and the closest edge for a right curve). This experiment was divided into the three curves presented in Table 5.1. The first two curves consisted of treatments with hatching, whilst the final curve utilised post delineators.
36
Table 5.1: Curve Enhancement Treatments used in Experiment 7 Curve
Treatment
Curve 1: 3.4 metre lane widths 55 cm hatching
Control (3.4m lane width) Inside Hatching (55cm) Centreline Hatching (55cm) Inside Road Shoulder Hatching (55cm)
Curve 2: 3.5 metre lane widths 35 cm hatching
Control (3.5m lane width) Inside Hatching (35cm) Centreline Hatching (55cm) Inside Road Shoulder Hatching (55cm)
Curve 3: 3.5 metre lane widths
Standard Reflector Posts on both sides of road Lateral Placement Posts treatment on Outside of curve Lateral Placement Posts treatment on Both Sides of road Lateral Placement Posts treatment on Outside of curve tha also Ascend in height
For the analyses, the curves were divided into four 100 metre sections, representing 100 metres before the curve, and the first three 100 metre sections of the curve. The final 200 metres of the curves were not included in the analyses. Two dependent variables were analysed, mean speed and mean lateral position. 5.1.3
Results
55 cm hatching & 3.4 metre lane width There were no statistically significant speed differences at all between the four roads evaluated for both the left curve and right curve. These null-results can be seen in Figure 5.3. Centre Control Inside Shoulder
98 96 Speed (km/h)
94
98 96
92
94
90
92
88 86
Centre Control Inside Shoulder
90
84
88
82
86
80 Pre-curve
1st 100
2nd 100
Pre-curv
3rd 100m
Location during the Left Curve
Figure 5.3:
1st 100m
2nd 100m
3rd 100m
Location during the Right Curve
Mean speed (±SE) for the inside curve (left) and outside curve (right) with 55 cm hatching (and 3.4 metre lane width).
As would be expected, the mean lateral positions followed the path of the lane. Thus, for the left curve, the two inside edge hatching, lateral positions were further from the edgeline than for the centre hatching treatments. However, this did not differ between the inside lane and shoulder hatching, suggesting the presence of the hatching is as much of an influence as their position relative to the driving lane. For the right curve, the centre and inside hatching curves encouraged similar lateral positions due to the same lane path, bu the inside shoulder hatching had no effect whatsoever on lateral position.
37
35 cm hatching & 3.5 metre lane width For the curve with the narrower hatching, when travelling through the left (inside) curve, participants travelled 2.7 km/h faster when there was hatching on the inside of their lane or between the left shoulder and edgeline than when the road had a centreline hatching or no hatching at all. This can be seen on the left of Figure 5.4. Thus, the inside hatching treatments had the opposite effect than was intended, that is, they caused drivers to increase their speed. The right curve treatments had no influence on speed as can be seen in the right portion of Figure 5.4. Centr Control Inside Shoulder
100 98 96 94 92 90 88 86 84
96 94 92 90 88
Centre Control Inside Shoulder
86 84
Pre-curve
Figure 5.4:
1st 100m 2nd 100m Location during the Left Curve
3rd 100m
Pre-curve
1st 100m
2nd 100m
3rd 100m
Location during the Right Curve
Mean speed (±SE) for the inside curve (left) and outside curve (right) with 35 cm hatching (and 3.5 metre lane width).
Lateral positions followed the driving lane in the same way as they did for the 3.4 metre lane width curve above. Reflector Posts For the left curve, the only significant speed difference was that the curve with the posts on the outside of the curve with diverging lateral positions encouraged slower driving by 3.2 km/h than the curve with posts on both sides of the road with diverging lateral positioning. This can be seen in Figure 5.5. Importantly, however, it can also be seen that the ascending posts (positioned in the same way as the outside posts) had a very similar (although no statistically different) speed profile to that for the outside posts alone. Ascending Outside Both Sides Control Outside
100 98 96 94 92 90 88 86 84 Pre-curve
1st 100m
2nd 100m
3rd 100m
Location during the Left Curve
Figure 5.5:
Speed (±SE) on the left (inside) curve ith reflector posts.
For the right curve, driving speeds wit diverging lateral positions and ascending in height were slower by 3.5 km/h than the curve with the posts on the outside of the curve with diverging lateral positioning. This can be seen in Figure 5.6. Moreover, the ascending posts treatment led to average lateral positions of drivers closer to the centreline (and further from the posts) by 7 cm during the right (outside) curve compared to the non-ascending
38
posts on the outside of the curve with the same positioning. Therefore, it is possible that this treatment curve does appear sharper than it really is to drivers, causing them to alter their lateral positions away from the edgeline (for right curves), as well as encouraging them to drive slower. 98 94
Ascending Outside Both Sides Contro
92
Outside
Speed (km/h)
96
90 88 86 84 82 Pre-curv
1st 100m
2nd 100m
3rd 100m
Location during the Right Curve
Figure 5.6:
Speed (±SE) on the right (outside) curve with reflector posts
Therefore, the curve with the reflector posts with the diverging lateral positioning on the outside of the curve appeared to be beneficial for speed reductions when drivers were on the inside of the curve, but encouraged faster speeds when drivers were on the outside of the curve. However, the posts that ascended in height as well as varying laterally did no affect participants’ driving speed differently to the above non-ascending and diverging posts for the inside curve, but led to slower speeds than them on the outside curve. This also agrees with the findings of Hungerford & Rockwell (1980). Furthermore, lateral positions were further from the road’s edge for the ascending posts treatment on the outside of the curve, suggesting that there would be a lower chance of drivers running off the road. Therefore, it appears that the ascending posts with the diverging lateral positions on the outside of the curve should be beneficial for both the inside and outside curve. 5.1.4
Conclusions
In conclusion, Experiment 7 demonstrated that: •
Using hatching on curves to slow drivers appears not to be very useful. •
When the hatching was 55 cm wide at its maximum, it had no effect on speeds.
•
When the hatching was 35 cm wide at its maximum, it encouraged faster driving when placed in the drivers side of the road during inside curves.
•
The use of special reflector posts that are ascending and are placed a diverging lateral positions as they approach the middle of the curve does seem to have a potential to slow driving speeds for driving on both sides of the road.
•
Other reflector post combinations were not generally conducive to slower driving.
39
6.
GENERAL DISCUSSION
The aim of this stage of the project was to evaluate a representative range of perceptua countermeasures to speeding (PCMs) in order to provide recommendations for their use on public roads. An experimental program was undertaken using the TAC driving simulator located at the Monash University Accident Research Centre where a range of PCMs were systematically tested using samples of experienced drivers. The findings from this research program are summarised in the below tables and are discussed in terms of the category of measures tested. Only statistically significant findings are reported as having an “effect” in these tables, whilst apparent differences that were found to be non-significant are reported as “no effect”. 6.1
TREATMENTS FOR DECELERATING TOWARDS A HAZARD
Three experiments were conducted to evaluate various forms of PCMs that are intended to influence speed behaviour on the approach to an intersection or road hazard. These treatments are shown in Tables 6.1 and 6.2. 6.1.1
Transverse Lines & Similar Treatments
Results from the first experiment demonstrated that transverse lines can be effective in reducing speed on the approach to an intersection by up to 11 km/h. It was argued that while this was partially due to the alerting properties of the lines, the main speed reduction effect was from changes in drivers’ speed perception. If so, then this would suggest that transverse lines should be effective PCMs on public roads in the long term. The spacing scheme of the lines did not appear to influence speed perception, suggesting that the usua decreasing spacings used previously in the UK (e.g., Denton, 1976; Helliar-Symons, 1981) is not necessary. Furthermore, transverse lines appeared slightly more effective at reducing speeds after continual driving (which was expected to produce conditions similar to speed adaptation). However, they were also effective at reducing speeds after normal driving. Table 6.1: Summary of results for transverse line treatments Treatment
Size Effect*
Transverse lines – decreasing distances apart (over 400 metres)
speed reductions of up to 11km/h up to 100m before intersection.
Transverse lines – constant distance apart (over 400 metres)
the same as for decreasing spacings
Half Wundt (over 100 metres)
hint of slower speeds by 3.8km/h
* Size of the effect of the treated road compared with the relevant non-treated control road.
A variation of the transverse line pattern was also tested in this research, namely a half “Wundt” illusion pattern (chevron lines pointing towards the driver). In plan-view, the Wundt illusion appears to make the lane converge and it was thought that this would provide a useful addition to the effects previously reported for this treatment. The results did hint at a reduction in travel speed in the treatment area, although there was no evidence that the pattern gave drivers a lane narrowing perception.
41
6.1.2
Lane & Road Edge Treatments
The results from these experiment also demonstrated that transverse lines protruding 60 c from the lane edges (peripheral transverse lines) still resulted in significant speed reductions, albeit of a slightly smaller effect than full width transverse lines. As these lines have some added maintenance advantage over full lane width lines (less wear and tear due to less tyre contact), these could be a cheaper and desirable alternative in the long term. Koziol and Mengert (1977) had reported on the use of a “Herringbone” pavement marking system with increasing line frequency to reduce travel speed in the lead up to a roadside hazard. In plan-view, this pattern has the effect of making the road appear to become narrower as the lines increase in frequency. However, whether the effect translated to perspective view, commonly seen from the driving position of an automobile, had not been investigated. Indeed, Experiment 2 showed little evidence for this from a series of static computer tests. A number of variations of herringbone edgeline treatments were also evaluated in this research program, notably backward and forward displacement (pointing towards or away from the approaching vehicle) and increasing and constant line frequency. The findings from these evaluations are summarised in Table 6.2 below. Table 6.2: Findings for the lane & road edge treatments Treatment
Size Effect*
Peripheral Transverse lines (over 400 metres)
speed reductions of up to 6km/h.
Peripheral Herringbone – backward & decreasing (over 400 metres)
the same as for Peripheral Transverse lines
Peripheral Herringbone – backward & decreasing (over 100 metres)
speed reductions of up to 2km/h in treatment area
Peripheral Herringbone – backward & constant (over 100 metres)
the same as for backward & decreasing spacings & 100m
Peripheral Herringbone – forward & decreasin (over 100 metres)
the same as for backward & decreasing spacings & 100m
Trees – decreasing spacin (over 400 metres)
No speed differences with controls
* Size of the effect of the treated road compared with the relevant non-treated control road.
The herringbone treatments, overall, did appear to cause some speed reductions, although not as powerful as the full-width transverse line patterns. Importantly, there was no suggestion of any added benefit for the decreasing pattern over the constant one. Moreover, while the backward pattern in plan-view does gives the impression of narrowing road, this had no influence whatsoever to drivers’ speed behaviour when viewed in perspective. Placing trees on the side of the road with decreasing spacing on the approach to an intersection was considered to be a possible low cost substitute for edgeline treatments. However, as shown in Table 6.2, they di not reduce travel speed throughout the treatmen area, and do not appear to be a viable alternative to edgeline treatments. Indeed, these results confirm the earlier findings by Fildes, Leening and Corrigan (1989) who argued
42
that the road surface had a much stronger influence on a driver’s speed behaviour than the surrounding terrain. 6.2
TREATMENTS FOR ROADS WITH CONTINUOUS DRIVING
The second category of PCMs evaluated were treatments that were designed for roads that involved continuous driving, including straight roads and winding roads. Such treatment would be most suitable for rural roads. 6.2.1
The Drenthe Treatment
As noted earlier, the Drenthe treatment from the Netherlands was developed as a speed reduction measure for use on rural roads. While this treatment had been fairly widel evaluated in that country (Van der Horst & Hoekstra, 1994; De Waard, et al., 1994; Steyvers, 1998), it was considered important to include it in this research program also for comparison. The findings for variations of the Drenthe treatment from this research are shown in Table 6.3. Table 6.3: Summary of findings for variations of the Drenthe treatment Treatment
Size Effect*
Drenthe standard treatment
speed reductions of 1.9km/ lateral position 16cm closer to opposing traffic
Drenthe with painted edgelines (no gravel)
no speed reduction
Drenthe with continuous edge and centrelines
no speed reduction
* Size of the effect of the treated road compared with the relevant non-treated control road.
The first application of the Drenthe Province treatment was the standard form developed in the Netherlands. This PCM involved a very narrow lane width (2.25 m), low contrast gravel edgeline, and a widened gravel centreline. The evaluation found promising results that corroborated earlier findings in the Netherlands. However, although speed reductions were clearly found to occur with this treatment compared to a wider control road, the experiment could not establish the origins of these speed reductions. That is, whether the were most from the reduced lane width, the gravel rumble of the edgeline, the low visua contrast of the edgeline, or the gravel rumble or width of the centreline. Variations of the Drenthe treatment, namely with painted edgelines and no gravel and with continuous gravel edgelines and centreline were further evaluated. Unfortunately, though, none of these variations produced significant speed reductions and were clearly inferior to the original treatment combination.
43
6.2.2
Centreline and Edgeline Treatments
Table 6.4: Summary of findings for the novel centre and edgeline treatments Treatment
Size Effect*
Median (gravel or painted/hatched)
Speed reduction of 1km/h on right curves only
Gravel median
no (additional) speed reduction
Hatched median
speed reduction of 3km/h on straight roads only
Hatched median & chequered edgelin
No speed reduction (cf. Hatched median alone)
Hatched median & Drenthe edgelin
speed reduction of 3km/h on straight roads only (cf. Hatched median alone)
*
Size of the effect of the treated road compared with the relevant non-treated or semi-treated control road with the same lane width.
The inclusion of a “perceptual” median instead of a standard centreline on a two-wa undivided roadway led to speed reductions of 1 km/h during right curves. There was no apparent speed reduction benefit for white gravel median strips over a painted median. This was somewhat surprising as previous reported findings suggested that this treatment would be effective (Fildes, et al., 1989). Of interest, though, previous applications of this treatment have been on urban roads and in collaboration with added edgeline treatments. As they were evaluated on a rural road setting here at relatively higher speeds, this might account for the lack of any effect. Nevertheless, the use of this treatmen should not be dismissed simply on the strength of the findings here. Hatched median strips, on the other hand, were successful in reducing average travel speeds by up to 3 km/h when used in this environment. This was even more apparent when used in walled environments, that is, when the roadside setting blocked peripheral visio and abutted the edge of the road, such as a forest or a close commercial setting. The use of the chequered edgeline pattern in conjunction with a hatched median did not lead to further speed reductions compared to roads with standard edgelines and the hatched median. In contrast, using the Drenthe (low contrast gravel) edgeline with the hatched median did produce further speed reductions on straight roads. However, in conjunction with this speed reduction, drivers’ lateral control appeared to be more difficult. 6.2.3
Perceptual Lane Width Reduction
It was also possible to examine the effects of different lane widths in the above evaluation, given that there were a range of lane widths (from standard 3.6m down to 2.5m). “Perceptual” lane width reduction refers to widening the median, widening or shifting the location of edgelines, or both, so that the driving lane is narrower but the width of the sealed road remains constant. As such, narrower perceptual lane widths should not increase accidents unlike narrower road widths.
44
The results showed that reducing the lane width below 3 metres to 2.5 metres led to significantly slower mean travel speeds of 2.2 km/h. Moreover, the narrow perceptual lane resulted in less lateral position variation suggesting an increased amount of effort by the driver in steering on these roads. While applications of narrow travel lanes will be somewhat limited to roads without wide heavy vehicles, it clearly would seem to have a role to play in certain environments. Using narrow perceptual lane widths in conjunction with wide hatched median strips was shown to be particularly successful in reducing speeds by 5 km/h compared to a 3.0 metre road without a median. 6.2.4
Road environment
Several edgelines were also contrasted in a closed industrial environment and an open rural environment. Although the closed environment led to slower driving speeds than the open environment as had previously been shown, the edgelines did not lead to statistically significant slower driving compared to the control edgelines in one environment compared to the other. Therefore, from this evidence, it has to be concluded that the effectiveness o PCMs as speed reducing treatments will probably not be influenced by the immediate road-side surroundings. 6.3
CURVED ROAD TREATMENTS
The last experiment in the series addressed low cost PCMs for use on horizontal road curves. These treatments either enhanced the centreline or edgelines with additiona markings or increased curvature information, or manipulated roadside post placement or post height in an attempt to evoke a perception of a tighter curve to offset any false perception of a more gentle curve. These false perceptions have been proposed to accoun for part of the over-involvement of crashes at road curves (Rockwell, Malecki & Shinar, 1975: Fildes, 1986). The findings from tests involving these treatments are shown in Tables 6.5 and 6.6. 6.3.1
Enhanced Edgeline & Centreline Treatments
Edgelines. Rockwell et al. (1975) first proposed an enhancement to the “inside perspective angle” of the curve when viewed in perspective to give the impression of a more steep curve. This was trialed at two levels of thickness (35cm and 55cm) to allow the treatment to be applied to a standard road surface of 7.4 metres. The findings summarised in Table 6.5 show that the enhanced edgeline either did not affec speed or actually increased mean travel speed by up to 2.7 km/h, rather than produce a decrease as expected. The type of curves used here may explain this somewhat surprising finding. The treatment may be more effective on curves with restricted sight distances tha seem to predominate in false curve illusions. In this experiment, however, it was applied to curves with relatively unrestricted sight distances, thereby enhancing the delineation of an otherwise veridical curve. Not surprising, then, drivers responded by increasing their speed because of the superior view on offer. Lateral position findings also confirmed a shift towards the centreline of up to 38cm with both edgeline and shoulder treatments. While any shift towards the centreline is undesirable in road safety terms, they were relatively small shifts compared with the control road travel path and never encroached onto the opposite lane. Nevertheless, this aspect of the treatment needs to be addressed in possible applications of any edgeline or shoulder enhancement.
45
Table 6.5: Summary of centreline and edgeline treatments from the curvature experiment Treatment
Size Effect*
Enhanced hatched edgeline (55cm)
No speed effect Lateral placement 38cm towards the centreline for L and 35cm for RH curves.
Enhanced hatched edgeline (35cm)
Speed increase by 2.7km/h on left curves No speed effect for right curves Lateral placement 25cm towards the centreline for L and 28cm for RH curves.
Enhanced hatched centreline (55cm)
No speed effect Lateral placement of 11cm towards the centreline for LH but up to 35cm away for RH curves
Enhanced hatched centreline (35cm)
No speed effect No lateral placement shift for LH curves but up to 22cm away from the centreline for RH curves.
Shoulder hatching (55cm)
No speed effect Lateral placement 23cm towards the centreline for L but 10cm away from centreline for RH curves.
Shoulder hatching (35cm)
Speed increase by 2.7km/h on left curves No speed effect for right curves (same speed results as inside hatching) Lateral placement 16cm towards the centreline for L but 7cm away from centreline for RH curves.
* Size of the effect of the treated road compared with the relevant non-treated control road. Shoulder hatching. A variation of the inside edgeline enhancement treatment was to hatch the shoulder area of the curve (between the inside of the edgeline and the edge of the paved surface). This seemed to be a cheaper alternative in that no change was required to the travel lane markings within the curve. The results in Table 6.5 showed that hatching the shoulder of the road (inside of the edgeline) also led to an increase in travel speed (by up to 2.7 km/h) for LH curves, but had little effect for RH curves. Lateral placement findings were similar to those for the enhanced edgeline treatment. While this might be a more practical treatment for enhancing the edgeline of road curves rather than the enhanced edgeline treatment, it clearly is not a speed reduction treatment when used on curves with normal sight distances. Centreline Hatching. A final variation of the on-road curvature enhancement measures was an enhanced centreline treatment, similar to that applied to the edgeline. This treatmen was intended to give the perception of a more curved roadway in the approach zone. The findings showed no speed reduction occurred. Lateral position was shifted towards the centreline by up to 11cm for LH curves but away from the centreline by up to 35cm for RH curves with this treatment. In short, centreline hatching does not appear to be a promising speed reduction treatment. Comment. The above treatments were applied to curves with normal, unrestricted sight distances, which may not be the most appropriate applications for them. It is conceivable that enhanced edgelines and shoulder hatching may be better suited to curves wit restricted sight distances (to enhance a bend in the road with limited curvature information present) but this requires further investigation.
46
6.3.2
Post Spacing and height
Manipulating the layout and height of the posts on the side of the road was also proposed by Hungerford and Rockwell (1980) as a treatment to enhance the apparent curvature of an approaching bend in the road. Three variations of this treatment were undertaken in the last simulator experiment: (i), an enhanced curvature layout to posts on both sides of the road, (ii), on the outside only, and (iii), on the outside only with an ascending post height from 1 to 2 metres from the start to the middle of the curve. These findings are summarised in Table 6.6. Table 6.6: Summary of post treatments from the curvature experiment Treatment
Size Effect*
Enhanced curvature posts – both sides
Speed increase by up to 1.5km/h for LH & no effect for RH curves. Lateral placement up to 8cm away from centreline for LH and no effect for RH curves.
Enhanced curvature posts – outside only
speed reduced by up to 1.5km/h for LH but increased by 2.1km/h for RH curves Lateral placement had no effect on LH but moved away from centreline up to 7cm for RH curves.
Enhanced curvature posts + ascending height on th outside of the curve only
speed decreased by up to 1.4km/h for both LH and RH curves. Lateral placement was up to 2cm away for RH with no appreciable effect at all for LH curves.
* Size of the effect of the treated road compared with a control road with standard reflector posts. Enhanced post layout on both sides of the curve lead to some speed increase on LH curves but with no noticeable effect for RH curves. Lateral position effects were marginal with a small shift away from the centreline on LH curves. For the enhanced post layout treatment on the outside of the curve only, speed reductions were observed for the left curve, but speeds were faster for the right curve, with little observable difference in lateral positioning. The enhanced post layout on the outside of the curve only but with ascending post height from 1 metre to 2 metres also resulted in some speed reductions (up to 1.4 km/h) for both the left and right curve. Again, there were little lateral position effects from these treatments. Comment. Thus, the most successful post treatment appears to have been an enhanced spacing of the post layout with the ascending post height to give the impression of exaggerated curvature on the outside of the bend alone. This was the only post treatment that led to slower speeds on both the left and right curves. These effects differ to those found by Hungerford and Rockwell (1980) who failed to find any appreciable benefit for novel post spacings.
47
6.4
PCM CONCLUSIONS
A number of promising treatments to reduce travel speed on highways were apparent from this research program. 1. Transverse lines in the approach to an intersection or hazard. •
Full-width speed reductions of up to 11 km/h in the pre-treatment area and into the treatment area as well.
•
Half Wundt and diminishing spacing effects were negligible.
2. Novel edgelines in the approach to an intersection or hazard. •
Similar benefit also for peripheral transverse lines and herringbone pattern (6 km/h) with less maintenance.
•
Diminishing line spacing seemed to result in slower speeds than constant spacings for this treatment.
•
Diminishing spacing trees on the side of the road had no speed reduction effects.
3. Drenthe Province treatment for use on continual roads. •
Standard Drenthe treatment produced moderate speed reductions (around 2 km/h) but vehicles moved 16cm closer to oncoming vehicles.
•
Painted or continuous gravel edgelines had little effect on travel speed but di adversely influence lane position.
4. Centreline and edgeline treatments as a continual road treatment. •
Hatched medians produced moderate speed reductions and separated the traffic on two-way undivided straight roads
•
Hatched medians with Drenthe edgelines led to even greater speed reductions than medians alone on straight roads.
•
Hatched medians with chequered edgelines had no speed reduction benefits over medians alone.
•
Walled environments produced speed reductions of around 5 km/h over spacious ones.
•
Gravel medians had no speed reduction benefits (although they would still have traffic separation benefits).
5. Perceptual lane width narrowing. •
Narrow lanes of 2.5 metres can reduce speeds by 2.2 km/h compared to a 3.0 metre lane width whilst maintaining or increasing the level of traffic separation (through use of painted medians). 48
6. Enhanced curvature of inside perspective edgeline and the centreline to give the impression of a more-curved bend in the road. •
Enhanced edgeline and shoulder hatching increased speeds and adversely shifted the vehicle closer to the centreline.
•
Enhanced centreline did not influence speed without any adverse lane position effects.
7. Enhanced curvature through reflector post spacing to give the impression of a morecurved bend in the road. •
Enhanced curvature post layout on the outside of the curve had speed reducti benefits on left curves only (with faster speeds on the right curve), also without adverse lateral position effects.
•
Enhanced curvature posts layout on the outside of the curve with ascending post height had speed reduction benefits for both left and right curves, although speed reduction on the left curve was considerably less than the above treatment.
•
Enhanced curvature posts on both sides of the road had no speed reduction benefits at all.
The selection of perceptual countermeasures for use on the road needs to take account o not only their potential speed benefits but also the practical realities that exist at the sites requiring treatment and the likely costs, benefits and maintenance needs. This will require additional judgment on the part of the Traffic Engineer when considering which treatment to use for a particular application. 6.5
RECOMMENDATIONS FOR FURTHER RESEARCH
A number of recommendations for additional research were highlighted during this research program which are detailed below. 1. There is a need to evaluate the effects of some of the more promising of these treatments on the road itself. While the simulator provided a suitable environment for testing their relative effects, the ultimate benefit of these treatments in terms o reducing travel speed and road crashes can only be firmly established on the road itself. This needs to consider both their immediate as well as long-term benefits. 2. There is a need to conduct a benefit-cost analysis for these treatments to justify the use of these low cost perceptual countermeasures. This was not possible using the performance data collected here and needs to be determined in conjunction with an onroad trial. 3. The resources available for the experimental program enabled a number of treatments to be evaluated in the driving simulator. The results of the research suggest that there could be some added benefit in examining further combinations of these treatments as well as others not tested here, namely: •
different combinations of median strips and edgeline treatment (for instance, hatched medians with herringbone edgelines, and gravel medians with different edgelines); 49
•
combinations of enhanced edgelines and post layout in curves (with both unrestricted and restricted sight distances);
•
to the degree possible, enhanced edgelines and wide medians in curves (this will not always be a possible option, especially on two-way undivided highways);
•
urban driving effects (most of the treatments were trialed in either rural or semirural environments with little opposing traffic present);
•
other potential curvature treatments, such as that developed by Agent and Crease (1986).
•
following distance chevrons.
50
7.
REFERENCES
AGENT, K. R., & CREASEY, T. (1986). Delineation of horizontal curves (Research Report UKTRP - 86 - 4). Kentucky, USA: University of Kentucky, College o Engineering, Kentucky Transportation Research Program. BURNEY, G. M. (1977). Behaviour of Drivers on Yellow Bar Patterns: Experiment on Alton By-Pass, Hampshire. (Supplementary Report 263). Crowthorne, Berkshire, U.K.: Transport and Road Research Laboratory. De WAARD, D., JESSURUN, M., STEYVERS, F. J. J. M., RAGGATT, P. T. F., & BROOKHUIS, K. A. (1995). The effect of road layout and road environment on driving performance, drivers’ physiology and road appreciation. Ergonomics, 38, 1395-1407. DENTON, G. G. (1976). The influence of adaptation on subjective velocity for an observer in simulated rectilinear motion. Ergonomics, 19(4), 409-430. FILDES, B. N. (1986). The Perception of Road Curves. Unpublished doctoral dissertation, Monash University, Clayton, Victoria, Australia. FILDES, B. N. & LEE, S. J. (1993). The Speed Review: Road Environment, behaviour, speed limits, enforcement and crashes. (Report CR 127). Canberra: Federal Office o Road Safety, Department of Transport & Communication. FILDES, B. N., & JARVIS, J. (1994). Perceptual Countermeasures: Literature Revie . (Report CR 4/94). Canberra: Federal Office of Road Safety, Department of Transport & Communication. FILDES, B. N., FLETCHER, M. R., & CORRIGAN, J. McM. (1987). Speed Perception 1: Drivers’ Judgement of Safety and Speed on Urban and Rural Straight Roads. (Report CR 54). Canberra, Australia: Federal Office of Road Safety. FILDES, B. N., GODLEY, S. T., TRIGGS, T. J. & JARVIS, J. (1997). Perceptual Countermeasures: Simulator Validation Study . (Report CR 169). Canberra, ACT: Federal Office of Road Safety HARMS, L. (1991). Variation in driver’s cognitive load. Effects of driving through village areas and rural junctions. Ergonomics, 34, 151-160. HART, S. G., & STAVELAND, L. E. (1988). Development of the NASA-TLX (Task Load Index): Results of the empirical and theoretical research. In P. A. Hancock & N Meshkati (Ed.s). Human Mental Workload. (pp. 139-184). North-Holland: Elsevier Science. HAWORTH, N. & RECHNITZER, G. (1993). Description of fatal crashes involving various causal variables. (Report CR 119). Canberra: Federal Office of Road Safety, Department of Transport & Communication. HAYS, W. L. (1973). Statistics for the Social Sciences (2nd ed.). New York: Holt, Rinehart & Winston.
51
HELLIAR-SYMONS, R. D. (1981). Yellow Bar Experimental Carriageway Markings Accident Study. (Report LR1010). Crowthorne, Berkshire: Transport and Road Research Laboratory. HUNGERFORD, J. C., & ROCKWELL, T. H. (1980). Modification of driver behaviour by use of novel roadway delineation systems. Proceedings of the Human Factors Society 24th Annual Meeting, 147-151. JARVIS, J. R., & JORDAN, P. (1990). Yellow bar markings: Their designs and effect on driver behaviour. Proceedings of the 15th ARRB conference, Part 7, 1-22. KOZIOL, J. S., & MENGERT, P. H. (1977). Evaluation of Speed Control Signs for Small Rural Towns. (Report no. DOT-TSC-FHWA-76-3). Cambridge, MA, USA: U.S. Department of Transport, Transportation Systems Centre. PYNE, H. C., CARSTEN, O. M. J., & TIGHT, M. R. (1995). Speed on rural Arterial Roads. Leeds, England: Institute for Transport Studies. ROCKWELL, T. H., MALECKI, J., & SHINAR, D. (1975). Improving Driver Performance on Rural Curves Through Perceptual Changes, Phase III . Project 428, Final Report. Systems Research Group, The Ohio State University, Columbus, Ohio. RUSSAM, K. (1979). Improving user behaviour by changing the road environment, The Highway Engineer, August/September, 18-24. SHINAR, D., ROCKWELL, T. H., & MALECKI, J. (1980). The effects of changes in driver perception on rural curve negotiation. Ergonomics, 23, 263-275. STEYVERS, F. J. J. M. (1998). Increasing safety removing visual cues - a contradiction In G. A. Gale, I. D. Brown, C. M. Haslegrave, & S. P. Taylor (Eds.), Vision in Vehicles VI (pp. 271-278). Amsterdam: Elsevier. TREAT, J. R., TUMBUS, N. S., McDONALD, S. T., SHINAR, D., HUME, R. D MAYER, R. E., STANISFER, R. L. & CASTELLAN, N. J. (1977). Tr-level study of the causes of traffic accidents. Volume 1: Causal factor tabulations and assessment. (NHTSA Report DOT-HS-805-085). Van der HORST, R., & HOEKSTRA, W. (1994). Testing speed reduction designs for 80km/h roads with a simulator. Proceedings of the Transportation Research Board 73rd Annual Meeting, Washington, DC. ZAAL, D. (1994). Traffic Law Enforcement: A Review of the Literature. (Report no. 53). Melbourne: Monash University Accident Research Centre.
52
APPENDICES APPENDIX A ................................ ................................ ................................ ....................... 54 APPENDIX B ................................ ................................ ................................ ....................... 56 APPENDIX C ................................ ................................ ................................ ....................... 58 APPENDIX D ................................ ................................ ................................ ....................... 60 APPENDIX E ................................ ................................ ................................ ....................... 62 APPENDIX F ................................ ................................ ................................ ....................... 64
53
APPENDIX Treatments Evaluated in Experiment 1
1.
Transverse lines occurring at exponentially decreasing distances apart (Figure A1a).
2. Transverse lines occurring at a constant distance apart (Figure A1a). 3. Peripheral transverse lines (occurring on the edges but not centre of the lane), a exponentially decreasing distances apart (Figure A1b). 4. Herringbone pattern with peripheral lines pointing backwards at exponentially decreasing distances apart (Figure A1c). 5. Trees occurring on the sides of the road at exponentially decreasing distances apar (Figure A1d). 6. Plain road control (Figure A1e).
54
a. Transverse lines 0.6 m Yellow Paint 2.5 m
b. Peripheral transverse lines
3.7 m 0.6 m 0.6 m
White Paint
0.6 m
c. Herringbone pattern
0.6 m
d. Edge of the road trees Shrubs/trees
5.0 m
e. Control road 1.3 m
3.7 m Gravel road shoulder
Figure A1:
Road treatments used in Experiment 1.
55
APPENDIX B Treatments Evaluated in Experiments 2 & 3
1. Herringbone pattern. Three variations of the herringbone pattern were used: i.
Herringbone pattern with lines pointing backward occurring at exponentially decreasing distances apart (Figure B1a).
ii. Herringbone pattern with lines pointing backward placed at a constant distances apart (Experiment 3 only), (Figure B1a). iii. Herringbone pattern with lines pointing forward occurring at exponentially decreasing distances apart (Figure B1b). 2. Half the Wundt’s illusion (Figure B1c). 3. The control road (Figure B1d).
56
0.6 m
a. Herringbone pattern (lines pointing backward)
0.6 m
Yellow paint
2.5 m 0.6 m
b. Herringbone pattern (lines pointing forward)
0.6 m
c. Half Wundt’s Illusion
4.49 m 0.6 m
Road Shoulder d. Control road (normal lane width)
5.0 m 3.7 m
White paint
Figure B1:
Road treatments used in Experiments 2 & 3.
57
APPENDIX C Treatments Evaluated in Experiment 4
1. A replication of the Drenthe Province treatment used in the Netherlands, as investigated by De Waard et al. (1995) and Steyvers (1998), (Figure C1a). 2. A modified version of the Drenthe treatment, with a continuous gravel strip for the edgelines, and a continuous white painted gravel strip for the centreline (Figure C1b). 3. A second modified version of the Drenthe treatment, with the edgeline markings constructed of white paint (no gravel), (Figure C1c). 4. Control road with standard lane delineation and the same lane width (2.25 m) as the three treatment roads above (Figure C1d). 5. Control road with standard lane delineation and a wider (2.7 m) lane width equal to the lane width of the control road used in the Drenthe Province on-road studies (e.g. De Waard et al., 1995), (Figure C1e).
58
4m
(a) Original Drenthe Province treatment
9.5 m
4m
0.45 m
Gravel 3m
(b). Drenthe Province treatment but with continuous edgeline & centreline
(c). Drenthe Province treatment with paint instead of gravel on the edgelines
2.25 m Paint & Gravel
0.3 m
6.3 m
0.3 m
Paint Only 4.8 m
2.25 m
(d). Narrow Control: Standard painted edgeline and centreline
0.75 m
9.5 m 4.6 m 0.1 m
(e). Wider Control: Normal lane width
Paint only 2.7 m
5.5 m Figure C1:
The five lane delineation markings used in Experiment 4.
59
0.3 m
APPENDIX D Treatments Evaluated in Experiment 5
1. Wide (2.3 m) painted hatched (diagonal striping) median, with a narrow (2.5 m) perceptual lane width. (Figure D1a). 2. Wide (2.3 m) white gravel median, with a narrow (2.5 m) perceptual lane width. (Figure D1b). 3. Narrow (1.3 m) painted hatched (diagonal striping) median, with a medium (3.0 m perceptual lane width. (Figure D1c). 4. Narrow (1.3 m) white gravel median, with a medium (3.0 m) perceptual lane width. (Figure D1d). 5. Control road (0.1 m wide painted centreline), with a narrow (2.5 m) lane width. (Figure D1e). 6. Control road (0.1 m wide painted centreline), with a medium (3.0 m) lane width. (Figure D1f). 7. Control road (0.1 m wide painted centreline), with a wide (3.6 m) lane width. (Figure D1g).
60
a. Narrow lane + hatched median
Note: All white line widths are 0.10m wide 2.3 m
2.5 m
White Paint
45° 0.25m 0.6m
1.0 m b. Narrow lane + gravel median
White Gravel
2.5 m 2.3 m
8.0 m shoulder c. Medium lan + hatched median
1.3 m 3.0 m
d. Medium lan + gravel median
3.0 m
e. Narrow lane control
2.5 m
f. Medium lan control
3.0
g. Wide lane control
Figure D1:
2m
1.3 m White Gravel
4.7 m
4.2
3.7 m
3.7 m
3.6 m
3.6 m
The seven lane delineation patterns used for Experiment 5.
61
APPENDIX E Treatments Evaluated in Experiment 6
1. Control road: Standard edgeline (10 cm wide continuous line) with the hatched median (Figure E1a). 2. Drenthe PCM edgeline with the hatched median (Figure E1b). 3. Chequered painted edgeline (85 cm wide) with the hatched median (Figure E1c).
62
a. Control (with the hatched median)
1.3 m 0.75 m 2.5 m
White Paint
45°
0.85 m 0.6 m
shoulder 2m 1.0 m
0.10 m wide 8.0 m
b. Drenthe PCM edgeline treatment
4m
Gravel only
0.45 m
0.40 m 4m
0.85 m c. Chequered Paint-only edgeline treatment
0.425m White Paint
0.425m
0.85m
1.0m
Figure E1:
The three lane delineation treatments used in Experiment 6.
63
APPENDIX F Treatments Evaluated in Experiment 7 F1:
CURVE 1: 3.4 METRE LANE WIDTHS.
The hatching consisted of 0.6m wide, white painted stripes at a 45° angle. The stripes were placed longitudinally every 2m. Where hatching was used for the inside and centreline conditions, it was bordered by two 10cm white edgelines. The hatching began at the beginning of the curve, increasing to its widest point (55cm) at the centre of the curve, then decreasing to zero width by the end of the curve. 1. Control: Plain curve with no treatment (3.4m lane), (Figure F1a). 2. Inside Hatching: 55cm hatching on the inside of the curve (3.4m lane), (Figure F1b). 3. Centreline Hatching: 55cm hatching on the centreline of the curve (3.4m lane), (Figure F1c). 4. Inside Road Shoulder Hatching: 55cm hatching on the inside road shoulder of the curve (3.4m lane), (Figure F1d).
64
A. Control (3.4m
B. Inside Hatching (55cm)
55cm
C. Centreline Hatching (55cm) Figure F1:
D. Inside Road Shoulder Hatching (55cm
Treatments and controls used in the first curve of Experiment 7.
65
F2:
CURVE 2: 3.5 METRE LANE WIDTHS
The hatching consisted of 0.6m wide, white painted stripes at a 45° angle. The stripes were placed longitudinally every 2m. Where hatching was used for the inside and centreline conditions, it was bordered by two 10cm white edgelines. The hatching began at the beginning of the curve, increasing to its widest point (35cm) at the centre of the curve, then decreasing to zero width by the end of the curve. 1. Control: Plain curve with no treatment (3.5m lane) , (Figure F2a). 2. Inside Hatching: 35cm hatching on the inside curve (3.5m lane), (Figure F2b). 3. Centreline Hatching: 35cm hatching on the centreline of the curve (3.5m lane), (Figure F2c). 4. Inside Road Shoulder Hatching: 35cm hatching on the inside road shoulder of the curve (3.5m lane), (Figure F2d).
66
35cm
A. Control (3.5m
B. Inside Hatching (35cm)
35cm 35cm
C. Centreline (35cm) Figure F2:
D. Inside Road Shoulder (35cm
Treatments and controls used in the second curve of Experiment 7.
67
F3:
CURVE 3: REFLECTOR POSTS WITH 3.5 METRE LANE WIDTHS
The posts were designed of a white painted timber, 1m high and 0.15m wide. The top of the posts was angled, and 0.05m from the lower angle was situated a red reflector on the left hand side of the road, and white reflector on the right hand side of the road.
1. Standard Posts: Post delineators (standard placement). Posts were placed 1m from the edge of the road. (Figure F3a). 2. Lateral Placement Outside: Post delineators (lateral placement on outside curve only). Posts increased in lateral placement from the edge of the road from 1m at the beginning of the curve to a maximum of 3m at the centre of the curve, and then decreasing to the standard of 1m by the finish of the curve. (Figure F3b). 3. Lateral Placement Both Sides: Post delineators (lateral placement both sides). Posts were the same as for the previous condition, however the inside posts increased in lateral distance from the edge of the road gradually in the 3 posts preceding the curve to a maximum of 3m at the start of the curve. This then decreased to 1m at the centre o the curve then increased to 3m again by the end of the curve. The posts decreased gradually in lateral placement to the standard distance of 1m in the 3 posts following the curve. (Figure F3c). 4. Lateral and Ascending Placement Outside: Post delineators (lateral and ascending placement on outside). Posts on the outside of the curve were the same for the lateral placement condition, however the posts also increased gradually in size to a maximum of 2m at the centre of the curve, then decreased gradually back to the standard height o 1m by the end of the curve. The inside posts in this condition were of standard height and lateral placement. (Figure F3d).
68
A. Standard Posts
C. Lateral Placement Both Sides Figure F3:
B. Lateral Placement Outside
D. Lateral and Ascending Placement Outside
Treatments and controls used in the third curve of Experiment 7.
69