Aug 31, 2011 - stage algorithm for one-microphone reverberant speech en- hancement. ... turns the speech more pleasant [1] for normal listeners. How-.
INTERSPEECH 2011
Perceptual Improvement of a Two-Stage Algorithm for Speech Dereverberation Thiago de M. Prego1 , Amaro A. de Lima1,2 and Sergio L. Netto1 1
2
Program of Electrical Engineering, COPPE, Federal University of Rio de Janeiro, Brazil. Federal Center for Technological Education Celso Suckow da Fonseca (CEFET-RJ), Brazil. {thprego, amaro, sergioln}@lps.ufrj.br
Abstract
this work and analyzes in details the results achieved by the three suggested improvements for the entire database. Finally, a conclusion concerning the performance increase and the computational reduction is included in Section 5.
This paper presents three effective proposals for a twostage algorithm for one-microphone reverberant speech enhancement. The original algorithm is divided into two blocks: one that deals with the coloration effect, due to the early reflections, and the other for reducing the long-term reverberation. The proposed modifications consider changing the linearprediction model order, the adaptation stepsize and stop criterion for the first algorithm stage. All the modifications are evaluated by a perceptual-quality measure specific for the speechreverberation context. Experimental results for a 200-signal database show that the proposed improvements yielded an increase of 12% in perceptual measure and a reduction of about 96% in the computation cost when compared to the original framework.
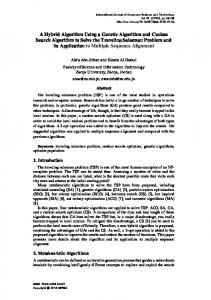
2. Original two-stage algorithm The reverberation effect is often modeled by a room impulse response (RIR) which includes three different portions: the direct-path signal, which corresponds to the direct sound component from the source to the listener; the early reflections, which presents a non-flat frequency response that distorts the speech spectrum; and, finally, the late reverberation, which causes smearing of the speech spectrum, reducing the intelligibility and quality of the signal [2, 3]. The algorithm under analysis was designed to mitigate the effects due to the early and late reflections, which are known as coloration and long-term reverberation, respectively. The twostage dereverberation algorithm described in [2] consists in applying two isolated signal processing blocks to reduced the reverberation level in a given speech sample. These two blocks are seen in Figure 1, where y(n), z(n) and x(n) are the reverberant, inverse-filtered and spectral-subtracted/dereverberated speech signals, respectively. As all proposed modifications considered in this paper refer to the inverse-filtering block, this stage is described in details in the following subsection.
1. Introduction Speech intelligibility and quality are affected by several kinds of impairments during signal generation, processing or transmission. Such impairments, may include, for example, speech coding distortions, packet loss, time clipping, background noise, echo and reverberation. Although one may prefer most of these impairments to be absent, the reverberation in a small amount turns the speech more pleasant [1] for normal listeners. However reverberation can drastically affect the performance of current automatic speech/speaker recognition or hearing-aid systems, thus requiring an appropriate speech enhancement technique to reduce its perceived effects. Common dereverberation techniques use microphone arrays, but for the applications previously mentioned the use of one-microphone system seems to be more natural and adequate. In this paper, analysis and improvement proposals are suggested to a two-stage one-microphone algorithm for reverberant speech enhancement [2]. This algorithm is divided into two parts: the first deals with problem of coloration of reverberant speech due to early reflection and the other part treats the longterm reverberation effect. Coloration is often mitigated by an adaptive inverse-filter procedure which maximizes some statistics of the linear prediction (LP) residue to reconstruct the desired speech signal. Meanwhile, the diffuse nature of the late reverberation is often dealt with a spectral subtraction procedure To introduce the proposed modifications, this paper is organized as follows: In Section 2, the original dereverberation algorithm is explained in details. Section 3 considers three different modifications to the original algorithm in order to increase its dereverberation performance and reduce its computational cost. Section 4 describes a 200-signal database employed in
Copyright © 2011 ISCA
��� �� ��� ������
y(n) �������� � �����
z(n) ������� � �����������
x(n) �� ��� �� ���� ������ Figure 1: Block diagram of dereverberation algorithm proposed in [2].
209
28- 31 August 2011, Florence, Italy
2.1. Inverse filtering
2. The influence of the adaptation step; and
The idea of the inverse filtering is to reconstruct a estimate of the original speech signal, reducing the effects of coloration. This block was based on [4], where a multimicrophone inverse filtering algorithm is determined by maximizing the kurtosis of the LP residue generating an inverse model for the associated reverberation RIR. Defining the inverse filter of length L as g = [g0 , g1 , . . . , gL−1 ]T , whose impulse response is hg (n) = PL−1 j=0 gj δ(n−j), the inverse-filtered z(n) speech may be written as z(n) = hg (n) ∗ y(n). (1)
3. The convergence criterion for the adaptive algorithm. The perceptual quality of the resulting dereverberated speech may be evaluated by Allen’s objective measure defined as [6, 7] P = Pmax − σV2 T60 ,
where Pmax is the maximum possible score, σV2 is the room spectral variance [9] and T60 is the associated reverberation time. In practice, σV2 is highly associated to the coloration effect and T60 indicates a more lasting reverberation effect, and these two values may be obtained directly from the RIR, h(n), which is estimated by a deconvolution process between the clean and the degraded speech signals. The Allen’s measure presented in Eq. (5) with Pmax = 0 is used in this work to evaluate the quality of the dereverberated speech. Initially the proposed approaches were analyzed observing just one reverberant speech signal degraded by real reverberation effect with 960 ms of reverberation time, which is expected to represent a general environment reverberant situation. A subsequent evaluation for a complete 200-signal database is presented in Section 4.
As the LP residue of clean speech has higher kurtosis than of reverberant speech, the inverse filter g may be designed to maximize the kurtosis of z(n). This optimized design may be implemented in an adaptive manner, based on the problem of LP reconstruction artifacts [4], which uses the LP residue yr (n) of the reverberant speech instead of y(n) in Eq. (1) leading to zr (n) = hg (n) ∗ yr (n). Once one obtains the optimum filter g, the inverse-filtered speech z(n) is calculated according to Eq. (1). The optimization of g is calculated based on a length¯ block Least Mean Squares (LMS)-like adaptive algorithm, L which exploits the mth block of yr (n), defined by yr (m) = ¯ . . . , yr ((m+1)( 3 L)−1)]. ¯ [yr (m( 23 L)), Equivalently the mth 2 block of inverse-filtered LP residue zr (m) is generated. The adaptive algorithm uses the average kurtosis of zr (m), as cost function: « M −1 M −1 „ 1 X 1 X E[zr 4 (m)] − 3 , J¯ = J(m) = M m=0 M m=0 E2 [zr 2 (m)]
(5)
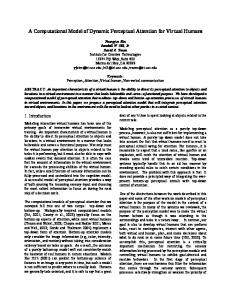
3.1. Influence of LP filter order The analysis of the LP filter order was first motivated by observing the behavior of the average kurtosis J¯(i), which depends on the iterations i, since zr (m) is updated by g(i) , as depicted in Figure 2, which, after convergence, seems to oscillate around a mean value and generating quite distinct dereverberation performances in each case.
(2)
where E[·] denotes the statistical mean operator, such that 10
f (m) = ∇J(m) =
9
4(E[zr 2 (m)]zr 3 (m) − E[zr 4 (m)]zr (m)) . (3) E3 [zr 2 (m)]
8 7
According to Haykin [5] the time-domain implementation is not recommended for this formulation, as a large eigenvalue spread of the input-signal autocorrelation matrix may cause slow or no convergence. Thus a frequency-domain structure is employed, where the FFT (Fast Fourier Transform) is applied ¯ data blocks. Defining G(i) as the FFT of g(i) from to length-L ith iteration, F(m) and Yr (m) being respectively the FFT’s of f (m) and yr (m), the inverse filter update equation becomes M −1 μ X F(m)Yr∗ (m), G(i + 1) = G(i) + M m=0
¯ J(i)
6 5 4 3 2 1 0 0
(4)
100
200
i
300
400
500
¯ convergence using L = 10 LP Figure 2: Average kurtosis J(i) coefficients, μ = 3 × 10⁻⁹ and a total of Ni = 500 iterations.
where μ is the adaptive filter stepsize and the superscript asterisk represents the complex-conjugate operation. Considering practical issues, the algorithm described in [2] uses an adaptation stepsize μ = 3 × 10⁻⁹ , an LP filter length L = 10 and ¯ = 0.032 × Fs with 50% of overlap between a block size L consecutive blocks, where Fs is the sampling frequency.
The increase in LP filter order should provide a more impulsive-like LP residue in accordance to the glottal cycles, which is a more appropriated structure to be optimized by the kurtosis maximization. Figure 3 presents the results of Allen’s score (P ) of the dereverberated speech varying the LP filter order from 10 to 100 coefficients, using the original adaptation step μ = 3 × 10⁻⁹ and Ni = 500 iterations. From this figure, the best score was achieved by L = 50 coefficients, corresponding to an approximate 12% increase in P and the smoother kurtosis profile depicted in Figure 4.
3. Proposed modifications This work considers three design aspects within the inversefiltering block: 1. The LP filter order;
210
0
−1.6
−1
−1.7
−2
−1.8
−3
P
P
−1.5
−1.9
−4
−2
−5
−2.1
−6
−2.2 0
20
40 60 LP Filter size
80
−7 0
100
Figure 3: Dereverberated speech quality applying Allen’s score (P ) as a function of the LP filter order and with μ = 3 × 10⁻⁹ and a total of Ni = 500 iterations.
0.2
0.4
0.6
0.8
μ
1
1.2
1.4
−8
x 10
Figure 5: Dereverberated speech quality using Allen’s score (P ) as a function of the adaptation stepsize (μ) with L = 50 LP coefficients and a total of Ni = 500 iterations.
10
minimums up to −80 dB and a threshold reach after only Ni = 29 iterations, which represents a computational-cost decrease of approximately 94% in the inverse-filter update process.
9 8
6
0
5
−10
4
−20
3
−30
2
−40
Jd (i) [dB]
¯ J(i)
7
1 0 0
100
200
i
300
400
500
−50 −60 −70
¯ convergence using L = 50 LP Figure 4: Average kurtosis J(i) coefficients, μ = 3 × 10⁻⁹ and a total of Ni = 500 iterations.
−80 −90 −100 0
3.2. Influence of adaptation stepsize (μ)
100
200
i
300
400
500
¯ = 4, L = 50 LP Figure 6: Average kurtosis variation with M coefficients and μ = 7 × 10⁻⁹ .
Figure 5 depicts the Allen’s score (P ) for several values of μ ranging from 1 × 10⁻⁹ to 1.4 × 10⁻⁸ , with L = 50 and Ni = 500. Following this analysis, the chosen adaptation step was set to μ = 7×10⁻⁹ (best performance), which yields an additional 20% increase in Allen’s score, as compared to the results in the previous subsection.
4. Analysis for complete database The database used in this work is called the New BrazilianPortuguese (NBP) database and includes 200 signals, with Fs = 48 kHz, and different types and levels of reverberation. The whole database was generated from 4 anechoic speech signals (2 from a male and 2 from a female speaker) using three distinct reverberation approaches:
3.3. Convergence criterion for the adaptation algorithm In order to avoid an excessive computational cost for all Ni = 500 iterations, a new stopping criterion was devised for the adaptation algorithm, thus reducing the overall computational burden while sustaining a similar quality of the dereverberated speech. In this case, we measure the average kurtosis variation in time by ˛ ˛P ¯ PM¯ ˛ ˛ M ¯ ˛ l=1 J(i − l) − l=1 J¯(i − l + 1)˛ ¯ ˛ ˛P Jd (i) = (6) ˛ ˛ M¯ ¯ ˛ l=1 J (i − l)˛
• Artificial reverberation: This approach considered 6 distinct artificially generated RIRs, with the early reflections modeled by the image method [10], with a fixed source-microphone distance d = 1.8 m in a virtual room of dimensions length×width×height = 4 m × 3 m × 3 m. For T60 = {200, 300, 400} ms, the late reverberation was emulated by a feedback-delay network [11], and for T60 = {500, 600, 700} ms a modified version of Gardner’s method [12, 13] was employed.
¯ =4 and set the stopping criterion at J¯d (i) = −50 dB, with M obtained empirically to yield an smooth process. The resulting kurtosis variation for L = 50 and μ = 7 × 10⁻⁹ is seen in Figure 6, where one notices a approximately flat pattern with
• Natural reverberation: In this case, the RIRs were obtained from the direct recordings of 4 different types
211
database and different perceptual measures to assess the system performance.
of rooms (booth, meeting, office, and lecture rooms) with several source-microphone distances for each room, as detailed in [14]. The 4 rooms have different wall dimensions and source-microphone distances making a total of different 17 RIRs. The average measured reverberation time for the 4 rooms are in the range of {120, 230, 430, 780} ms. • Real reverberation: In this case, the anechoic signals were directly played/recorded in 7 different rooms, and the corresponding RIRs were obtained from deconvolution. Each for the 7 rooms (booth, office1, lecture1, meeting1, office2, lecture2, meeting2) considered 4 source-microphone distances, {1, 2, 3, 4} m, except for the smaller one (booth), where only 3 distances were employed, {0.5, 1, 1.5} m, generating a total of 27 RIRs with average measured reverberation time in the range of {140, 390, 570, 650, 700, 890, 920} ms. In this Section the complete NBP database is employed to evaluate the performance of the original (with L = 10, μ = 3 × 10⁻⁹ and Ni = 500) and modified (with L = 50, μ = 7 × 10⁻⁹ and varying Ni ) versions of the two-stage dereverberation algorithm. Table 1 shows the Allen’s score and T60 values (as estimated by the algorithm described in [15]) for the NBP processed signals using the two algorithm versions.
6. Acknowledgements The authors would like to thank Prof. M. Karjalainen, for providing the T60 estimation algorithm, and Prof. D. Wang, for providing the original two-stage algorithm for reverberant speech enhancement.
7. References [1] R. Appel and J. Beerends, “On the Quality of Hearing Ones Own Voice,” J. Audio Engineering Society, vol. 50, no. 4, pp. 237–248, April 2002. [2] M. Wu and D. Wang, “A Two-Stage algorithm for onemicrophone reverberant speech enhancement,” IEEE Trans. on Audio, Speech and Lang. Proc., vol. 14, May 2006. [3] J. Y. C. Wen, N. D. Gaubitch, E. A. P. Habets, T. Myatt, and P. A. Naylor, “Evaluation of speech dereverberation algorithms using the MARDY database,” Proc. IEEE Int. Workshop Acoustic Echo and Noise Control, Paris, France, Sept. 2006. [4] B. W. Gillespie, H. S. Malvar and D. A. F. Florˆencio, “Speech dereverberation via maximum-kurtosis subband adaptive filtering,” Proc. IEEE Int. Conf. on Acoustics, Speech, and Signal Processing Salt Lake, USA, May 2001. [5] S. Haykin, Adaptive filters theory, 4th ed., Upper Saddle River, N.J.: Prentice-Hall, 2002. [6] J. B. Allen, “Effects of small room reverberation on subjective preference,” J. Acoustic. Soc. Am., vol. 71, Apr. 1982.
Table 1: Mean performances of quality assessment measures (Allen’s score (P ) and T60 ) for both algorithm versions. Quality Measures P T60 [ms]
Entire Database -2.95 517
[7] D. A. Berkley and J. B. Allen, “Normal Listening in Typical Rooms: The Physical and Psychophysical Correlates of Reverberation,” Acoustical Factors Affecting Hearing Aid Performance, 2nd ed., G.A. Studebaker and I. Hochberg eds., Allyn and Bacon, 1993.
Two-stage algorithm Original Improved -2.31 -2.04 335 304
[8] T. H. Falk and W.-Y. Chan, “A non-intrusive quality measure of dereverberated speech,” Proc. IEEE Int. Workshop Acoustic, Echo and Noise Control, Seattle, USA, Sept. 2008.
Comparing the performances for the 200-signal database, one notices that the original and modified algorithm versions respectively achieved performance improvements of 22% and 30% for Allen’s score and 35% and 40% for T60 . These results correspond to performance improvements for the modified algorithm in comparison to its original framework of approximately 12% for Allen’s score and 9% for T60 . A t-test for this experiment indicated a confidence value of about 94.4% that the P and T60 mean results are significantly different for both algorithm versions. For the entire NBP database, the average value of Ni was 21, representing an average computational-time reduction of 96%.
[9] J. J. Jetz, “Critical distance measurement of rooms from the sound energy spectral response,” J. Acoustic. Soc. Am., vol. 65, pp. 1204–1211, May 1979. [10] J. B. Allen and D. A. Berkley, “Image method for efficiently simulating small-room acoustics,” J. Acoustic. Soc. Am. vol. 65, no. 4, pp. 943–950, Apr. 1979. [11] J.-M. Jot and A. Chaigne, “Digital delay networks for designing artificial reverberators,” Proc. 90th Conv. Am. Engineering Soc., Preprint 3030, Feb. 1991. [12] W. G. Gardner, Reverberation Algorithms, in Applications of Digital Signal Processing, Ed. Mark Kahrs and Karl-Heinz Brandenburg, Kluwer, New York:NY, pp. 85–131, Mar. 1998. [13] A. A. de Lima, F. P. Freeland, P. A. A. Esquef, L. W. P. Biscainho, B. C. Bispo, R. A. de Jesus, S. L. Netto, R. Schafer, A. Said, B. Lee, and A. Kalker, “Reverberation assessment in audioband speech signals for telepresence systems,” Proc. Int. Conf. Signal Processing in Multimedia Applications, Porto, Portugal, pp. 257– 262, July 2008.
5. Conclusions This paper analyzed the influence of several parameters for a two-stage enhancement algorithm for reverberant speech with respect to the perceived quality of the dereverberated signals. Three proposals of improvements in the original algorithm were analyzed, providing higher perceived quality at a cost of reduced computational complexity. The proposals consisted of analyzing the LP filter order, the adaptation stepsize μ and a convergence criterion for the inverse-filter modeling stage. The overall system performance was addressed for a 200-signal database of reverberated signals, leading to performance improvements of 12% and 9% in Allen’s perceptual score and average T60 , at an average 96% reduction in the associated computational cost. Future work should include the use of a training
[14] M. Jeub, M. Sch¨afer, and P. Vary, “A Binaural Room Impulse Response Database for the Evaluation of Dereverberation Algorithms,” Proc. 16th Int. Conf. on Digital Signal Processing, Santorini, Greece, 2009. [15] M. Karjalainen, P. Antsalo, A. M¨akivirta, T. Peltonen, and V. V¨alim¨aki, “Estimation of modal decay parameters from noisy reponse measurements,” Proc. Conv. Audio Engineering Society, Amsterdam, Netherlands, pp. 867–878, May 2001.
212