especially the Gestalt psychologists, have long recognized the importance of finding organization in sensory data. The Gestalt law of organization [9, 10] states ...
Perceptual Organization as a Method for Detection and Selection of Filamentous Structures in Highly Noisy Images Acquired by Cryo-electron Microscopy Yuanxin Zhu, Bridget Carragher, David Kriegman, and Clinton S. Potter Beckman Institute for Advanced Science and Technology University of Illinois at Urbana-Champaign
Abstract This paper presents our recent progress toward a fully automated system for cryo-electron microscopy that integrates instrument control, computer vision algorithms and machine learning techniques. It describes our image analysis strategies for detection and selection of filaments in highly noisy images using multi-level perceptual organization. At the signal level, we use the Canny edge detector to detect weak boundaries. Collinearity at the primitive level is employed to organize discontinuous edges into line segments with a complete description, by using the Hough transform followed by an algorithm to detect end points of line segments. At the structural level, line segments are grouped into filamentous structures by seeking parallelism and employing high-level knowledge. In addition, statistical methods are used to split two filaments if they are joined together end-to-end. The performance of the proposed approach has been tested and evaluated by applying it to high magnification images of tobacco mosaic virus.
1. Introduction The next decade promises to be an exciting one for understanding the inner workings of the cell. Genomes are being sequenced at an ever-increasing pace, and protein expression systems are being perfected, so we can expect that many of the polypeptide building blocks of the cell will be available for detailed study soon. It is clear that the majority of the cell’s proteins do not function alone but are rather organized into smaller and larger macromolecular complexes. These complexes can be thought of as machines containing functional modules (the enzymatic core), regulatory modules (controling the core), and localization modules (directing the complex to a particular part of the cell). Examples include microtubulemotor complexes, actomyosin, nuclear pore complexes, nucleic acid replication and transcription complexes, vaults, ribosomes, proteosomes, etc.
Cryo-electron microscopy is an approach that can be used to provide valuable structural information on such complexes. This technique promises to provide an increasingly important tool for structural biology. Briefly, the techniques uses a transmission electron microscope (TEM) to acquire 2D projection images of a specimen preserved in vitreous ice [1]. This preservation technique allows the specimen to be examined in its native state. A 3D electron density map of the specimen can be reconstructed from the two dimensional projections using what are essentially tomographic reconstruction techniques. The particular reconstruction technique is dictated by the symmetry and geometry of the specimen, which may fall into a number of different classes (e.g. 2D crystals, helical crystals, symmetric single particles and asymmetrical single particles). Cryo-electron microscopy as a technique does however suffer from one serious drawback – it is very time consuming and much of the work requires manual data processing and is extremely tedious. One of the principal bottlenecks to this technique is the enormous number of images that must be acquired for the structural analysis. This requirement results from the necessity for using extremely low doses of electrons (10e/A^2) to image the specimen in order to avoid beam induced radiation damage. As a result the acquired images have a very low signal to noise ratio and in order to reconstruct a threedimensional electron density map from the projections a very large number of images must be averaged together. The exact number of images required to complete a threedimensional reconstruction of a macromolecule depends on the size of the macromolecule and the desired resolution. It is generally agreed that in order to interpret a structure to atomic resolution, data from possibly hundreds of thousands of copies of the macromolecule must contribute to the average [2]. This in turn requires the collection of thousands to tens of thousands of electron micrographs. Currently, the field is constrained by manual data acquisition methods that are slow and labor-intensive. One could compare the state of molecular microscopy today to the situation in the x-ray crystallography field some 20 years ago. Since then the x-ray crystallographers
have expended a great deal of effort on automating the time consuming and tedious aspects of their work. The result is that today x-ray structure determinations can be done fast and efficiently – as evidenced by the veritable explosion of new structures appearing in the journals. Cryo-electron microscopy is ready for a similar developmental effort.
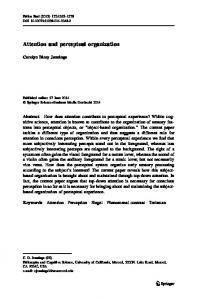
Figure 1. A sample image of TMV collected using cryo-TEM. Our goal is to develop a completely automated system for cryo-electron microscopy that integrates instrument control, computer vision algorithms and machine learning techniques. This would allow a 3D electron density map to be automatically generated from a specimen inserted in the microscope within hours with no manual intervention required by an operator. This would improve both the quality and quantity of data collected. Towards this goal, we have already developed a system, called Leginon, to automatically acquire images from the electron microscope [3, 4]. The Leginon system performs all the operations normally performed by an experienced microscopist, including multi-scale image analysis to identify suitable targets for high magnification image acquisition. The system can acquire up to 1000 images a day and the overall performance of the automated system is equivalent to that of an experienced microscopist. An example of an image acquired in this way is shown in figure 1. The image shows three tobacco mosaic viruses (TMV) [5]. These structures form helical filaments 18 nm in diameter and 300 nm in length. As a result of this helical symmetry, a 3D map of these structures can be reconstructed from these 2D projection images [6]. This
process traditionally requires manual segmentation of the filaments from the 2D projection image followed by 3D reconstruction using well described techniques [6, 7]. In order to integrate our automated data acquisition system with the 3D reconstruction process we thus need to automate the identification and segmentation of the helical filaments from the 2D projection image. This paper describes our image analysis strategies for detecting and selecting filaments from a noisy electron micrograph using a three-level perceptual organization. In humans, perceptual organization is the ability to immediately detect relationships such as collinearity, parallelism, connectivity, and repetitive patterns among image elements [8]. Researchers in human visual perception, especially the Gestalt psychologists, have long recognized the importance of finding organization in sensory data. The Gestalt law of organization [9, 10] states the common rules by which our visual system attempts to group information. Some of these rules include proximity, similarity, common fate, continuation and closure. In computer vision, as proposed by Mohan and Nevatia [11], perceptual organization takes primitive image elements and generates representations of feature groupings that encode the structural interrelationships between the component elements. Many perceptual grouping algorithms have been proposed, and excellent surveys of these works can be found in [8, 12, 13]. We will model our filament detection and selection process a three-level perceptual organization based on the classificatory structure proposed in [13] where the features to be organized are classified into four categories: signal, primitive, structural, and assembly. At each level, feature elements that are not grouped into higher-level features are discarded. Briefly, at the signal level, we use a Canny edge detector [14] to detect weak boundaries in noisy images. A Hough transform [16] followed by detection of end points of line segments and merging collinear line segments is developed at the primitive level to organize discontinuous edges into line segments with a complete description. At the structural level, line segments are grouped into filamentous structures (enclosed by pairs of straight lines) by seeking parallelism and employing highlevel knowledge. In addition, statistical methods are used to split two filaments if they are joined together end to end.
2. Edge detection For noisy images, it is necessary that at the signal level, edge detection has to be used to enhance low-level feature elements by organizing interesting points into edge chains and suppressing the possible effects of noise on higherlevel perceptual organization. We use the Canny edge detector to detect these weak boundaries. Canny edge detection uses linear filtering with a Gaussian kernel to
smooth noise and then computes the edge strength and direction for each pixel in the smoothed image. Candidate edge pixels are identified as the pixels that survive a thinning process called non-maximum suppression, followed by thresholding on the thinned edge magnitude image using hysteresis. All candidate edge pixels below the lower threshold are labeled as a nonedge and all pixels above the low threshold, that can be connected to any pixel above the high threshold through a chain of edge pixels, are labeled as edge pixels.
(c)
Figure 2. Edges detected using Canny edge detection with different input parameters (sigma, low, high). (a), (b), and (c) are edges detected in the sample image shown in figure 1 with input parameter set (0.6, 0.3, 0.9), (2.4, 0.3, 0.9), and (9.0, 0.3, 0.9), respectively.
(a)
(b)
Selecting the input parameters of the Canny algorithm is a critical step because the resulting edge quality varies greatly with the choice of parameters. At the signal level, the input parameters were selected to optimize the quality of edges for the purpose of higher-level perceptual organization. As described in [15], three parameters need to be specified for the Canny edge detector. The first is the standard deviation of the Gaussian filter specified in pixels, sigma. The second parameter, low, and third parameters, high, are, respectively, the low and high hysteresis thresholds. The best single overall parameter set for the Canny edge detector, identified by the performance measure method and evaluated on a wide variety of real images in [15], is (0.60, 0.30, 0.90). Applying this parameter set to our images does not produce a successful result as illustrated in Fig. 2(a). Even with the largest sigma value, 2.40, used in [15], the interesting edges are still totally distorted by noise (see Fig. 2(b)). To select the input parameters suitable for the highly noisy images in our situation, we first select a range of parameters that samples the space broadly enough but not too coarsely for each parameter, and then chose the best suitable input parameter by visual inspection of the resulting edge images. While this selection does not guarantee that the
optimal input parameter set was identified, it does generate good results in a timely way. The optimal parameter set for our images is (9.0, 0.3, 0.9) (see Fig. 2(c)). With this parameter set, the width of the Gaussian filter is 47 pixels, which is unusually large but is necessary due to the very poor signal-to-noise ratio in the images.
3. Line detection and end points computing At the primitive level, the Hough transform (HT), followed by searching end points of the line segments and merging collinear line segments, is used to organize noisy and discontinuous edges into complete line segments. To simplify the computation, the ρ − θ rather than slopeintercept parameters are used to parameterize lines [17]. The use of the HT to detect lines in an image involves the computation of the HT for each pixel in the image, accumulating votes in a two dimensional accumulator array and searching the array for peaks holding information of potential lines present in the image. The accumulator array becomes complicated when the image contains multiple lines with multiple peaks, some of which may not correspond to lines but are artifacts of noise in the image. Therefore, we iteratively detect the dominant line in the image, remove its contribution from the accumulator array, and then repeat to find the dominant one of the remaining lines. The peaks in the accumulator array provide only the length of the normal to the line ( ρ ) and the angle that the normal makes with the x-axis ( θ ). They fail to provide any information regarding the length, position, or end points of the line segments, which are vital to our selection of acceptable filaments. Several algorithms [18, 19, 20] have been proposed in the literature for finding the length and end points of a line from the Hough accumulator array. The drawback of these algorithms is that they are highly computationally intensive. Our integrated system requires the computation to be performed on the order of seconds to maximize throughput. In this paper, we extend an algorithm due to [21] for computing the end points of a line segment directly from the image based on accurate line parameters detected by the HT. Accurate line parameters can be detected by using the HT since most noise has been removed by the edge detection process. At each iteration, we find the global maximum in the accumulator array and from this compute the equation of the corresponding line. A simple postprocessing step is used to find the beginning and end points of the line, which involves moving a small window (e.g. 15 × 15 pixels) along the line and counting the number of pixels in the window. This count will rise above a threshold value at the beginning of the line and decrease below the threshold at the line end. Collinear line
segments are merged by allowing gaps in the line segment while moving the small window along the line. Having found two end points of the line segment, we next tag all pixels lying on the line segment and remove the contribution of these pixels to the Hough accumulator array. The Hough accumulator array is now becoming equivalent to that of an image that had not contained the detected line segment. The above processing is repeated with the new global maximum of the accumulator array. This continues until the maximum is below a threshold value which, found from experimentation, is recalculated at each iteration. Fig. 3 shows the line segments obtained after primitive-level perceptual organization on the edge image shown in Fig. 2(c).
Figure 3. Line segments obtained after primitivelevel perceptual organization on the edge image shown in Fig.2 (c).
4. Detection and selection of filaments At the structural level, line segments are actively grouped into filaments by seeking parallelism and employing knowledge obtained from training data. A filament is the area enclosed by two line segments with a particular structural relationship. Besides parallelism, the two line segments should also meet some heuristics: (i) The distance between the two line segments should be between specified maximal and minimal values, both of which are determined by statistical analysis on training data. (ii) The shorter one of the two line segments should be no less than one third of the length of the longer line segment. (iii) There should be some overlap between the two line segments. The overlap can be measured from the
correspondence between the end points of the two line segments. At least one third of either one should overlap with the other line segment. The area enclosed by two line segments that meet these requirements are considered as possible filaments. Line segments that are not grouped into filaments are discarded. Using these criteria, figure 4 shows the filaments detected from figure 3. The result of superimposing the detected possible filaments onto the original image is shown in figure 5. Another example image superimposed with detected possible filaments is shown in figure 7.
Figure 5. Result of superimposing the detected possible filaments onto the original image.
Figure 4. Possible filaments detected in the image shown in figure 3. The areas enclosed by two line segments labeled with the same color are possible filaments. As selected filaments are passed to the 3D reconstruction algorithms, more stringent constraints must be used to limit the number of filaments selected in order for this process to be efficient. First, only the area enclosed by the overlapped part of the two line segments are clipped as the detected filament. Secondly, as described earlier, filaments may be joined end to end along their length and must be individually segmented prior to 3D image reconstruction. Thus our algorithm must split a filament into multiple segments if it consists of two or more filaments which are joined together end-to-end (e.g., the longest filament in the image shown in Fig. 1). Finally, filaments which are shorter than the length required for further analysis are discarded.
To detect whether a filament actually consists of two or more shorter filaments which are end-to-end joined together, we have adopted a four-step approach. (i) First, rotate the image around its center so that the inclined filament becomes horizontal, and then cut this filament out of the rotated image (see figure 6(a)). (ii) Enhance possible end-to-end joins by linear filtering the filament image with a Gaussian kernel and computing the gradient magnitude for each pixel in the smoothed image (see figure 6(b)). (iii) Sum along the columns of the image to generate a 1-D projection as illustrated in Fig. 6(c). The maximum peak indicates the position of a possible end-toend join. (iv) Finally, determine whether the filament contains end-to-end joins by thresholding based on the statistics (maximum, mean, and standard deviation) of the 1-D projection. From training data, we have found that the metric defined as (m − µ ) W can be used to accurately discriminate whether a filament contains end-to-end joins, where m and µ are, respectively, the maximum and the mean of the 1-D projection, and W is the width of the filament. First, a threshold value is learned from the training data by visual inspection. Then a filament is classified as one containing one or more end-to-end joins if the value of the metric is larger than the threshold value. The filament will be separated along the column indicated by the position of the global peak in the 1-D projection. A recursive approach is used when there are multiple end-toend joins within one filament. Specifically, a filament is split into two sub-filaments along its dominant split point
indicated by the global peak in the 1-D projection. The sub-filaments are examined using the same approach, and this process is repeated until all filaments do not contain any end-to-end joins. Using this method the end-to-end join was identified in Fig. 6(a) and the longest filament as shown in Fig. 6(d) is extracted for further analysis.
(a)
(b)
standard for calibration of magnification and determining resolution and provides an ideal test specimen for evaluating a new technique. Our automated system was used to acquire images of these helical filaments in several experimental sessions using a Philips CM200 transmission electron microscope (TEM). Images were collected using a 1Kx1K CCD camera with a phosphor scintillator. At this magnification the pixel size was 2.8A. Table 1 summarizes the overall performance of the proposed approach when applied to detect and select TMV filaments collected during 3 experimental sessions. Training data was obtained from 141 high magnification images collected in a separate session. Table 1 indicates that large number of filaments can be automatically detected and selected with a very low false alarm rate. There are still a significant number of false dismissals, as measured by visual inspection of the data. However, while we would like to reduce the false dismissals, the yield is currently sufficient to produce a 3D map during a single data acquisition session. Thus we have achieved immediate goal of automatic filament selection from images acquired by cryo-electron microscopy. Table 1. Performance of the proposed approach when applied to 3 experimental sessions.
(c)
(d)
Figure 6: Illustration of the procedure of splitting two filaments if they are joined together end to end. (a) An extracted region from the image shown in Fig. 1 which represents two filaments joined end-to-end at the point indicated by the arrow. (b) is the gradient magnitude image of (a). (c) is the 1-D projection illustrating the summation along columns of image (b). (d) is the longest filament in (a) after separation at the endto-end join.
5. Experimental results We have tested and evaluated the performance of the proposed approach by applying it to high magnification (66,000x) images of helical filaments of TMV. TMV is a well characterized helical virus. It is often used as a TEM
Session No. #(Selected filaments) #(False alarms) Correct ratio (%) Average filament length (pixels) Average filament width (pixels) Standard deviation of filament width (pixels)
1 312 9 97.12 556.5
2 716 21 97.07 569.8
3 436 5 98.85 592.6
52.8
52.7
52.8
4.02
3.54
3.77
6. Summary and proposed improvements Our goal is to develop a completely automated system for cryo-electron microscopy that integrates instrument control, computer vision algorithms and machine learning techniques. This would allow a 3D electron density map to be automatically generated from a specimen inserted in the microscope within hours with no manual intervention required by an operator. This paper describes our image analysis strategies in detecting and selecting filaments from highly noisy high magnification images acquired using our automated system. Performance evaluation of the proposed strategies is also reported. The process of detecting and selecting filaments is modeled as a threelevel perceptual organization. At each level, feature elements that are not grouped into higher-level features are discarded. At the signal level, boundaries distorted by
strong noise are detected using the Canny edge detector. We found that the width of the Gaussian filter has to be as large as 47 pixels in order to detect useful signal edges. At the primitive level, collinear discontinuous edges are organized into line segments with a complete description using the Hough transform followed by detection of end points of line segments. At the structural level, line segments are grouped into filamentous structures by seeking parallelism and employing high-level knowledge obtained from training data. In addition, we have used statistical methods to accurately split two filaments if they are joined together end to end. The application experiments with high magnification images of TMV demonstrated the effectiveness and stability of the proposed strategies. Proposed future work includes: (i) explore machine learning techniques to increase the yield of detected filaments, i.e. to decrease false dismissals while maintaining very low false alarm rates; (ii) develop quantitative methods to measure image quality of the filaments by measuring the helical parameters which describe the filaments; (iii) optimize TEM data collection parameters such as defocus and dose to maximize filament detection.
7. Acknowledgements The authors gratefully acknowledge Jim Pulokas and the rest of the Leginon team at the Beckman Institute for collecting the data and Ron Milligan at The Scripps Research Institute for providing the specimen. This project is supported by NSF (DBI-9904547, DBI-9730056) and NIH (GM61939-01).
References [1] J. Dubochet, M. Adrian, J. J. Chang, J.C. Homo, J. Lepault, A.W. McDowall, and P. Schultz, “Cryoelectron Mciroscopy of Vitrified Specimens”, Quart. Rev. Biophys., 1988, 21: 129-228. [2] R. Henderson, “The Potential and Limitations of Neutrons, Electrons, and X-rays for Atomic Resolution Microscopy of Unstained Biological Macromolecules”, Quart. Rev. of Biophys., 1995, 28: 171-193 [3] C.S. Potter, H. Chu, B. Frey, C. Green, N. Kisseberth, T.J. Madden, K.L. Miller, K. Nahrstedt, J. Pulokas, A. Reilein, D. Tcheng, D. Weber and B. Carragher “Leginon: A System for Fully Automated Acquisition of 1000 Micrographs a Day.” Ultramicroscopy, 1999, 77: 153-161. [4] B. Carragher, N. Kisseberth, D. Kriegman, R.A. Milligan, C.S. Potter, J. Pulokas, and A. Reilein, “Leginon: An Automated System for Acquisition of Images from Vitreous Ice Specimens,” J. Struct. Bio., In press. [5] T.-W. Jeng, R. A. Crowther, G. Stubbs and W. Chiu, “Visualization of Alpha-helices in Tobacco Mosaic Virus by Cryo-electron Microscopy”, J. Mol. Biol., 1989. 205: 251-257. [6] D. J. DeRosier and P.B. Moore, “Reconstruction of Threedimensional Images from Electron Micrographs of Structures with Helical Symmetry”, J. Mol. Biol., 1970, 52: 355-369.
[7] B. Carragher, M. Whittaker and R.A. Milligan, “Helical Processing using Phoelix”, Journal of Structural Biology, 1996, 116: 107-112. [8] D. G. Lowe, Perceptual Organization and Visual Recognition, Boston: Kluwer Academic Publishers, 1985. [9] K. Koffka, Principles of Gestalt psychology, Harcourt, Brace and World, 1935. [10] W. Kohler, Gestalt psychology, Liveright, New York, 1947. [11] R. Mohan and R. Nevatia, “Perceptual Organization for scene segmentation and description”, IEEE Trans. Patt. Analy. And Machine Intell., 1992, 14(6): 616-634. [12] S. E. Palmer, “The Psychology of Perceptual Organization: A Transformational Approach”, In J. Beck, B. Hope, and A. Rosenfeld, editors, Human and Machine Vision, pp. 269-339, New York: Academic Press, 1983. [13] S. Sarkar and K. L. Boyer, Computing Perceptual Organization in Computer Vision, Singapore: World Scientific, 1993. [14] J. Canny, “A computation Approach for Edge Detection”, IEEE Trnas. Patt. Analy. and Machine Intell., 1986, 8(6): 679698. [15] M. D. Heath, S. Sarkar, T. Sanocki and K. W. Bowyer, “A Robust Visual Method for Assessing the Relative Performance of Edge-Detection Algorithms”, IEEE Trnas. Patt. Analy. and Machine Intell., 1997, 19(12): 1338-1359. [16] P.V.S. Hough, “Method and Means for Recognizing Complex Patterns”. U.S.Patent 3,069,654, Dec. 18, 1962. [17] R. O. Duda and P. Hart, “Use of the Hough Transformation to Detect Lines and Curves in Pictures”, Communications of the ACM, 1972, 15(1): 11-15. [18] J. Yamato, I. Ishii and H. Makino, “Highly Accurate Segment Detection using Hough Transformation”, Sys. Comp. Japan, 1990, 21(1): 68-77. [19] M. Atiquzzaman and M.W. Akhtar, “Complete Line Segment Description using the Hough Transform”, Image and Vision computing, 1994, 12(5): 267-273. [20] V. Karmat-Sadekar and S. Ganesan, “Complete Description of Multiple Line Segments using the Hough Transform”, Image and Vision Computing, 1998, 16: 597-613. [21] R. A. McLaughlin and M. D. Alder, “Technical Report – the Hough Transform Versus the Upwrite,” Tech. Rep. TR97-02, 1997, Univ. of Western Australia, CIIPS, Dept. of Electrical and Electronic Eng.
Figure 7. An example image, acquired using our automated system, superimposed with detected 8 possible filaments. The areas enclosed by two line segments labeled with same color represents a possible filament. These filaments will be passed into the procedure of end-to-end splitting. After endto-end separation, the selected filaments will be collected for reconstruction of the 3D density map.