notebook and electronic whiteboard applications 6]. Digital ink is also an appropriate level at ..... See e.g. 9, 15]. A great deal of signi cant structure is found by ...
Perceptual Organization in an Interactive Sketch Editing Application Eric Saund Thomas P. Moran Xerox Palo Alto Research Center 3333 Coyote Hill Rd., Palo Alto, CA 94304
Abstract
This paper shows how techniques from computational vision can be deployed to support interactive sketch editing. While conventional computersupported drawing tools give users access to visible marks or image objects at a single level of abstraction, a human user's visual system rapidly constructs complex groupings and associations among image elements according to his or her immediate purposes. We have been exploring perceptually supported sketch editors in which computer vision algorithms run continuously, behind the scenes, to a�ord users e�cient access to emergent visual objects in a drawing. We employ a exible image interpretation architecture based on token grouping in a multiscale blackboard data structure. This organization supports multiple perceptual interpretations of line drawing data, domain-speci c knowledge bases for interpreting visual structures, and natural gesture-based selection of visual objects. 1
Introduction
Historically, most applications for computer vision have been envisioned either in terms of fully autonomous agents such as stationary or mobile robots, factory inspection systems, and automated surveillance systems, or else in terms of standalone, batch data processors such as satellite image data analysis and optical character recognition systems. Recently, however, the scope of computer vision applications has expanded to embrace rich interaction with humans, including medical image enhancement, data visualization, and interactive virtual reality simulations. This paper reports on another application demanding richly interactive and real-time visual processing: perceptually supported image editing. The idea is to give a user direct access to emergent visual objects in a graphic image that re ect the sorts of perceptual objects constructed by his or her visual system [10, 2]. Existing graphic image editing programs are of three primary types. (1) Paint-style programs allow the user to work at the level individual pixels or user-
de ned collections of pixels. (2) Structured graphicsstyle programs allow one to instantiate abstract objects such as ellipses and rectangles, but once created these objects must be dealt with literally and cannot be uidly dissembled and then recomposed into new objects. (3) Sketch (or scribble) programs permit one to sketch freeform curvilinear lines represented as chain coded strokes of \digital ink." Because of its straightforward and concise representation of curvilinear lines and its support of the informal pen-on-paper metaphor, digital ink is the basis of current single-user and remote collaborative electronic notebook and electronic whiteboard applications [6]. Digital ink is also an appropriate level at which to target computer vision tools in support of perceptually supported image editing. The visual content of a line drawing is more tractable than that of photographic images, yet line drawings a�ord ample complexity and subtlety to challenge our notions of perceptual organization, object recognition, and scene analysis. While much work has been done on line drawing analysis and some applications have been built involving recognition of digital ink, neither support the kind of rich interaction with the user that we seek. The large literature on engineering drawing conversion is directed primarily toward computationally intensive autonomous batch programs exploiting a great deal of domain knowledge about the syntax and semantics of drawings created with drafting tools under specialized formats and conventions. A great deal of attention has also been devoted to the specialized task of on-line and o�-line handwriting recognition in which the program seeks to transcribe the input signal into characters. Finally, pen-based computers routinely employ pattern classi cation techniques for gesture recognition in which single pen strokes are interpreted in terms of a relatively small class of recognizable \gestures." In contrast to these applications, the kinds of user interaction we believe it important to support involve Gestalt-style perceptual organization associated with processing at the stages of middle vision. With digital
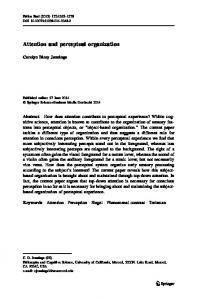
Figure 1: A sequence of drawing creation and transformation steps easy to visualize and describe, but not supported under conventional structured graphics or \ink" drawing editors. ink, the units of manipulation are strokes, de ned by the path of the pen from the time it touches the surface of the display until it is lifted. Often, however, users wish to manipulate not only the strokes as they were originally drawn, but also perceptually salient objects emergent from the raw markings. Figure 1 illustrates a simple interactive sketching scenario using our system but not supported by conventional digital ink or other drawing tools (see however [3] for automatic junction detection using planar maps). The user draws a circle and a rectangle, then moves the circle on top of the rectangle. In Panel 2 we are able to perceive as coherent image objects not only the original rectangle and circle, but also two halfcircles. In panel 3, the user grabs one of the half-circles and moves it to the other end of the rectangle. Finally, in Panel 4, the user erases the vertical strokes of the rectangle to create a single uni ed lozenge-shaped object, regardless of the facts that the deleted ink fragments were originally drawn as part of the complete rectangle in a single stroke, and that the rounded ends of the lozenge came originally from a circle. In general, a perceptually-supported image editor must be constantly working behind the scenes to dynamically maintain a rich set of sensible visual interpretations of the scene. These serve as a resource for the interpretation of user commands as he draws, selects, and modi es components of the image during the course of a drawing session. We call the general framework, WYPIWYG (What You Perceive Is What You Get) Image Editing. The intent of WYPIWYG image editing has pre-
viously been explored in a program for editing images of machine-printed text (that is, bitmap images of text as opposed to internally structured ascii representations of text) in terms of covertly recognized word, line and column structure [1]. More recently, an electronic whiteboard program [14, 11] has been augmented with WYPIWYG recognition tools to interpret digital ink markings in terms of list and column structure [12]. The present paper discusses the PerSketch image editor, which develops WYPIWYG image editing in the direction of interpretating digital ink markings in terms of visually salient components of coherent line drawings [19]. The program currently exists as a research prototype written in CommonLisp1. PerSketch's image editing protocol follows the conventional draw/select/modify user interaction paradigm. The pen is in one of two primary modes which are toggled by button press. In draw mode the pen simply lays down ink on the surface, which results the creation of stroke objects. In edit mode existing ink objects are deleted, moved, copied, rotated, and so forth, in a two-step process: (1) Select the object(s) to be edited; (2) Perform the actual deletion, copy, or transformation operation on the selected object(s). The technical challenges in building perceptually supported interactive image editors are severalfold. First, the visual task is not to discover \The correct" interpretation of a scene, but rather to prepare and maintain a rich repertoire of multiple overlapping, possibly con icting, partial, and ambiguous interpretations at several levels of abstraction. Second, the system must provide the user with a convenient means for selecting among a multitude of plausible visual objects. Third, the system response must be very fast to support real-time interaction. The remainder of the paper shows how concepts and techniques from computational vision contribute to a system architecture and algorithms serving these objectives. 2
Maintaining Perceptual Interpretations
2.1 Tokens in a Scale-Space Blackboard
The PerSketch system design is descended from the Primal Sketch [8]. Image objects are represented as tokens of various types residing in a multiscale spatially indexed blackboard data structure. Token grouping procedures operate on the contents of the blackboard,
1 The system is not optimized for speed, and presents a delay ranging from about a tenth of a second to a few seconds to process each stroke as it is input, depending on drawing complexity in the vicinity of the newly added stroke. This is fast enough to support many graphical editing tasks but is too slow for unimpeded handwriting.
2.2 Object Lattice
Figure 2: The major functional components of the PerSketch perceptually supported sketch editor. adding new tokens to label collections of existing tokens satisfying certain rules on their spatial organization. Figure 2 portrays the major functional components of the system architecture. Symbolic tokens make explicit the presence of and properties of visual structure in the image by virtue of internal attributes, which include: � type of structure denoted � spatial location
� � � � �
orientation scale or size pointers to supporting tokens or data pointers to supported tokens
additional type-speci c properties such as curvature, aspect ratio, and stroke width In order to identify perceptually coherent image objects, token grouping rules spend a great deal of e�ort searching for and testing for pairs and tuples of tokens that satisfy respective conditions on their spatial arrangements. In general a combinatorial explosion could result from testing all combinations of tokens against all rules. However, by and large, meaningful collections of tokens will be speci ed as lying in a common spatial neighborhood, and the grouping rules may be applied locally. The combinatorics is managed by the use of a spatially indexed data structure called the Scale-Space Blackboard [17]. This permits grouping procedures to perform enquiries of the form, \Return all tokens of type T within distance D of location (x; y)." The Scale-Space Blackboard also indexes tokens by size so that large scale structure is segregated from small scale detail. Spatial neighborhoods are de ned not in terms of absolute pixels, but instead in terms of a scale-normalized distance which assesses spatial proximity with respect to the sizes of the objects involved. This ensures that like visual structure can be identi ed consistently across all magni cations of any given image.
Marks in the image are represented at the lowest level as chain-coded fragments of digital ink. The tokens encapsulating these fragments and their spatial locations, orientations, and other properties are referred to as prime objects because they may contain internally no perceptually signi cant events, i.e. no corners and no junctions with other curves. Collections of prime objects give rise to composite objects representing perceptually salient emergent visual structure. In general, human users are capable of attending to any of several alternative interpretations or parsings of a given image depending upon their immediate tasks goals, surrounding context, and other cues. For example, in Figure 1 (Panel 3), one can readily focus on either the sausage or the rectangle. We suggest that the set of identi ably plausible intermediate level objects maintained by a perceptually enhanced image editor should re ect the rich and overlapping set of coherent perceptual chunks discovered or discoverable by the human visual system. To this end, prime and composite tokens are conceived as forming an Object Lattice that relates perceptual objects across levels of abstraction. Figure 3 illustrates the internal representations underlying the scenario of Figure 1. (In general there may be more than one layer of composite objects although this is not re ected in Figure 3.) The lattice nature of this organization provides for alternative interpretations of the primary data, that is, a given prime object may support more than one composite object.
2.3 Decomposition into Fragments
prime
Curve
As each new stroke is drawn into the image by the user, it is added to the Scale-Space Blackboard as a set of prime curve fragments. This entails two steps. First, the new stroke must be broken at corners, and second, intersections with existing image curves must be detected and further stroke decomposition performed so that at the most primitive level the sketch is represented by prime objects undistinguished internally by either corners or junctions. Corners on newly input curves are found using a fast multiscale algorithm that takes advantage of the curvature/acceleration/velocity characteristics of human arm and hand trajectories [4]. As a rule, segments of low curvature give rise to a bell-shaped velocity pro le with minima of velocity occurring at points of maximum curvature. Our corner detection algorithm takes as input the x-y position of the pen at uniform intervals in time; successive samples are typically several pixels apart. After box smoothing, curvature
Figure 3: The Object Lattice of prime objects (elemental curve fragments) and composite objects (emergent gures) underlying the sketch creation and editing steps of gure 1. �
at sample locations is estimated by the expression, �d (i) ? �d (i + 1) (1) � (i) = d
Dd
where �d (i) is the direction from sample points i ? d to sample point i, and Dd is the Euclidian distance between sample points i + d and i ? d. This curvature estimate is computed for various values of the integer scale parameter d to form a scale-space of curvature versus sample-location arrays. Candidate corner locations are identi ed at each scale by detecting local extrema in curvature whose absolute values fall above a threshold value. Finally, candidate corner locations are compared across scales. Corners found at multiple scales are merged and localized according to the index identi ed with the smallest curvature scale at which it appeared. The output of this algorithm is a set of sample indices that uniquely identify both large and small scale corners in hand-drawn curves. Sample results are shown in gure 4. Intersections between new strokes and existing curves are detected with the help of a Shadow Bitmap. The shadow bitmap maintains the spine or skeleton of each curve fragment in the image. When new strokes are drawn (or when existing strokes are moved) their paths are traced in the Shadow Bitmap to detect intersection with existing curves. When an intersection
Figure 4: Candidate corners found on a hand-drawn curve sampled at approximately 40 samples/second. is detected, it becomes an easy matter to check nearby prime objects in the Scale-Space Blackboard to discover which token represents the preexisting stroke, so that it can be removed from the Blackboard and replaced with two smaller prime objects bounded by the newly formed junction. The \Bitmap Spatial Analysis Procedures" in Figure 2 support this and other similar functions related to analyzing the proximities of curves on the bitmap level.
2.4 Grouping into composite Objects
Composite objects are added to the Object Lattice and Scale-Space Blackboard as coherent structure is identi ed by the application of an open-ended and extensible set of token grouping procedures. To date we have concentrated on grouping at the level of perceptual organization, that is, groupings of ink fragments that form coherent chunks as a result of curvilinear alignment, cotermination, corners, closure, or other straightforward but spatially signi cant properties. See e.g. [9, 15]. A great deal of signi cant structure is found by identifying curve fragments that align through junctions using hand-crafted criteria on relative orientation and curvature [18]. Then, curve tracing rules are applied to label as composite objects chains of segments of the following forms:
� curves including corners but stopping at isolated ends and junctions.
� curves passing through junctions but stopping at corners.
� curves including corners and passing
deleted prime objects are tested to see if they can be merged. When objects are added to the image, the Shadow Bitmap is checked for the creation of new junctions. Existing prime objects are fragmented and replaced where necessary. Then, the token grouping rules are applied to label newly emergent composite objects. In the current implementation all perceptual organization rules are applied at each pass through the cycle. As in other computer vision applications, computational expense increases with the sophistication and scope of the object recognition procedures, leading to a potential computational bottleneck as more domain-speci c knowledge is brought to bear to recognize more abstract objects. Our basic control structure extends to one in which processing resources are allocated among the primary function of supporting real-time user interaction, and a secondary function of identifying emergent spatial structure on an opporFigure 5: Program control structure underlying the tunistic basis. A variety of cues are available for diDraw/Select/Modify interaction loop apparent to the recting visual attention, including the spatial region user. in which the user has recently been drawing, locations indicated by the current selection gesture, and the shape characteristics of the selection gesture. Inunambiguously through junctions, such as would deed, the electronic whiteboard system described in be made with a single pen stroke. [12] postpones all recognition of visual structure until a selection gesture is received, at which time speci c Care is taken in the implementation of these rules that recognition routines are executed based on the shape curves satisfying more than one rule become associof the gesture. ated with one and only one composite object. Higher-level object recognition according with the 3 Gesture-Based Object Selection semantics of particular drawing domains relies on The collection of marks comprising an image may knowledge of domain speci c grouping rules, e.g. for give rise to numerous overlapping plausible parsings schematic diagrams [16, 7], mechanical drawings [5], and interpretations. Many of these are represented exor chemical illustrations [13]. These recognition techplicitly as individual tokens in the Scale-Space Blackniques t into our architecture in principle but have board, and yet other interpretations gain simple exnot been incorporated as yet. pression in terms of subsets of the tokens explicitly present there. In order for users conveniently to sin2.5 Control Structure gle out speci c visual objects for manipulation, the In order to maintain a consistent internal represenPerSketch system employs several pen-gesture intertation of emergent perceptual structure during an impretation techniques. Existing graphical object selecage creation/editing session, the PerSketch line drawtion methods include pointing and clicking/tapping at ing editor obeys the control structure shown in Figure or near image objects, and encircling. In addition to 5. The rounded boxes re ect the draw/select/modify these, we o�er two additional gesture selection techloop apparent to the user. niques that are better suited to disambiguating among The body of the image analysis work falls within the multiple overlapping perceptually plausible interpremodules, \Remove Objects From Image" and \Add tations of marks in a graphical image. We also impleObjects to Image." When objects are removed from ment a simple framework for deploying a multiplicity the image, their constituent prime curve fragments of gesture selection methods simultaneously and in coare removed from the Scale-Space Blackboard and operation with one another. the Shadow Bitmap, and all composite objects in 3.1 Pose Matching the Blackboard that had been supported by any of these prime fragments are removed as well. FurtherAlthough the various abstract objects identi able more, prime objects remaining in the vicinity of newly in a collection of curvilinear lines may overlap and
Figure 6: Selection by pose matching. Selection gesture paths are depicted in circular dots, resulting selected objects are shown with dotted lines. share support at a primitive level, each is characterized by its own unique combination of location and shape in the image. A technique called pose matching enables users to select among objects by exploiting the dual properties of gesture location and gesture shape. All the user has to do is to make a quick gesture that indicates the approximate location, orientation, and elongation of the intended object. To each composite object in the Scale-Space Blackboard we assign a parametric pose model equivalent to tting an oriented bounding box to the object, using the rst moment of inertia about the centroid to estimate orientation. We take as the ve pose parameters, x-location, y-location, orientation, length, and aspect-ratio. Similarly, any curve comprising the path of a selection gesture can be modeled by pose parameters in the same way. To compare object and gesture poses it is insu�cient to use a simple similarity measure such as Euclidian distance in the pose parameters because, for example, di�erence in orientation parameters of two poses is signi cant only when the aspect ratio of each is relatively high but becomes insigni cant when either object displays low aspect ratio. We have therefore designed a nonlinear similarity measure that trades o� distance with congruence in shape [19]. For any given selection gesture we rank order abstract objects residing in the Scale-Space Blackboard according to the similarity measure and o�er the most similar as the best guess of the object the user intends to select. Figure 6 illustrates that pose matching permits perceptually coherent objects to be selected with a single gesture despite the presence of overlapping objects and clutter.
3.2 Path Tracing
A second method for gesture-based object selection allows the user to select an arbitrarily composed curve by tracing an approximate path over it. The algorithm
Figure 7: a. Any partial path consisting of a chain of prime curve fragments, e.g. path A-B, is assigned a score assessing how well it accounts for the selection gesture path (circular dots). The score is based on the fraction p of the selection gesture spanned, and on the maximum distance d between the selection path and each constituent curve fragment. b. Dotted lines show the path of end-to-end-linked prime curve fragments chosen by the path tracing algorithm for a sample selection gesture (circular dots). identi es the path of curve fragments connected endto-end that best matches the path of the selection gesture. For any given chain of curve fragments, a quality measure, or score, can be assigned assessing the degree to which a given selection gesture path resembles that de ned by the curves. This is based on the fraction of the selection gesture spanned by the chain, and the t of each constituent curve fragment to the portion of the gesture path it projects onto. See Figure 7a. We use a dynamic programming algorithm to grow, one prime curve fragment at a time, the best scoring chain of curve fragments that accounts for the selection gesture. At each step of the algorithm a list of partial-chains is maintained along with their associated gesture matching scores, each chain beginning with a prime object residing near the starting end of the selection gesture. For each partial chain we also note the best-possible-score that could be obtained if
the chain were continued by a segment congruent with the remaining portion of the selection gesture. Each step of the path growing algorithm adds one link to the partial chain possessing the greatest best-possiblescore. Partial chains whose best-possible-scores fall below the chain with the best actual score are pruned from further consideration. The Scale-Space Blackboard is used to e�ciently nd prime objects linked end-to-end with the endmost prime curve segment of each partial chain. Figure 7b presents the chain of prime curve fragments best matching a selection path in an example scene.
3.3 Choosing Among Selection Methods
To give the user several methods for mapping a selection gesture to one or more objects in an image would lead to awkwardness if the user had to perform an extra step to specify among the selection methods available. Instead, we have implemented a simple means for the system to infer which selection method|point-and-tap, encircling, pose matching, or path tracing|is the most apt interpretation of the current selection gesture: Each time the user executes a selection gesture, each object selection algorithm is runs independently. Furthermore, each algorithm returns not only its best guess as to which object(s) the user intends to select, but also a con dence score indicating its \belief" that the user is indeed selecting by tapping, encircling, mimicing a pose, or tracing a path, respectively. For example, if the two ends of the selection gesture meet or form a small pigtail, then an encircling can be asserted with fairly high con dence. The con dence scores are compared to decide which selection method to choose. Parameters for the con dence score estimation algorithms are tuned by observing users and allowing for the kinds of slop they tend to exhibit in pointing, circling, pose matching, curve tracing, and so forth.
3.4 Example Use Scenario
Figure 8 presents a scenario in which perceptually supported sketch editing leads to faster and easier image modi cations than are possible with conventional digital ink editing tools. Existing marks may be rearranged and reused in all or in part, and as they are combined with each other and with new strokes, the curvilinear units available for manipulationby the user re ect many of the perceptually salient structures in which his visual system conceives the image. This example happens to have been drawn originally not on a stylus-based computer, but on paper. Using extensions of the techniques described in this paper, we import static bitmaps of line drawings, perform tracing to extract curve fragments, then apply
all of the image analysis procedures, thus enabling perceptually-supported editing from scanned images as well as sketches created online. 4
Conclusion
We view this work as an early step into an emerging space of WYPIWYG (What You Perceive Is What You Get) image editors. Applying only very basic techniques of curvilinear token grouping, we have established that computer vision has a great deal to o�er in the application domain of human/computer interfaces. As the scienti c study of perceptual organization and object recognition mature, more powerful image interpretation methods can be brought to bear to permit user interfaces to image editors, data visualization tools, and other computer applications to re ect additional kinds of image structure computed by the human visual system, including representations for image regions, region textures, three dimensional spatial structure, character and text recognition, and a host of methods for recognizing objects at a domainspeci c, semantic level. By applying these forms of image interpretation covertly as a user interacts with a display, we expect that computer vision holds a vital key toward profoundly synergistic interaction between humans and their information processing tools.
Acknowledgements
Craig Becker implemented an early version of the system and helped in developing the representations. We also thank the Tivoli group and the members of the PARC Image Understanding Area for helpful feedback and discussions. References
[1] Bagley, S., and Kopec, G. Editing Images of Text, Communications of the ACM, 37:12, (1994) [2] Edmonds, E., Candy, L., Jones, R., and Sou , B. Support for Collaborative Design: Agents and Emergence. Communications of the ACM, 37:7, (1994), 41-47. [3] Gangnet, M., Herve, J., Pudet, T., and Van Thong, J. Incremental Computation of Planar Maps. ACM Computer Graphics,23:3, (1989), 345-354 [4] Hogan, N. An Organizing Principle for a Class of Voluntary Movements. J. Neuroscience, 4:11 (1984), 2745-2754. [5] Joseph, S., and Pridmore, T. Knowledge-Directed Interpretation of Mechanical Engineering Drawings. IEEE TPAMI, 14:9 (1992), 928-940. [6] JOT: A Speci cation for an Ink Storage and Interchange Format. Software Publishers Association. Slate Corporation, Scottsdale, Az. [7] Lee, S. Recognizing Hand-Drawn Electrical Circuit Symbols with Attributed Graph Matching. In H. S. Baird, H. Bunke, and K. Yamamoto (eds.), Structured Document Image Analysis. Springer-Verlag, New York, 1992.
[8] Marr, D. Early Processing of Visual Information. Phil. Trans. R. Soc. Lond., B 275 (1976), 483-519. [9] Mohan, R., and Nevatia, R. Using Perceptual Organization to Extract 3-D Structures. IEEE TPAMI, 11:11 (1989), 1121-1139. [10] Montalvo, F. Diagram Understanding: The Symbolic Descriptions Behind the Scenes. In T. Ichikawa, E. Jungert, and R. Korfhage (eds.), Visual Languages and Applications. Plenum Press, New York, 1990. [11] Moran, T. Deformalizing Computer and Communication Systems. Position Paper for the InterCHI93 Research Symposium. 1993. [12] Moran, T., Chiu, P., van Melle, B., and Kurtenbach, G. Implicit Structures for Pen-Based Systems Within a Freeform Interaction Paradigm. Chi95. 1995. [13] Okazaki, S., and Tsuji, Y. An Adaptive Recognition Method for Line Drawings Using Construction Rules. NEC Research and Development Journal, 92 (1989). [14] Pedersen, E., McCall, K., Moran, T., and Halasz, F. Tivoli: An Electronic Whiteboard for Informal Workgroup Meetings. Proceedings of the InterCHI93 Conference on Human Factors in Computer Systems. ACM, New York, 1993. [15] Sarkar, S., and Boyer, K. Integration, Inference, and Management of Spatial Information Using Bayesian Networks: Perceptual Organization. IEEE TPAMI, 15:3 (1993), 256-274. [16] Sato, T., and Tojo, A. Recognition and Understanding of Hand-Drawn Diagrams. Proc. 6th International Conference on Pattern Recognition. IEEE Computer Society Press, New Jersey, 1982. [17] Saund, E. Symbolic Construction of a 2-D Scale-Space Image. IEEE TPAMI, 12:8 (1990), 817-830. [18] Saund, E. Identifying Salient Circular Arcs on Curves. CVGIP: Image Understanding, 58:3 (1993), 327-337. [19] Saund, E., and Moran, T. A Perceptually Supported Sketch Editor. Proc. ACM Symposium on User Interface and Software Technology(UIST'94), (1994), 175-184.
References
[1] Bagley, S., and Kopec, G. Editing Images of Text, Communications of the ACM, 37:12, (1994). [2] Edmonds, E., Candy, L., Jones, R., and Sou , B. Support for Collaborative Design: Agents and Emergence. Communications of the ACM, 37:7, (1994), 41-47. [3] Gangnet, M., Herve, J., Pudet, T., and Van Thong, J. Incremental Computation of Planar Maps. ACM Computer Graphics,23:3, (1989), 345354 [4] Hogan, N. An Organizing Principle for a Class of Voluntary Movements. J. Neuroscience, 4:11 (1984), 2745-2754. [5] Joseph, S., and Pridmore, T. Knowledge-Directed Interpretation of Mechanical Engineering Drawings. IEEE TPAMI, 14:9 (1992), 928-940. [6] JOT: A Speci cation for an Ink Storage and Interchange Format. Software Publishers Association. Slate Corporation, Scottsdale, Az. [7] Lee, S. Recognizing Hand-Drawn Electrical Circuit Symbols with Attributed Graph Matching. In H. S. Baird, H. Bunke, and K. Yamamoto (eds.), Structured Document Image Analysis. Springer-Verlag, New York, 1992. [8] Marr, D. Early Processing of Visual Information. Phil. Trans. R. Soc. Lond., B 275 (1976), 483-519. [9] Mohan, R., and Nevatia, R. Using Perceptual Organization to Extract 3-D Structures. IEEE TPAMI, 11:11 (1989), 1121-1139 [10] Montalvo, F. Diagram Understanding: The Symbolic Descriptions Behind the Scenes. In T. Ichikawa, E. Jungert, and R. Korfhage (eds.), Visual Languages and Applications. Plenum Press, New York, 1990. [11] Moran, T. Deformalizing Computer and Communication Systems. Position Paper for the InterCHI93 Research Symposium. 1993. [12] Moran, T., Chiu, P., van Melle, B., and Kurtenbach, G. Implicit Structures for Pen-Based Systems Within a Freeform Interaction Paradigm. Chi95. 1995. [13] Okazaki, S., and Tsuji, Y. An Adaptive Recognition Method for Line Drawings Using Construction Rules. NEC Research and Development Journal, 92 (1989).
[14] Pedersen, E., McCall, K., Moran, T., and Halasz, F. Tivoli: An Electronic Whiteboard for Informal Workgroup Meetings. Proceedings of the InterCHI93 Conference on Human Factors in Computer Systems. ACM, New York, 1993.
[15] Sarkar, S., and Boyer, K. Integration, Inference, and Management of Spatial Information Using Bayesian Networks: Perceptual Organization. IEEE TPAMI, 15:3 (1993), 256-274. [16] Sato, T., and Tojo, A. Recognition and Understanding of Hand-Drawn Diagrams. Proc. 6th International Conference on Pattern Recognition. IEEE Computer Society Press, New Jersey, 1982. [17] Saund, E. Symbolic Construction of a 2-D ScaleSpace Image. IEEE TPAMI, 12:8 (1990), 817-830. [18] Saund, E. Identifying Salient Circular Arcs on Curves. CVGIP: Image Understanding, 58:3 (1993), 327-337. [19] Saund, E., and Moran, T. A Perceptually Supported Sketch Editor. Proc. ACM Symposium on User Interface and Software Technology(UIST'94), (1994), 175-184.
Figure 8: PerSketch use scenario: inserting a missing
Figure 8: PerSketch use scenario: inserting a missing item in a bar chart.