Attention,
Perception
&
Psychophysics,
2011,
doi:
10.3758/s13414‐011‐0143‐5
The
final
publication
is
available
at
springerlink.com
Perceptual
Scale
Expansion:
An
Efficient
Angular
Coding
Strategy
for
Locomotor
Space
Frank
H.
Durgin
and
Zhi
Li
Swarthmore
College
Whereas
most
sensory
information
is
coded
in
a
logarithmic
scale,
linear
expansion
of
a
limited
range
may
provide
a
more
efficient
coding
for
angular
variables
important
to
precise
motor
control.
In
four
experiments
it
is
shown
that
the
perceived
declination
of
gaze,
like
the
perceived
orientation
of
surfaces
is
coded
on
a
distorted
scale.
The
distortion
seems
to
arise
from
a
nearly
linear
expansion
of
the
angular
range
close
to
horizontal/straight
ahead
and
is
evident
in
explicit
verbal
and
non‐verbal
measures
(Experiments
1
and
2)
and
in
implicit
measures
of
perceived
gaze
direction
(Experiment
4).
The
theory
is
advanced
that
this
scale
expansion
(by
a
factor
of
about
1.5)
may
serve
a
functional
goal
of
coding
efficiency
for
angular
perceptual
variables.
The
scale
expansion
of
perceived
gaze
declination
is
accompanied
by
a
corresponding
expansion
of
perceived
optical
slants
in
the
same
range
(Experiments
3
and
4).
These
dual
distortions
can
account
for
the
explicit
misperception
of
distance
typically
obtained
by
direct
report
and
exocentric
matching
while
allowing
accurate
spatial
action
to
be
understood
as
the
result
of
calibration.
A
fundamental
question
in
the
study
of
space
perception
is
why
the
apparent
geometry
of
locomotor
space
is
distorted.
There
are
two
well‐documented
biases
in
space
perception
that
must
be
explained.
First,
slanted
ground
surfaces
look
much
steeper
to
humans
than
they
are
(Kammann,
1967;
Proffitt,
Bhalla,
Gossweiler
&
Midgett,
1995;
Ross,
1974).
Second,
distances
along
the
ground
are
underestimated
(Foley,
Ribeiro‐Filho
&
da
Silva,
2004;
Gilinsky,
1951;
Loomis,
da
Silva,
Fujita
&
Fukusima,
1992).
One
attempt
at
an
integrative
theory
is
to
suppose
that
compression
of
perceived
space
along
the
line
of
sight
accounts
for
both
biases
(e.g.,
Ross,
2010),
but
such
a
distance‐based
account
can
only
explain
the
overestimation
of
uphill
slopes.
Distance
underestimation
should
make
downhill
slants
viewed
from
the
top
seem
shallower
(i.e.,
more
frontal
to
gaze,
Ross,
1974),
whereas
downhill
slopes
actually
appear
steeper
than
they
are
(e.g.,
Li
&
Durgin,
2009).
Moreover,
the
haptic
perception
of
slant
is
also
exaggerated
(Durgin,
Li
&
Hajnal,
2010),
even
among
people
who
are
congenitally
blind
(Hajnal,
Abdul‐Malak
&
Durgin,
2010).
This
suggests
that
biases
in
space
perception
are
not
simply
due
to
visual
error,
but
may
have
more
general
functional
significance.
Some
have
argued
that
accurate
motor
performance
demonstrates
that
these
biases
are
epiphenomenal
to
perception‐for‐action
(e.g.,
Proffitt
et
al.,
1995).
However,
because
action
can
be
calibrated
to
distorted
perception
(Durgin,
Hajnal,
Li,
Tonge
&
Stigliani,
2010;
Harris,
1963),
the
accurate
control
of
action
depends
not
on
perceptual
accuracy
but
on
the
precision
of
the
perceptual
information
made
available
for
motor
control
and
calibration
(Durgin,
2009).
Here,
we
propose
that
both
the
overestimation
of
slant
and
the
underestimation
of
ground
distance
are
the
result
of
a
coding
strategy
intended
to
enhance
the
precision
of
coded
angular
variables
useful
for
action.
The
strategy,
which
we
call
“scale
expansion,”
consists
in
the
perceptual
system
“magnifying”
(by
more
densely
coding)
a
portion
of
the
ranges
of
two
angular
variables
that
are
highly
relevant
for
spatial
actions
such
as
locomotion.
Our
proposal
is
not
that
perceptual
precision
is
actually
increased
by
dense
coding,
but
rather
that
existing
precision
in
this
part
of
the
range
might
be
better
retained
than
in
other
parts
of
the
range
as
the
information
moves
upstream.
(An
analogy
might
be
the
observation
that
“cortical
magnification”
is
even
greater
than
retinal
“magnification”,
but
this
“magnification”
occurs
as
a
result
of
differences
in
the
proportion
of
information
retained,
not
by
an
increase
in
the
amount
of
information.)
Perceptual
systems
code
and
transmit
sensory
information,
transforming
it
through
a
bi‐directionally‐ interactive
series
of
hierarchical
stages
into
higher‐level
perceptual
variables
that
are
useful
for
the
biological
functions
controlling
both
cognition
and
action.
Due
to
limits
in
channel
capacity,
coding
efficiency
is
important
at
all
stages
of
processing
(Barlow,
1990;
Miller,
1956).
Weber's
law
describes
a
logarithmic
coding
strategy
in
which
perceptual
precision
remains
relatively
stable
across
a
large
input
range.
Logarithmic
coding
is
efficient
for
those
perceptual
variables
that
have
extended
ranges,
like
brightness
and
loudness.
However,
angular
variables
are
bounded
magnitudes.
An
alternative
strategy
for
such
variables
is
to
densely
code
the
portion
of
the
range
that
is
most
relevant
to
the
biological
functions
that
use
this
angular
information.
Gaze
declination
(the
angular
downward
pitch
of
gaze)
is
an
angular
variable
that
is
important
for
space
perception,
because
it
not
only
provides
a
direct
measure
of
ground
distance
on
level
surfaces
(Messing
&
Durgin,
2005;
Ooi,
Wu
&
He,
2001;
Sedgwick,
1986;
Wallach
&
O’Leary,
1982)
but
also,
combined
with
local
optical
slant
(surface
orientation
relative
to
the
line
of
gaze),
can
determine
the
local
geographical
slant
of
the
ground
(Gibson
&
Cornsweet,
1952;
Li
&
Durgin,
2009;
Frank
H.
Durgin,
Department
of
Psychology,
Swarthmore
College,
500
College
Ave.
Swarthmore
PA
19081
USA
[email protected];
tel.
+01
610
328
8678
2
Perceptual
Scale
Expansion
Sedgwick,
1986).
When
walking
on
level
ground,
there
is
amplify
the
perceived
geographical
slant
of
the
ground
a
fixed
mapping
between
the
distance
to
a
target
on
the
when
it
departs
from
horizontal.
A
graphic
depiction
of
ground
(such
as
a
rock)
and
the
declination
of
gaze
to
our
model
is
shown
in
Figure
1,
in
which
the
expanded
that
location.
For
locomotion,
gaze
declination
rarely
scaling
of
perceived
gaze
declination
(γp)
is
accompanied
exceeds
60°
below
horizontal
during
surface
inspection
by
a
similar
expanded
scaling
of
perceived
optical
slant
even
for
complex
terrain
(Marigold
&
Patla,
2006),
which
(βp).
The
result
of
these
two
scale
expansions
would
be
means
that
the
range
of
gaze
declinations
between
0°
to
exaggerate
perceived
slant
deviations
from
horizontal
and
about
60°
is
a
candidate
for
perceptual
scale
(making
human
actions
more
responsive
to
surface
expansion.
That
is,
the
actual
range
of
gaze
declinations
slant),
but
to
reduce
apparent
egocentric
distance
along
could,
in
principle,
be
perceptually
expanded
by
a
factor
the
ground.
of
1.5
in
order
to
scale
the
range
of
0‐60°
to
a
perceptual
There
is
a
strong
pre‐theoretical
tendency
to
assume
range
of
0‐90°,
which
is
the
available
range
for
angular
that
proprioception,
including
such
things
as
perceived
coding
between
the
categories
of
horizontal
and
vertical.
gaze
declination,
should
be
unbiased,
though
there
is
lots
In
practice,
the
actual
re‐coding
would
more
likely
of
evidence
to
the
contrary
(e.g.,
Volcic,
Kappers
&
produce
an
expansion
of
the
lower
part
of
the
range
(say
Koenderink,
2007).
In
the
case
of
gaze
declination,
it
has
up
to
50°),
smoothly
transitioning
into
compression
of
been
assumed
that
perceived
gaze
declination
is
coded
the
range
from
60°
to
90°
(see
Durgin,
Li
&
Hajnal,
2010,
accurately
based
on
evidence
of
the
accuracy
of
Figures
2
and
6,
where
the
range
of
60
to
90°
is
locomotor
actions
with
respect
to
gaze
declination
(e.g.,
compressed
into
the
perceptual
range
of
75°
to
90°).
Ooi
et
al.,
2001;
see
also
Loomis
&
Beall,
2004;
Philbeck,
For
level
ground
to
appear
flat
however
(rather
than
Loomis
&
Beall,
1997).
However,
locomotor
action
is
tilted
downward),
scale
expansion
of
perceived
gaze
calibrated
by
perceptuo‐motor
experience
(Durgin,
declination
should
be
accompanied
by
a
corresponding
Pelah,
Fox,
Kane,
Lewis
&
Walley,
2005;
Reiser,
Pick
scale
expansion
of
perceived
slant
relative
to
gaze
Ashmead
&
Garing,
1995).
This
means
that
for
measures
(optical
slant).
In
fact,
we
have
recently
shown
that
the
of
successful
action
to
appear
accurate,
like
walking
to
a
perception
of
the
geographical
slants
of
near
surfaces
previewed
target
or
any
other
form
of
spatial
updating
(within
reach)
are
expanded
in
the
range
(~
0‐50°)
(Loomis
&
Philbeck,
2008),
it
is
only
required
that
relevant
for
locomotion
(Durgin,
Li
&
Hajnal,
2010)
and
perception
is
stable
rather
than
that
it
is
unbiased.
compressed
in
the
upper
range
(~
60‐90°).
Note
that
A
systematic
distortion
of
perceived
gaze
direction
geographical
slant
is
defined
relative
to
the
vector
of
(much
like
a
prism‐induced
shift
in
perception)
should
gravity
(vertical)
and
the
ground
plane
(horizontal),
not
be
evident
as
a
bias
in
action
if
action
has
become
whereas
optical
slant
is
defined
relative
to
the
direction
calibrated
to
the
distorted
perception.
Following
prism
of
gaze.
For
a
geographical
slant
of
zero
(a
horizontal
adaptation,
it
is
easy
to
remove
prism
glasses
and
surface),
the
optical
slant
(i.e.,
at
the
point
of
foveation)
observe
systematic
aftereffects.
However,
it
is
not
is
numerically
equivalent
to
the
declination
of
gaze.
possible
to
remove
intrinsic
perceptual
distortions
due
The
dense
coding
of
perceived
gaze
declination
(or
of
perceived
angular
declination
more
generally)
could
provide
two
advantages
for
the
control
of
action.
First,
the
resulting
scale
affords
more
precise
angular
distance
coding
along
the
ground
plane,
by
representing
finer
angular
deviations
between
points
along
the
ground.
This
kind
of
virtual
amplification
is
valuable
not
at
the
sensory
input
stage
(where
it
would
amplify
noise
as
well),
but
at
the
post‐ sensory
coding
stage
for
the
sake
of
efficient
transmission.
For
example,
if
one’s
neural
coding
scheme
can
represent
32
values
along
a
dimension,
but
distributes
those
values
in
proportion
to
likelihood
of
occurrence
(e.g.,
devoting
24
of
those
values
to
one
half
of
the
range),
this
virtually
expands
the
scale
of
that
half
of
the
range.
Howe
and
Purves
(2005)
have
Figure
1.
Scale‐expanded
perceptual
coding
(γp
and
βp)
of
both
made
a
related
likelihood‐of‐occurrence
gaze
declination
(γ)
and
optical
slant
(β)
amplifies
departures
of
analysis
to
try
to
account
for
biases
in
2D
angle
the
ground
plane
from
horizontal
(βp
‐
γp),
while
leaving
level
perception
based
on
natural
image
statistics.
Second,
insofar
as
there
is
a
corresponding
ground
appearing
flat,
but
distance
along
it
foreshortened.
scale
expansion
in
the
perception
of
optical
Expanded
scaling
of
these
angular
variables
may
enhance
coding
slant,
the
two
in
combination
will
virtually
of
ground
distance
and
surface
slant
for
action
control,
while
producing
known
biases
in
the
perception
of
slant
and
distance.
Durgin
&
Li
to
scale
expansion.
An
attempt
at
direct
measurement
of
perceptual
experience
is
therefore
called
for.
Indeed,
there
is
preliminary
evidence
from
direct
and
indirect
measures
that
an
exaggerated
perception
of
gaze
declination
contributes
to
the
exaggeration
of
perceived
slope
for
downhill
surfaces
(Li
&
Durgin,
2009),
but
the
direct
tests
were
conducted
looking
out
of
windows
at
distant
targets
and
were
not
conducted
with
respect
to
near
locomotor
surfaces.
Here
we
measure
perceived
gaze
declination
toward
a
locomotor
surface
as
an
initial
direct
test
of
the
scale‐expansion
model.
A
note
on
the
numeric
estimation
of
orientation
In
Experiments
1,
3
and
4
we
chose
to
use
verbal
numeric
methods
as
a
fairly
direct
way
of
measuring
perceptual
experience
in
terms
of
angular
variables.
Unlike
many
forms
of
perceptual
scaling,
numeric
estimates
of
orientation
in
degrees
come
with
a
built‐in
scale.
That
is,
educated
adults
know
that
the
range
of
orientations
between
horizontal
and
vertical
constitutes
0‐90°
and
that
a
45°
orientation
represents
the
mid‐ point
between
horizontal
and
vertical.
Thus,
unlike
estimates
of
loudness,
brightness,
length,
pain,
etc.,
it
is
possible
to
assume
that
people
share
a
common
conceptual
scale
of
orientation,
with
fixed
numeric
anchors.
Although
all
methods
of
measurement
may
be
biased
(e.g.,
by
demand
characteristics
of
experiments,
Durgin,
Baird,
Greenburg,
Russell,
Shaughnessy
&
Waymouth,
2009),
we
have
found
numeric
orientation
estimates
to
be
remarkably
robust
as
measures
of
the
perceptual
experience
of
slant
(Durgin,
Li
&
Hanal,
2010;
Hajnal
et
al.,
2010;
Li
&
Durgin,
2009,
2010,
2011).
For
example,
they
have
proven
resistant
to
variations
in
the
range
of
stimuli
presented
(Hajnal
et
al.,
2010)
and
are
consistent
with
non‐verbal
probes,
such
as
angle
bisection
(Durgin,
Li
&
Hajnal,
2010)
and
even
with
implicit
measures
of
slant,
such
as
aspect
ratio
judgments
for
slanted
configurations
(Li
&
Durgin,
2010).
In
their
study
of
perceived
geographical
slant,
Durgin,
Li
and
Hajnal
(2010)
showed
that
numeric
estimates
of
slant
made
relative
to
vertical
were
largely
indistinguishable
from
those
made
relative
to
horizontal,
and
corresponded
well
with
non‐verbal
measures
of
the
perceived
slant
that
was
judged
to
be
midway
between
vertical
and
horizontal.
That
is
one
group
of
people
judged
a
surface
of
about
35°
(from
horizontal)
to
be
45°
from
vertical,
another
group
judged
it
to
be
45°
from
horizontal,
and
non‐verbal
psychometric
measurement
in
a
third
group
indicated
that
a
surface
of
about
34°
from
horizontal
appeared
equidistant
from
vertical
and
horizontal.
This
shows
that
perceived
slant
is
biased,
but
that
verbal
and
non‐verbal
assessments
are
largely
in
agreement
about
the
magnitude
of
the
bias.
Thus,
numeric
estimates
of
orientation
seem
to
be
fairly
unbiased
measures
of
a
biased
perceptual
experience.
In
Experiment
2
of
the
present
study
we
collected
angle
bisection
data
to
verify
the
generality
of
this
conclusion
3
regarding
numeric
angular
estimation
with
respect
to
perceived
gaze
declination.
Experiment
1:
Scale
expansion
in
the
perceived
declination
of
gaze
As
a
direct
measure
of
explicitly
perceived
gaze
declination,
we
had
standing
participants
judge
their
gaze
declinations
toward
a
small
ball
placed
at
various
locations
along
the
ground.
We
used
a
grass
field
slanted
by
6°
to
discourage
the
use
of
cognitive
trigonometric
strategies
based
on
perceived
distance
or
on
perceived
optical
slant.
Method
Participants.
Twenty
undergraduates
(10
male)
participated
for
payment.
Stimulus.
The
viewing
target
was
a
white
golf
ball
(4.3
cm
in
diameter)
viewed
while
standing
on
a
slanted
field.
Eight
target
locations,
ranging
from
2
to
9
m
by
1
m
intervals
were
used
facing
in
both
the
uphill
and
the
downhill
direction
along
the
field.
Figure
2
shows
all
eight
of
the
target
locations
on
the
field.
The
range
of
gaze
declinations
tested
was
from
4
to
45°,
depending
on
participants’
eye‐heights
and
direction
of
hill
slope.
In
the
uphill
condition,
the
hill
surface
extended
above
the
eye‐heights
of
the
participants,
and
there
was
a
large
building
just
beyond
the
top
of
the
hill.
In
the
downhill
condition,
buildings
and
trees
were
visible
in
the
far
distance,
but
the
sloped
grass
field
extended
well
over
100
m
in
this
direction,
decreasing
in
slant
to
a
shallow
incline
at
the
far
end.
Thus,
no
true
horizon
was
visible
in
either
direction.
The
Task.
We
sought
to
have
participants
report
the
perceived
pitch
of
their
gaze
(relative
to
a
gravitationally‐defined
horizontal
framework)
while
looking
directly
at
the
target
ball.
Participants
were
briefly
instructed
that,
on
each
trial,
they
were
to
look
directly
at
the
ball
presented
on
the
grass
and
to
estimate
the
direction
of
their
gaze,
in
degrees,
relative
to
looking
straight
ahead
(i.e.,
horizontal
gaze).
It
was
explained
that
looking
straight
ahead
would
be
0°
and
looking
down
at
one’s
feet
would
be
90°.
In
previous
studies
(e.g.,
Li
&
Durgin,
2009)
we
have
found
that
people
are
able
to
report
on
proprioceptive
angular
variables
such
as
perceived
gaze
declination
and
head
orientation
(e.g.,
with
eyes
closed).
It
is
possible
that
some
participants
construed
the
task
as
judging
the
angular
declination
of
the
ball,
but
our
instruction
was
to
judge
gaze
direction.
Design.
On
each
trial,
participants
estimated
their
gaze
declination
toward
a
ball
placed
in
front
of
them
on
a
slanted
grass
field.
Only
one
ball
was
visible
at
a
time.
Participants
made
verbal
estimates
of
their
direction
of
gaze
while
looking
at
the
ball.
Numeric
estimates
were
collected
in
each
of
two
blocks
of
trials,
with
the
first
block
considered
as
practice
at
the
task.
In
each
block,
the
eight
distances
were
tested
in
random
order
with
the
constraint
that
the
4
Perceptual
Scale
Expansion
Figure
2.
All
eight
target
locations
in
the
uphill
condition
of
Experiment
1.
Only
one
target
was
visible
at
a
time.
initial
trial
was
neither
the
closest
(2
m)
nor
the
farthest
(9
m)
distance.
Males
and
females
were
separately
randomly
assigned
to
practice
the
task
either
looking
up
or
down
the
hill.
All
participants
then
made
eight
analyzed
estimates
facing
in
the
opposite
direction
from
the
one
used
during
practice.
Procedure.
On
each
trial,
one
experimenter
placed
the
ball
on
a
concealed
tee
at
the
target
location
while
the
participant
faced
the
other
way.
The
participant
was
instructed
to
turn
and
make
the
judgment
after
the
experimenter
left
the
field.
A
second
experimenter
gave
these
instructions
and
recorded
verbal
estimates.
After
making
8
practice
judgments
the
participant
was
led
on
a
circuitous
path
to
the
other
end
of
the
field
to
do
the
task
from
a
new
vantage
point.
After
this,
he
or
she
was
taken
to
an
indoor
location
where
a
structured
interview
was
conducted
and
standing
eye‐height
was
measured.
Interview.
The
interview
asked
about
three
main
topics
concerning
(i)
the
apparent
slope
of
the
field
and
beliefs
about
whether
slopes
look
different
than
they
are,
(ii)
participants’
beliefs
about
the
design
and
purpose
of
the
experiment
including
the
range
of
distances
tested
(estimated
in
feet),
and
(iii)
strategies
used
by
participants
when
doing
the
task.
Participants
were
asked
at
the
end
if
they
golfed
or
skied
because
these
sports
often
lead
to
expertise
in
estimating
distance
and
slope
respectively
(Ross,
1974).
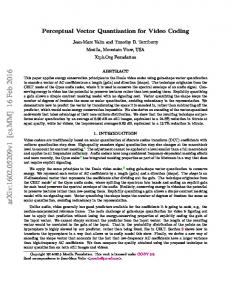
Results
The
gaze
estimation
data
of
three
participants
(1
male)
were
eliminated
from
analysis
because
it
became
clear
during
the
interview
that
they
had
misunderstood
or
disregarded
the
instructions
(i.e.,
were
trying
to
give
estimates
of
geographical
surface
slant
or
of
optical
slant
rather
than
of
gaze
declination).
The
measured
eye‐ heights
of
the
remaining
participants
were
used
to
compute
their
true
angle
of
gaze
to
the
8
ball
locations
based
on
detailed
measurement
of
elevations
of
these
locations.
The
gaze
estimation
data
of
one
further
participant
was
excluded
because
her
estimates
were
found
to
be
uncorrelated
with
her
actual
gaze
declinations
(r
=
‐.14,
p
>
.20),
whereas
these
variables
were
highly
reliably
correlated
for
each
of
the
other
participants.
The
complete
data
(128
estimates)
and
a
best‐fitting
(dotted)
line
are
shown
in
Figure
3.
The
slope
of
this
line
indicates
a
gain
of
1.53,
suggesting
that
there
is
indeed
scale
expansion
of
perceived
gaze
declination
when
observing
a
locomotor
ground
surface.
It
is
worth
noting
that
some
of
the
between‐subject
variability
in
the
individual
estimates
is
probably
due
to
efforts
at
“consistency”
(a
principle
mentioned
by
10
participants
during
the
interviews).
For
example,
the
four
highest
estimates
in
the
downhill
condition
are
due
to
one
individual
who
gave
a
very
high
initial
estimate,
and
then
tried
(as
revealed
later)
to
maintain
“consistency”
with
her
initial
estimate.
Her
individual
gain
was
1.50,
but
the
intercept
of
her
estimates
was
30.9°
(which
is
strikingly
similar
to
naïve
estimates
of
the
slope
of
the
hill).
When
the
slopes
of
individual
fit
lines
were
computed
for
each
participant,
the
median
gain
was
1.46
(M
=
1.45;
SE
=
0.12).
However,
the
median
intercept
was
9.6°
(M=9.1°;
SE
=
4.0°),
which
suggests
that
participants
overestimated
the
angular
height
of
the
horizontal
in
this
experimental
setting,
which
may
be
related
to
the
fairly
steep
hill
on
which
it
took
place.
The
1.5
gain
cannot
be
explained
by
constant
errors
in
perceived
eye
level
(Matin
&
W.
Li,
1992;
O’Shea
&
Ross,
2007;
Shebilske,
1986),
which
would
produce
a
constant
shift.
However,
to
test
for
effects
of
surface
slant
on
gaze
estimates,
separate
smoothed
fit
lines
were
computed
from
the
uphill
and
downhill
estimates
using
local
(quadratic)
polynomial
fits
in
the
KernSmooth
library
(S
original
by
Matt
Wand.
R
port
by
Brian
Ripley,
2009)
in
R
(R
Core
Development
Team,
2007),
with
a
bandwidth
of
8°.
The
two
smoothed
lines
in
Figure
3
represent
fits
to
the
estimates
facing
up
the
slanted
field
(filled
circles)
and
estimates
facing
down
the
slanted
field
(open
circles).
These
smoothed
lines
do
not
seem
to
depart
dramatically
from
the
linear
fit
(dotted
line)
nor
from
each
other,
though
they
are
consistent
with
a
small
shift
in
perceived
eye‐level,
such
as
has
been
reported
when
viewing
slanted
surfaces
(O’Shea
&
Ross,
2007).
In
the
structured
interview
following
the
main
experiment
we
determined
that
eight
participants
were
skiers
or
had
otherwise
acquired
expert
knowledge
about
errors
in
slope
perception
and
that
four
were
golfers
who
might
be
expected
to
have
expertise
judging
distance
on
grass.
Estimates
of
the
surface
orientation
of
the
field
from
memory
given
by
slope
experts
(17°)
were
reliably
less
than
those
of
the
naïve
participants
(33°),
t(18)
=
2.51,
p
=
0.021,
but
their
gaze
declination
estimates
still
demonstrated
a
gain
of
1.5.
It
is
likely
that
5
60 40 20 0
Estimated Gaze Angle (deg)
80
Durgin
&
Li
0
10
20
30
40
50
Actual Gaze Angle (deg)
Figure
3.
Gaze
declination
estimates
in
Experiment
1
as
a
function
of
true
declination.
Filled
circles
are
judgments
of
observers
facing
up
the
hill;
empty
circles
represent
judgments
made
while
facing
down
the
hill.
Smoothed
fit
lines
for
the
two
conditions
are
shown,
as
is
an
overall
linear
fit
(dotted
line)
with
an
intercept
of
6.9°
and
slope
of
1.53.
expertise
with
verbal
geographical
slant
estimation
can
lead
to
cognitive
correction
without
altering
the
underlying
perceptual
coding
(Granrud,
2009).
Misperception
of
gaze
declination
by
a
factor
of
1.5
should
cause
egocentric
distances
along
the
ground
to
be
underestimated
by
a
factor
of
about
0.7
(such
as
has
been
reported
by
Foley
et
al.,
2004).
When
asked
to
estimate
the
farthest
ball
distance
presented,
non‐ golfers’
mean
verbal
estimates
from
memory
(6.4
m)
were
consistent
with
this
prediction,
and
were
reliably
less
than
the
actual
distance
of
9
m,
t(15)
=
2.93,
p
=
0.01.
Golfers,
in
contrast,
gave
a
mean
estimate
of
the
farthest
distance
of
10.3
m.
Nonetheless,
their
perceptual
gain
for
gaze
declination
(1.7)
did
not
differ
reliably
from
1.5.
In
addition
to
underestimating
the
farthest
distances
by
a
factor
of
0.7,
non‐golfers
underestimated
the
nearest
ball
distance
from
memory
with
a
mean
of
1.17
m
(60%
of
the
true
2
m),
whereas
the
average
near
estimate
of
the
four
golfers
was
1.68
m
(84%).
Again,
we
suppose
that
the
improved
distance
estimates
of
golfers
are
probably
due
to
cognitive
calibration
based
on
explicit
feedback
available
on
golf
courses,
rather
than
to
changes
in
their
perceptual
experience
of
distance.
Discussion
The
exaggeration
of
perceived
gaze
declination
is
consistent
with
the
idea
that
gaze
declination
is
a
powerful
source
of
egocentric
distance
information
(Ooi
et
al.,
2001).
Whereas
walking
without
visual
feedback
to
previewed
targets
is
typically
accurate
for
distances
of
up
to
20
m
(Loomis
et
al.,
1992),
such
accurate
action
may
result
from
the
calibration
of
action
based
on
internal
forward
models
of
the
distorted
perceptual
experience
implied
by
our
data
(Durgin,
2009;
Davidson
&
Wolpert,
2004).
If
action
systems
can
code
locomotor
distances
in
terms
of
angular
deviations
of
gaze,
scale
expansion
in
the
coding
of
gaze
declination
will
increase
the
precision
of
distance
coding
for
action
even
though
the
explicit
estimation
of
linear
extent
is
compressed.
Here
we
have
shown
that
judgments
of
the
perceived
declination
of
gaze
are
consistent
with
functional
scale
expansion
(by
a
factor
of
1.5)
in
the
perceived
declination
of
gaze.
We
have
further
observed
that
cognitive
expertise
regarding
estimating
geographical
slant
or
estimating
distance
did
not
seem
to
affect
estimates
of
gaze
declination
even
though
it
did
affect
estimates
of
geographical
surface
slant
and
of
distance.
Experiment
2:
Nonverbal
confirmation
of
gaze
declination
error:
A
bisection
task
To
confirm
that
our
numeric
estimation
technique
was
not
simply
biasing,
we
conducted
a
second,
non‐verbal
experiment
with
new
observers
in
which
we
had
them
stand
at
different
elevations
and
control
the
horizontal
distance
to
a
ball
while
attempting
to
position
it
at
the
gaze
declination
that
appeared
to
them
to
bisect
horizontal
and
vertical
gaze.
Based
on
a
gain
of
about
1.5,
we
would
expect
the
perceived
(45°)
bisection
point
to
be
about
30°
below
horizontal,
depending
on
the
intercept.
The
outdoor
context
for
the
present
experiment
was
a
level
ground
surface,
rather
than
a
6
Perceptual
Scale
Expansion
Gaze Declination at Bisection (°)
sloped
one,
and
the
ball
was
therefore
suspended
to
discourage
distance‐based
strategies.
Methods
Participants.
Sixteen
undergraduate
students
(8
male)
participated.
Design.
Participants
made
adjustments
at
each
of
three
eye‐heights:
Normal
standing
eye‐height,
elevated
by
0.93
m,
and
elevated
by
2.75
m.
The
judgments
were
made
with
respect
to
a
ball
that
was
presented
at
an
elevation
of
0.59
m
above
the
ground
in
order
to
discourage
attempts
at
height/distance
matching.
For
half
the
participants
the
ball
distance
was
initially
set
to
a
position
corresponding
to
a
declination
of
about
30°.
For
the
other
half,
it
was
always
initially
set
to
a
distance
corresponding
to
a
declination
of
about
45°.
Participants
adjusted
the
ball
location
until
the
ball
appeared
to
be
at
a
gaze
declination
that
bisected
the
angular
distance
between
horizontal
and
vertical
(i.e.
subjectively
45°
below
horizontal).
It
was
anticipated
that
the
apparent
bisection
point
would
be
set
closer
to
a
physical
declination
of
30°
than
to
45°.
Trial
order
was
randomized.
A
single
trial
was
conducted
at
each
eye‐ height.
Apparatus.
Participants
used
a
lever
to
control
a
small
robotic
vehicle
that
carried
a
white
foam
ball
(7.5
cm
in
diameter)
on
a
support
that
elevated
its
center
59
cm
above
the
ground.
Viewer
elevations
other
than
normal
eye‐height
were
obtained
by
having
participants
stand
on
the
end
of
a
set
of
bleachers
at
two
different
elevations.
The
ground
was
a
flat
grassy
lawn
facing
a
large
building
30
m
away.
Procedure.
Each
participant
drove
the
robotic
vehicle
forward
or
back
until
satisfied
that
the
direction
of
their
gaze
to
the
suspended
ball
was
45°
below
horizontal
(i.e.,
that
bisected
the
angle
between
horizontal
and
vertical).
A
measurement
was
then
taken
of
the
ball
position
using
a
laser
range
finder,
and
the
participant
moved
to
a
new
position
and
turned
their
back
while
the
next
trial
was
readied.
A
brief
interview
was
conducted
at
the
end
to
ensure
that
participants
had
understood
the
instructions.
Standing
eye‐height
was
measured
at
the
conclusion
of
the
experiment.
Results
and
Discussion
Each
adjustment
was
converted
to
an
actual
angle
of
gaze
declination
based
on
trigonometry
of
the
measured
distance
and
eye‐height.
The
mean
settings
are
plotted
by
elevation
in
Figure
4.
A
repeated
measures
ANOVA
found
a
reliable
effect
of
viewing
elevation,
F(2,28)
=
50.0,
p