Keywords. Virtual Machine, Live Migration, Performance Model, Energy. 1. INTRODUCTION ... physical hosts can be decommissioned to save energy. Previous.
Performance and Energy Modeling for Live Migration of Virtual Machines Haikun Liu†‡, Cheng-Zhong Xu‡, Hai Jin†, Jiayu Gong‡, Xiaofei Liao† †
School of Computer Science and Technology Huazhong University of Science and Technology Wuhan, 430074, China
{hjin, xfliao}@hust.edu.cn
ABSTRACT Live migration of virtual machine (VM) provides a significant benefit for virtual server mobility without disrupting service. It is widely used for system management in virtualized data centers. However, migration costs may vary significantly for different workloads due to the variety of VM configurations and workload characteristics. To take into account the migration overhead in migration decisionmaking, we investigate design methodologies to quantitatively predict the migration performance and energy cost. We thoroughly analyze the key parameters that affect the migration cost from theory to practice. We construct two application-oblivious models for the cost prediction by using learned knowledge about the workloads at the hypervisor (also called VMM) level. This should be the first kind of work to estimate VM live migration cost in terms of both performance and energy in a quantitative approach. We evaluate the models using five representative workloads on a Xen virtualized environment. Experimental results show that the refined model yields higher than 90% prediction accuracy in comparison with measured cost. Model-guided decisions can significantly reduce the migration cost by more than 72.9% at an energy saving of 73.6%.
Categories and Subject Descriptors C.4 [Performance of Systems]: Modeling techniques; D.4.8 [Operating Systems]: Performance – Modeling and prediction
General Terms Measurement, Performance, Design, Experimentation.
Keywords Virtual Machine, Live Migration, Performance Model, Energy.
1. INTRODUCTION Virtualization [8, 23] is a rapidly evolving technology that provides a range of benefits to computing systems, such as improved resource utilization and management, application isolation and portability, and system reliability. Among these features, live migration is a core Permission to make digital or hard copies of all or part of this work for personal or classroom use is granted without fee provided that copies are not made or distributed for profit or commercial advantage and that copies bear this notice and the full citation on the first page. To copy otherwise, or republish, to post on servers or to redistribute to lists, requires prior specific permission and/or a fee. HPDC’11, June 8–11, 2011, San Jose, California, USA. Copyright 2011 ACM 978-1-4503-0552-5/11/06...$10.00.
‡
Department of Electrical and Computer Engineering Wayne State University Detroit, MI, 48202, USA
{hkliu, czxu, jygong}@wayne.edu
function to replace running VMs seamlessly across distinct physical hosts [10, 25]. It has become an extremely powerful tool for system management in a variety of key scenarios, such as VM load balancing [33], fault tolerance [24], power management [26] and other applications[20, 29]. VM live migration technology has attracted considerable interest for data center management and cluster computing in recent years [10, 18, 22, 25]. Representative works include XenMotion [10] and Vmotion [25] which were implemented as build-in tools in their virtualization platforms. There were also many other studies on the migration strategy for a variety of application cases, concerning the issues of where and when a VM should be migrated [14, 28, 31, 33]. However, few studies are available on the issue of which VM should be the best candidate for cost-efficient migration. For example, for the purpose of load balancing in a virtual cluster, all the VMs hosted by an overloaded physical node would be potential candidates for migration. However, different migration choices may lead to significant differences in performance and energy consumption. Considering migration downtime, previous studies demonstrated that it could vary significantly between different workloads, ranging from 60 milliseconds for a Quake 3 game server to 3.5 seconds in the case of a diabolical workload MMuncher [10]. This is mostly due to the diversity of VM configurations and workload characteristics. For instance, the initial memory size of a VM and applications’ memory access pattern are critical factors that have a decisive effect on the migration latency, i.e. the total time a VM is undergoing performance penalty and high power state. Power management is another increasingly important case for live VM migration. A rationale behind is that light loaded VMs can be consolidated into fewer physical hosts so that the offloaded physical hosts can be decommissioned to save energy. Previous studies demonstrated the effectiveness of this policy to achieve significant power saving [13, 17]. However, the previous works mostly focused on the schemes of VM placement with performance constrains [21, 31]. There was little work concerning about both the performance and energy costs during the consolidation actions. In this paper, we model the VM migration performance based on theoretical analysis and empirical studies on Xen platform. In wired network environments, we experimentally verify that the migration energy consumption is proportional to the data volume of network traffic due to VM migration. We design a detailed analytical model to estimate the migration performance by scrutinizing Xen’s live migration algorithm. We obtain some semantic knowledge about the workloads at the VMM level and train the model parameters using linear regression technology. The model reads the statistical data of memory updating and other performance parameters collected on
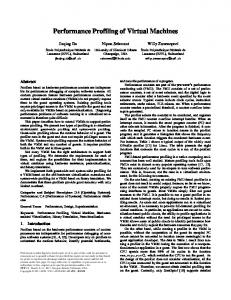
Figure 1. Live migration algorithm performs pre-copying in iterative rounds. real workloads, and simulates the migration process to predict the migration cost. The experimental results demonstrate that our models are able to predict the migration performance and energy with an accuracy of more than 90% on five representative workloads. The contributions of this paper are summarized as follows: 1) This is the first kind of work to quantitatively model VM migration costs in terms of both performance and energy. The models would facilitate the design of optimal migration strategies. 2) We analyze the challenges of modeling the energy consumption of a VM migration and construct an applicationoblivious high-level energy model with high prediction accuracy. 3) We validate the models by conducting a large set of experiments. The comprehensive evaluation results demonstrate the effectiveness of model-guided live migration in both performance and energy costs. The remainder of the paper is organized as follows. Section 2 gives a brief introduction to our groundwork. Section 3 presents the design of our two models for prediction of migration performance and energy consumption. Section 4 describes the implementation details of our prototype for model validation. Section 5 presents the evaluation methodologies and experimental results. Section 6 discusses about the related work. Finally, we conclude our work in Section 7.
2. LIVE VM MIGRATION Live VM migration technologies have proven to be a very effective tool to enable data center management in a non-disruptive manner. Both Xen and VMware adopts pre-copying algorithm for VM live migration in a memory-to-memory approach [10, 25], as shown in Figure 2. In the approach, physical memory image is pushed across network to the new destination while the source VM continues running. Pages dirtied during the migration must be iteratively re-sent to ensure memory consistency. By iterative it means that pre-copying occurs in several rounds and the data to be transmitted during a round are the dirty pages generated in the previous round. The precopying phase terminates 1) if the memory dirtying rate exceeds the memory transmission rate; or 2) if the remaining dirty memory becomes smaller than a pre-defined threshold value; or 3) if the number of iterations exceeds a given value; or 4) the network traffic exceeds a multiple of the VM memory size. After several rounds of synchronization, a very short stop-and-copy phase is performed to transmit the remaining dirty pages. As the data transferred is relatively small, this mechanism results in a nearly negligible best-case migration downtime. We note that the performance of live VM migration is affected by many factors. First of all, the size of VM memory has a main effect on the total migration time and network traffic. Secondly, the memory dirtying rate, which reflects the memory access pattern of different applications, impacts the number of iteration rounds and
Table 1. Parameters for performance and energy models of VM live migration. Vmem Current size of VM memory during migration. Total network traffic during migration. Vmig Migration latency, i.e., total migration time. Tmig Tdown Application downtime during migration. Memory transmission rate during migration. R Memory dirtying rate during migration. D Threshold value of the remaining dirty memory that Vthd should be transferred at the last iteration. Writable Working Set, it defined as a certain set of W “hot” pages that will be written frequently.
data transferred in each pre-copying round, and hence indirectly affects the migration time and network traffic. Thirdly, the network transmission rate together with the configuration of migration algorithm is also crucial to migration performance. However, migration performance varies significantly depending on the workload characterization even when other conditions remain the same. For instance, migration of a VM running memory-intensive applications would lead to more performance degradation in terms of network traffic, migration downtime and latency.
3. PERFORMANCE AND ENERGY MODELS A primary goal of our models is to determine which VM should be migrated within a server farm with minimum migration cost. This is complementary to other issues like minimizing physical resource consumption without compromising service level agreements (SLA) [21, 31], and the issue of when a VM should be migrated and to which host [33]. A key point for cost-aware migration decision is how to accurately predict the performance and energy consumption of each VM migration in a server farm.
3.1 Base Model of Migration Performance Modeling the performance of migration involves several factors: the size of VM memory, the workload characteristic (denotes the memory dirtying rate), network transmission rate, and the migration algorithm (different configurations of migration algorithm means great variations of migration performance). The most challenge is characterizing the memory access pattern of each running workloads correctly. In Table 1, we define a number of key parameters and their notations for our performance and energy models. Live VM migration achieves negligible application downtime by iteratively pre-copying the pages dirtied at previous round of transmission. Assume the precopying algorithm proceeds in n rounds. We denote the data volume transmitted at each round as Vi (0≤i≤n), and the elapsed time at each transferring round as Ti (0≤i≤n). V0 is equivalent to the VM memory size Vmem. T0 represents the time consumed to transfer the data of VM memory image and Ti is the time to transfer the dirty memory generated during previous rounds. The data transmitted in round i can be calculated as:
V , if i 0; Vi mem D Ti 1 , otherwise. The elapsed time at each round can be calculated as:
(1)
D Ti 1 Vmem D i . (2) R R i 1 At first, we consider the scenario that the memory dirtying rate is smaller than the memory transmission rate on average. Let denote the ratio of D to R: Ti
D/ R.
(3)
Combining equations (1), (2) and (3), we have the network traffic during the round i:
Vi D
Vmem i 1 Vmem i . R
(4)
Then the total network traffic during the migration can be summed up as: n
Vmig Vi Vmem i 0
1 n 1 . 1
(5)
Combining equations (2) and (3), we have the migration latency: n
Tmig Ti i 0
Vmem 1 n 1 . 1 R
(6)
Because Tmig is the duration of migration that has negative effect on the performance of running applications, it is a key performance metric for migration decision. Now, we analyze the migration downtime caused in the whole migration process. It is composed of two parts: the time the remaining dirty pages are transferred during the stop-and-copy phase, denoted as Tn; and the other time that is spent on VM resuming at the destination host, denoted as Tresume. The second part has little variation and can be represented as a constant; we set it to 20ms in our experiments. Then the migration downtime can be represented as:
Tdown Tn Tresume .
(7)
To evaluate the convergence rate of VM migration algorithm, we can calculate the total rounds of the iteration by the inequality Vn Vthd . It is the condition when the iterative pre-copying should be terminated. From equation (4), it follows Vmem n Vthd . As a result, the number of pre-copying iteration becomes:
V (8) n log thd . Vmem For a given VM, the memory size Vmem and Vthd (determined by migration algorithms) are fixed. Consequently, the iterative precopying would converge faster if is smaller. We therefore refer to as the convergence coefficient of live VM migration. From the above analyses, we conclude that a VM with smaller size of memory image and smaller would generate less network traffic and lead to shorter migration latency, hence should be a better candidate for migration. Second, we consider the scenario that the average memory dirtying rate is even larger than the memory transmission rate. According to equation (4), the data transferred in each pre-copying round Vi would even exceed the VM memory size Vmem. This is not applicable in our model. However, the migration algorithm implemented in Xen is able to solve this issue by harnessing the statistical information of dirty memory. It is known that every workload exhibits a set of ‘hot’ pages which would be updated extremely frequently, so called Writable Working Set (WWS) [10]. These pages are often used for the stack and local variables of the running processes as
well as pages allocated for network and disk buffer. The hottest pages would be dirtied as fast as the migration daemon can transfer them, and hence should be skipped during the iterative pre-copying. Their transfer is postponed till the final stop-and-copy phase. In practice, the migration algorithm periodically peeks the current round’s dirty bitmap and retains the pages that are dirtied in two consecutive peeking periods. For most of workloads, we observed that the size of WWS is approximately proportional to the pages dirtied in each pre-copying round. That is
Wi = γ Vi ,
(9)
where γ is the ratio correlating with the memory dirtying rate and the duration of each iteration. We characterize this relationship in a linear equation model:
= Ti 1 D ,
(10)
where , and are the model coefficients to be learned. Taking multiple observations of the equation allows estimating the model parameters using learning techniques such as linear regression. We estimate the model coefficients by running DaCapo [9] benchmark, which consists of a suit of Java applications. Some applications generate non-trivial memory loads. We trained our model by executing the migration of each application one by one. The trained model with these workloads should be able to embody the memory access patterns of a large variety of applications. During each migration, we track the amount of dirtied pages and skipped pages in each round of pre-copying to calculate the value of γ. With the elapsed time and memory dirtying rate of each precopying round, we can build a set of independent equations based on the experimental results. Finally we derive the value of each parameter, = 0.0463Ti 1 0.0001D 0.3586 , where Ti-1 is normalized by second and D is normalized by MB/sec. There are a number of approaches to evaluate how well the model fits the practice. Amongst them, the coefficient of determination is a widely used term, denoted as R-square statistic. The model is better as the R2 is closer to 1. The R2 value of this model is 0.843. Based on the above analysis, our migration performance model can be shown in Algorithm 1. All input variables can be measured from practical workloads. The size of VM memory Vmem can be obtained from xenstore, which is an information storage space shared between VMs and somewhat similar in spirit to procfs. The Vthd and max_round are determined by the configuration of migration algorithm. The memory dirtying rate D can be measured before the VM migration decision, and the value of memory transmission rate R can be configured according to the observed value of D. The detailed measurement of D and R is described in Section 4.
3.2 Refined Model of Migration Performance The base model discussed in the preceding section achieves good estimates when the observed memory dirtying rate holds steady. However, in a data center, most of workloads are service-oriented and heterogeneous. The memory access pattern of each application may vary in response to the change of the service requests. In such cases, cost estimation may cause more deviation if the model only uses on-line sampled parameter values. When a VM is in migration, the migration daemon will continuously track the dirty pages to direct the memory pre-copying. Moreover, it also logs other statistical information such as data transmission rate, memory dirtying rate in each round of iteration. The data represents a long-term application characteristic in the whole execution of migration. This means that we can employ the historical data
Algorithm 1: Performance Model of VM Migration 1. 2. 3. 4. 5. 6. 7. 8. 9. 10. 11. 12. 13. 14. 15. 16.
Input: Vmem, Vthd , D, R Output: Vmig, Tmig, Tdown let V0 ←Vmem /*data transferred at first round*/ for i = 0 to max_round do Ti ←Vi / R γ ←a Ti + b D+c Wi+1 ← γ Ti D Vi+1 ←Ti D – Wi+1 if Vi+1 Vi then Vi+1 ←Ti D /*data transferred at last round*/ Ti+1 ←Vi+1 / R Tdown ← Ti+1 + Tresume break end if end for
Vmig
Tmig
max_ round
Vi
Ti
i 0 max_ round
i 0
to refine our model when the VM needs to migrate again. We can represent the average memory dirtying rate during a migration with the weighted arithmetic mean of D in each round of pre-copying:
D
D T T i
i
.
(11)
i
Considering the scenario that a VM may migrate many times, we use exponential weighted moving average (EWMA) to describe the current memory dirtying rate. This is a popular method to estimate a non-deterministic variable (such as RTT estimation in computer networks [11]). Combining the statistical data counted from the most recent migration and historical records, it becomes:
Dm D m (1 ) Dm 1 ,
(12)
where m represents the number of migration times in a VM’s lifecycle, and denotes the weight of observation value from most recent migration, its value should be larger than 0.5 so that the synthesized value should always represent the current workload characteristic. Combining the historical logs with on-line sampled data, we can calculate the refined value of D as following: ~
D m S m (1 ) Dm 1 ,
(13)
where 0<