are the new service functionality and the improved performance offered by ...
performance and offer additional functionality to networking applications.
Multicast ...
Performance and Functionality in Overlay Networks
by
Claudiu Danilov
A dissertation submitted to The Johns Hopkins University in conformity with the requirements for the degree of Doctor of Philosophy.
Baltimore, Maryland September, 2004
c Claudiu Danilov 2004
All rights reserved
Abstract Overlay networks create virtual topologies on top of the existing networking infrastructure and come as a middle layer between end-user applications and the basic network services. The main reasons of using an intermediate level of communication are the new service functionality and the improved performance offered by application specific protocols that can be deployed in overlay networks. This thesis explores the benefits offered by overlay networks and introduces new mechanisms that improve performance and offer additional functionality to networking applications. Multicast services are rarely used today, mainly due to scalability and security concerns. An overlay architecture addresses these issues by moving the service management and deployment above the network infrastructure. We present an architecture for transparent overlay multicast and an optimal distributed flow control for reliable multicast in overlay networks that scales with the number of participants and groups. Even though capacity grows exponentially over time, latency is difficult to improve. We present an overlay approach that can substantially decrease the number of delayed packets in wide area reliable communication and increase the delivery ratio of best effort communication, leading to improved performance in time-sensitive applications such as Voice over IP. Advisor: Readers:
Dr. Dr. Dr. Dr.
Yair Amir Yair Amir Stuart Goose Andreas Terzis
ii
Acknowledgements I am deeply indebted to my advisor, Dr. Yair Amir, for his tremendous support over the years at Hopkins, for his guidance through my entire work, and for always being so open with me. Yair shaped not only my research, but also my goals, my skills, and my attitude towards the academic life. I am deeply grateful to Dr. Andreas Terzis who brought to my research the networking side that was so much needed. Andreas was always available to me with invaluable advice and ideas that successfully materialized into my work. My gratitude to Dr. Stuart Goose has no bounds, as his kindness and support are really unique. Stuart greatly influenced my research by introducing me to Voice Over IP, opening up a new direction in which I enjoyed so much working with him. I thank Dr. Gerald Masson for good advice I could always count on. From guiding me through my first years at Hopkins to discussing my future career decisions, he greatly influenced my professional life. I also thank Dr. Baruch Awerbuch for adding a theoretical touch to my work, and for the numerous insightful discussions we had in the lab. I would like to thank Michal Miskin-Amir for giving me very useful career advice and excellent comments on the papers I was involved with. The Center for Networking and Distributed Systems is the environment in which I defined and shaped my research, my abilities, and my goals. I would like to thank Dr. R. Sean Borgstrom, Ryan Caudy, Jacob Green, Yan Gu, Mike Hilsdale, Dave Holmer, Michael Kaplan, Jon Kirsch, John Lane, Ashima Munjal, Raluca Musaloiu-Elefteri, Dr. Cristina Nita-Rotaru, Sophie Qiu, Nilo Rivera, Herb Rubens, iii
Theo Schlossnagle, John Schultz, Dr. Jonathan Stanton, Ciprian Tutu and Chuck Wu for being an excellent team, and for working together on many ideas over the years. I also thank my other friends at Hopkins that made my life enjoyable and fun: Dr. Silviu Cucerzan, Reza Curtmola, Dr. Radu Florian, Dr. Lidia Mangu and Razvan Musaloiu-Elefteri. My research career started at the National Institute for Research and Development in Bucharest, Romania. I would like to thank Dr. Florin Hartescu, the head of the Real-Time Systems Lab, for his strong support during my first steps in the research world.
iv
Contents Abstract
ii
Acknowledgements
iii
List of Figures
vii
List of Tables
ix
1 Introduction 1.1 1.2
1
Highlights and Contributions . . . . . . . . . . . . . . . . . . . . . . . . . .
2
1.1.1
Thesis Organization . . . . . . . . . . . . . . . . . . . . . . . . . . .
5
Related Work . . . . . . . . . . . . . . . . . . . . . . . . . . . . . . . . . . .
6
2 Spines, An Overlay Network Platform
11
2.1
Overlay networks . . . . . . . . . . . . . . . . . . . . . . . . . . . . . . . . .
11
2.2
Spines . . . . . . . . . . . . . . . . . . . . . . . . . . . . . . . . . . . . . . .
13
2.2.1
The Spines software architecture . . . . . . . . . . . . . . . . . . . .
14
2.2.2
Spines overhead . . . . . . . . . . . . . . . . . . . . . . . . . . . . . .
18
3 Scalable Multi-group, Multi-sender Overlay Multicast 3.1
20
Overlay multicast . . . . . . . . . . . . . . . . . . . . . . . . . . . . . . . . .
22
3.1.1
Group membership . . . . . . . . . . . . . . . . . . . . . . . . . . . .
22
3.1.2
Routing . . . . . . . . . . . . . . . . . . . . . . . . . . . . . . . . . .
23
Experimental results . . . . . . . . . . . . . . . . . . . . . . . . . . . . . . .
25
4 Global Flow Control for Many-to-many Reliable Multicast in Overlays
27
3.2
4.1
Background . . . . . . . . . . . . . . . . . . . . . . . . . . . . . . . . . . . .
29
4.2
Global flow control for wide area overlay networks . . . . . . . . . . . . . .
30
4.2.1
30
Algorithmic foundation . . . . . . . . . . . . . . . . . . . . . . . . . v
4.3
4.2.2
An online auction model . . . . . . . . . . . . . . . . . . . . . . . . .
33
4.2.3
Adapting the model to practice . . . . . . . . . . . . . . . . . . . . .
34
. . . . . . . . . . . . . . . . . . . . . . . . . . . . .
42
4.3.1
Router State Scalability . . . . . . . . . . . . . . . . . . . . . . . . .
42
4.3.2
Frequency of Cost Updates . . . . . . . . . . . . . . . . . . . . . . .
43
4.4
The Cost-Benefit protocol . . . . . . . . . . . . . . . . . . . . . . . . . . . .
44
4.5
Simulation results
. . . . . . . . . . . . . . . . . . . . . . . . . . . . . . . .
45
4.6
Simulation validation on an emulated wide area testbed . . . . . . . . . . .
51
4.7
Real-life Internet experiments . . . . . . . . . . . . . . . . . . . . . . . . . .
53
5 Reducing Latency in Reliable Communication Using Overlay Networks
55
5.1
Fairness and scalability
Hop-by-hop reliable communication in overlay networks . . . . . . . . . . .
56
5.1.1
Hop-by-hop reliability . . . . . . . . . . . . . . . . . . . . . . . . . .
56
5.1.2
End-to-end reliability and congestion control . . . . . . . . . . . . .
58
5.1.3
Fairness . . . . . . . . . . . . . . . . . . . . . . . . . . . . . . . . . .
61
5.2
Simulation Environment and Results . . . . . . . . . . . . . . . . . . . . . .
63
5.3
Experimental results . . . . . . . . . . . . . . . . . . . . . . . . . . . . . . .
68
6 Improving Quality of VoIP Using Overlay Networks 6.1
6.2
6.3
6.4
72
Background . . . . . . . . . . . . . . . . . . . . . . . . . . . . . . . . . . . .
75
6.1.1
Voice over IP . . . . . . . . . . . . . . . . . . . . . . . . . . . . . . .
75
6.1.2
Internet loss and failure characteristics . . . . . . . . . . . . . . . . .
76
6.1.3
Voice quality degradation with loss . . . . . . . . . . . . . . . . . . .
77
Protocols for increasing VoIP performance . . . . . . . . . . . . . . . . . . .
79
6.2.1
Real-time recovery protocol . . . . . . . . . . . . . . . . . . . . . . .
80
6.2.2
Real time routing for audio . . . . . . . . . . . . . . . . . . . . . . .
84
Routing limitations of overlay networks . . . . . . . . . . . . . . . . . . . .
87
6.3.1
Routing performance in Spines . . . . . . . . . . . . . . . . . . . . .
88
6.3.2
Case study: Planetlab . . . . . . . . . . . . . . . . . . . . . . . . . .
90
Integration with SIP in the the current Voice over IP infrastructure . . . . .
93
7 Conclusions
95
Bibliography
97
Vita
106
vi
List of Figures 2.1
An overlay network example . . . . . . . . . . . . . . . . . . . . . . . . . . .
12
2.2
A Spines overlay . . . . . . . . . . . . . . . . . . . . . . . . . . . . . . . . .
13
2.3
Spines software architecture . . . . . . . . . . . . . . . . . . . . . . . . . . .
15
3.1
Membership topology . . . . . . . . . . . . . . . . . . . . . . . . . . . . . .
25
3.2
Membership propagation delay . . . . . . . . . . . . . . . . . . . . . . . . .
25
4.1
Randomization effect on buffer utilization . . . . . . . . . . . . . . . . . . .
41
4.2
Scenario 1: Network Configuration . . . . . . . . . . . . . . . . . . . . . . .
45
4.3
Scenario 1, Simulation: Throughput . . . . . . . . . . . . . . . . . . . . . .
46
4.4
Scenario 1, Simulation: Buffers . . . . . . . . . . . . . . . . . . . . . . . . .
46
4.5
Scenario 2: Network Topology . . . . . . . . . . . . . . . . . . . . . . . . . .
47
4.6
Scenario 2, Simulation: Fairness . . . . . . . . . . . . . . . . . . . . . . . . .
47
4.7
Scenario 2, Simulation: Buffers with delayed senders . . . . . . . . . . . . .
47
4.8
Scenario 2, Simulation: Throughput with delayed senders . . . . . . . . . .
47
4.9
Scenario 3: Network Configuration . . . . . . . . . . . . . . . . . . . . . . .
49
4.10 Scenario 3, Simulation: Throughput . . . . . . . . . . . . . . . . . . . . . .
50
4.11 Scenario 3, Simulation: TCP throughput . . . . . . . . . . . . . . . . . . . .
50
4.12 Scenario 4: Network Topology . . . . . . . . . . . . . . . . . . . . . . . . . .
50
4.13 Scenario 4, Simulation: Buffers . . . . . . . . . . . . . . . . . . . . . . . . .
50
4.14 Scenario 1, Emulab: Sending throughput . . . . . . . . . . . . . . . . . . . .
51
4.15 Scenario 1, Emulab: Receiving throughput . . . . . . . . . . . . . . . . . . .
51
4.16 Scenario 2, Emulab: Sending throughput . . . . . . . . . . . . . . . . . . . .
53
4.17 Scenario 2, Emulab: Receiving throughput . . . . . . . . . . . . . . . . . . .
53
4.18 CAIRN: Network Topology . . . . . . . . . . . . . . . . . . . . . . . . . . .
54
4.19 CAIRN: Sending throughput . . . . . . . . . . . . . . . . . . . . . . . . . .
54
5.1
57
Chain Network Setup . . . . . . . . . . . . . . . . . . . . . . . . . . . . . . vii
5.2
TCP throughput (analytical model) . . . . . . . . . . . . . . . . . . . . . .
61
5.3
Average delay for a 500 Kbps stream (simulation)
. . . . . . . . . . . . . .
65
5.4
Average delay for a 1000 Kbps stream (simulation) . . . . . . . . . . . . . .
65
5.5
Average jitter for a 500 Kbps stream (simulation) . . . . . . . . . . . . . . .
66
5.6
Packet delay distribution for a 500 Kbps stream (simulation) . . . . . . . .
67
5.7
Increasing the number of hops (simulation) . . . . . . . . . . . . . . . . . .
67
5.8
Emulab Network Setup
. . . . . . . . . . . . . . . . . . . . . . . . . . . . .
68
5.9
Spines congestion control (Emulab) . . . . . . . . . . . . . . . . . . . . . . .
68
5.10 Average delay for a 500 Kbps stream (Emulab) . . . . . . . . . . . . . . . .
70
5.11 Average delay for a 1000 Kbps stream (Emulab) . . . . . . . . . . . . . . .
70
5.12 Average jitter for a 500 Kbps stream (Emulab) . . . . . . . . . . . . . . . .
70
5.13 Packet delay distribution for a 500 Kbps stream (Emulab) . . . . . . . . . .
70
6.1
Network loss - Average PESQ . . . . . . . . . . . . . . . . . . . . . . . . . .
76
6.2
Network loss - 5 percentile PESQ (worst affected) . . . . . . . . . . . . . . .
76
6.3
Real-time recovery loss - 1 link . . . . . . . . . . . . . . . . . . . . . . . . .
79
6.4
Real-time loss recovery - 2 concatenated links . . . . . . . . . . . . . . . . .
79
6.5
Delay distribution - 1 link, 5% loss . . . . . . . . . . . . . . . . . . . . . . .
79
6.6
Delay distribution - 2 concatenated links, 5% loss each . . . . . . . . . . . .
79
6.7
Spines network - 5 links . . . . . . . . . . . . . . . . . . . . . . . . . . . . .
83
6.8
Real-Time protocol - Average PESQ . . . . . . . . . . . . . . . . . . . . . .
83
6.9
Real-Time protocol - 5 percentile PESQ . . . . . . . . . . . . . . . . . . . .
83
6.10 Two-metric routing decision . . . . . . . . . . . . . . . . . . . . . . . . . . .
84
6.11 Comparing routing metrics - 15 node networks . . . . . . . . . . . . . . . .
85
6.12 Comparing routing metrics - 100 node networks . . . . . . . . . . . . . . . .
85
6.13 Spines network - 2 links . . . . . . . . . . . . . . . . . . . . . . . . . . . . .
88
6.14 Spines forwarding delay . . . . . . . . . . . . . . . . . . . . . . . . . . . . .
88
6.15 Planetlab - lost packets . . . . . . . . . . . . . . . . . . . . . . . . . . . . .
91
6.16 Planetlab - missed packets . . . . . . . . . . . . . . . . . . . . . . . . . . . .
91
viii
List of Tables 5.1
Average latency for under loss . . . . . . . . . . . . . . . . . . . . . . . . . .
63
6.1
Planetlab sites . . . . . . . . . . . . . . . . . . . . . . . . . . . . . . . . . .
90
ix
For my wife and best friend Camelia, who followed and supported me through this journey, making this dream become reality.
For my parents, Dorina and Stefan, who taught me the value of integrity and of choosing my own path.
x
Chapter 1
Introduction The Internet provides a very successful set of network protocols that allow its global deployment, reliability and standardization. With the unprcecedented growth of the Internet, these protocols become difficult to change, and therefore it is very hard to incorporate new network services at the network infrastructure level. Moreover, the scalability requirements of the Internet limit applications to use only end-to-end protocols, as application state (e.g. session state) cannot be maintained in intermediate routers. This thesis explores a practical overlay network approach that uses a set of applicationlevel routers on top of a physical network such as the Internet. This allows specific applications to use different protocols that can utilize more information about the participating network resources. The benefits of this approach are: • Providing new services that are not feasible to implement in the current networking infrastructure by deploying application-specific overlays. • Achieving better performance for existing services by using algorithms that trade scalability with more information about network resources. As opposed to the Internet protocols, our approach scales only to the size of an overlay network (thousands of nodes), but for this size of network, it uses more knowledge to gain better performance.
1
Any overlay network comes with additional costs: first, communication has to incure data and management overhead since it adds an intermediate level between the application and the network infrastructure. This price has to be paid at each intermediate node. Second, the placement of overlay nodes is usually less than optimal as the administrator of an overlay rarely has access to the core nodes of the network. Our results point to the high potential of the overlay paradigm even while considering the overhead associated with it. We realize this paradigm in an actual system named Spines which, unlike other approaches, is general, runs in user space, and is able to include multiple protocols in the same architecture. Spines was designed and implemented in order to facilitate our research and experiment with the protocols presented in this thesis, and was made publicly available to allow other researchers and practitioners to deploy their own overlay network ideas.
1.1
Highlights and Contributions An overlay network is a user-level topology built by selecting a subset of the nodes in
the underlying network and connecting them by virtual links. The overlay links are actually unicast connections between the overlay nodes in the supporting infrastructure. Unlike the Internet, overlay networks are small (up to thousands of nodes), expanding only to the size of the application they serve. Additional information, that cannot be maintained at the coarse granularity of the global Internet, can be propagated among the participants of an overlay. New protocols that exploit this additional information can be deployed in order to address specific requirements of various applications. Over the last few years overlay networks emerged as a very powerful concept in extending the functionality and performance provided by the Internet. This concept also allows easy experimentation and deployment of far reaching ideas and protocols by layering multiple virtual topologies on top of the existing network, without requiring changes of standards and without the risks associated with experimentation on an operational network infrastructure. We develop an 2
overlay network platform and we use it to pursue our research, focusing on two aspects of networking communication: adding new service functionality, and improving performance of the existing services. We present the design of an overlay multicast protocol that scales with the number of groups, senders and receivers in the system. In our model, any participant can be a sender, receiver or both; any participant can join a different number of groups at the same time, and can multicast messages to any number of groups, even to those that it is not a member of. Since it runs within an overlay network, our multicast scheme does not depend on changes in the network infrastructure. Moreover, in order to facilitate easy adaptation of existing IP Multicast applications, we developed a transparent interface where calls using the same parameters are used to join and leave groups, or to send and receive messages. An even more complex service that we look at is providing end-to-end reliability for messages sent over multicast groups, using reliable links between the nodes of the overlay. Since the overlay is deployed over the Internet, where various links have different capacity and available bandwidth, the overlay nodes can see more incoming traffic than the capacity of their outgoing links. One of the main challenges of this environment is to provide an adequate control feedback to the originating senders of multicast traffic, and to design a distributed flow control mechanism that adjusts the sending rate of each participant in such a way that the total throughput transfered in the system is maximized. In contrast to existing window-based flow control schemes we avoid end-to-end per sender or per group feedback by looking only at the state of the virtual links between participating nodes. This produces control traffic proportional only to the number of overlay network links and independent of the number of groups, senders or receivers. We optimize the throughput sent in the network by applying a Cost-Benefit Framework [1] that was proven to achieve near-optimal resource utilization. We show the effectiveness of the resulting protocol through simulations and validate the simulations with live Internet experiments.
3
Additional functionality does not come at the expense of performance, because the overlay networks work in an additional layer of topologies, not interfering with existing protocols. Moreover, the fine grain control over the participants of an overlay gives us the ability to improve performance even for the existing applications. We show that coupling cheap processing and memory with the programmable platform provided by overlay networks and paying a small price in throughput overhead, can considerably improve the latency characteristics of network services. Reliable point-to-point communication is usually achieved by applying a reliable protocol, such as TCP, between the end nodes of a connection. We argue that a hopby-hop approach, where connections are broken into several reliable hops – multiple links in an overlay network – considerably reduces the latency and jitter of communication. We quantify the effects of the hop-by-hop reliability approach in simulation as well as in practice using our overlay network system, Spines. The experimental results show that the overhead associated with overlay network processing of packets at the application level is not a significant factor compared with the considerable gain of the approach. We took the latency improvements offered by the overlay networks to the more demanding environment of Voice over IP, which requires fast, interactive communication. The Internet provides best effort delivery, without any inherent quality of service guarantees. Low latency is a key factor in supporting high quality interactive conversations, and as such contemporary VoIP solutions use UDP to transfer data over the IP layer, despite being subject to network loss and failures. We describe and evaluate how using an overlay network approach can significantly improve the quality of Voice over IP communication. Application level overlay routers can understand the stringent requirements of VoIP and implement new algorithms that mask the limitations of the underlying Internet. We describe two protocols that facilitate localized recovery for lost packets and rapid rerouting in the event of network failures. Our experimental results indicate that the two approaches can be combined to yield a
4
quantitative improvement to voice communication quality. The main contributions of this research are: • A new architecture for constructing practical, transparent overlay networks • A transparent overlay multicast protocol scalable with the number of groups and participants. • An optimal distributed flow control for reliable multicast and unicast in overlay networks. • An overlay protocol for reducing latency and jitter of reliable communication while maintaining fairness guarantees with external TCP traffic. • A soft real-time protocol for improving quality of Voice over IP communication • The Spines overlay network system that allows easy deployment and experimentation of overlay protocols.
1.1.1
Thesis Organization The rest of the thesis is organized as follows: The next section presents relevant work
in overlay networks, multicast, flow control reliability and Voice over IP. Chapter 2 describes the overlay network framework, and introduces our overlay network platform, Spines. Chapter 3 presents our solution for scalable and transparent multi-sender multi-group multicast, and in Chapter 4 we present a global flow control for many-to-many reliable multicast. In Chapter 5 we describe how existing applications using reliable communication can leverage from overlay networks to improve packet latency and jitter. Chapter 6 addresses improving the quality of Voice over IP communication using overlays. We summarize our contributions, and conclude the thesis in Chapter 7 discussing future directions of networking research in overlay networks.
5
1.2
Related Work One of the early uses of overlay networks in the Internet was EON (Experimental
OSI-based Network) [2], which proposed an overlay on top the IP network, that would allow experimentation with the OSI network layer. The scheme was only experimental and did not lead to a practical deployment for new services or protocols. IP multicast [3],[4] was proposed over ten years ago to extend the Internet service model from point-to-point to point-to-multipoint data delivery. Despite the attractiveness of this model due to its simplicity and efficiency, a number of crucial problems have impeded the global deployment of IP multicast. In [5] and [6], the authors cite a number of problems that are inherent in the IP multicast service model. These problems, including group management, lack of access control, absence of a good inter-domain multicast routing protocol and distributed multicast address allocation, have proved to be a significant barrier to wide-spread commercial deployment of IP multicast. The Mbone [7] is a routing mechanism that creates an overlay infrastructure over the global Internet and extends the use of IP multicast by creating virtual tunnels between the networks that support native IP multicast. As it is based mainly on IP Multicast, the Mbone faced the same scalability and deployment problems, and therefore today it is not widely used. Multi Protocol Label Switching (MPLS) [8] has been recently proposed as a way to improve the performance of underlying network. This is done by pre-allocating resources across Internet paths (LSPs in MPLS parlance) and forwarding packets across these paths. Our approach is network agnostic and therefore does not depend on MPLS, but it can leverage any reduction in loss rate offered by MPLS. At the same time, MPLS will not eliminate route and link failures or packet loss. Since it runs at a higher level, our overlay network can continue to forward packets avoiding failed network paths. Application-level overlay networks emerged mainly to provide new services to the applications. Flexibility of routing and providing high network availability was one of the first services looked into. The X-Bone [9] is a system that uses a graphical user interface
6
for automatic configuration of IP-based overlay networks, while RON [10] is an overlay network system that creates a fully connected graph between several nodes, monitors the connectivity between them, and, in case of Internet route failures, re-directs packets through alternate overlay nodes. Both X-Bone and RON are implemented at the IP level, and while they can offer performance improvements through path selection, they do not develop link or application-specific protocols and do not provide additional services to the applications. In this respect, they are complementary to our work. I3 [11] proposes a global overlay architecture where packets are sent to logical identifiers, and receivers use triggers to indicate their interest in packets sent to an identifier, allowing service flexibility like multicast and anycast. This thesis argues in favor of using multiple application specific overlays that can be deployed in parallel, such that each overlay network expands only to the size of the application it serves. The idea of using localized recovery on intermediate links is not new. In 1976 the International Committee for Telegraph and Telephony (CCITT) recommended X.25 as a store-and-forward connection oriented protocol between end-nodes (DTE) and routers (DCE). In [12], the authors give a detailed description of the X.25 protocol. However, since the Internet was developed as a connectionless, best-effort network (which allows better scalability and interoperability), it did not incorporate the X.25 specifications, and relied on end-to-end protocols such as TCP to provide reliable connections. TRAM [13] is a tree-based reliable multicast protocol that uses repair trees to localize recoveries, and aggregates end-to-end acknowledgments at intermediate nodes. TRAM was designed specifically for single-source multicast. If applied to multiple flows (unicast or multicast), TRAM requires intermediate nodes to keep packet-based state for each endto-end session in order to provide end-to-end reliability and congestion control. SRM [14] provides a form of localized recovery for reliable multicast by using randomized timeouts for sending retransmission requests and the retransmissions themselves. SRM does not guarantee recovery from the nearest node, as the closest one may set its timeout to be higher than that of an upstream node. Its probabilistic algorithm allows for double retransmission 7
requests and recovery messages to be sent. Yoid [15] is a set of protocols that allows host-based content distribution using unicast tunnels and, where available, IP multicast. Yoid has the option of using TCP as the link protocol on the overlay network, but does not guarantee either end-to-end congestion control or end-to-end reliability. In addition to these guarantees, the protocols described in this thesis use an out of order forwarding mechanism that provides less burstiness at the network level, and lower packet latency and jitter. OverQoS [16] proposes an overlay link protocol that uses both retransmissions and forward error correction (FEC) [17] to provide loss and throughput guarantees. OverQoS depends on the existence of an external overlay system (the authors suggest RON as an option) to provide path selection and overlay forwarding. In this respect, our system can use OverQos as a plug-in module as an alternative to our real-time recovery protocol presented in Section 6.2.1, probably with the necessary modifications that take into account the special requirements of voice traffic. Other overlay networks such as Overcast [18], Scattercast [19], HTMP [20] and EndSystem Multicast (ESM) [21], aim to address the scalability limitations of IP Multicast. The main target of HTMP and ESM are groups with relatively small number of participants such as the ones used for multimedia teleconferences. HTMP creates a tree shared among all the group participants while ESM creates an overlay mesh, on top of which a conventional routing algorithm is run to generate per-source trees which are then used for multicast delivery. Our solution scales to very large number of groups, each with thousands of participants. It does so, by utilizing a shared group of infrastructure nodes that form the core of the overlay where end-user nodes connect to. In this respect our approach shares the same system architecture with Scattercast and Overcast. The main design goal for Overcast is to build bandwidth-optimized multicast trees for the distribution of high-bandwidth, high-volume contents such as high quality video and software distributions. Overcast uses caching at the edges to serve content to “late”
8
receivers and recover from losses. In order to provide reliable delivery, Overcast nodes are connected by TCP connections and nodes request retransmissions for content lost during periods where the tree is reconstructed after node crashes. Scattercast is also built for the purpose of delivering content to large receiver groups. Scattercast builds a mesh over which a per-source tree is created by running a Distance Vector-like routing protocol. Both Scattercast and Overcast are customized to best serve the needs of their specific applications, exposing a high level interface dealing with specific application level objects. In contrast, our solution provides the same socket interface that developers are accustomed to. Many different approaches exist in the flow control literature, including TCP-like window based protocols [22, 23], one or two bit feedback schemes [24, 25, 26], and optimization based flow control [27, 28, 29, 30, 31, 32]. The economic framework for flow and congestion control used in many optimization based protocols [28, 30] has some similarity with the cost-benefit model used in our work. In both, the links have some cost and packets that are sent must have sufficient benefit to pay the cost of the network resources they require. A significant difference is that our cost-benefit model takes an algorithmic approach using a simple formula to decide when a packet can be sent, and is not based on economic theory. Unlike many economic models our cost-benefit model does not try to reach an equilibrium state based on the rationality of the participants, or influence noncooperative processes to behave, but rather optimizes the throughput under the assumption of minimally cooperative (non-rational or even malicious) senders. Research on protocols to support group communication across wide area networks such as the Internet has begun to expand. Group communication protocols designed for such wide area networks have been proposed [33, 34, 35, 36] which continue to provide the traditional strong semantic properties such as reliability, ordering, and membership. These systems predominantly extend a flow control model previously used in local area networks, such as the Totem Ring protocol [35], or adapt a window-based algorithm to a multisender group [37, 36]. Our work presents a flow control algorithm designed explicitly for wide-area overlay networks which is motivated more by networking protocols and resource 9
optimization research, than by existing group communication systems. Work on flow control for multicast sessions has occurred mainly in the context of the IP-Multicast model. Much of this work has focused on the congestion control problem, avoiding extra packet loss and providing fairness, and has left flow control up to higher level protocols (such as reliability, ordering, or application level services). Research has explored the difficult problems associated with multicast traffic such as defining fairness [38, 39] and determining appropriate metrics for evaluation of multicast traffic [40]. A number of congestion control protocols have been developed with the goal of providing some level of fairness with TCP traffic, while taking advantage of the unique characteristics of multicast traffic. These include window based protocols [41, 42], rate based protocols [43, 44], multilayer based protocols [38], and protocols that use local recovery to optimize congestion control [45]. While IP-Multicast focuses on a single sender, single group approach that scales to many receivers and many intermediate routers, our approach addresses a multigroup multi-sender problem that scales with the number of groups, senders and receivers, but is defined in an overlay network setting rather than on every router in the Internet.
10
Chapter 2
Spines, An Overlay Network Platform In this chapter we present the overlay network paradigm and introduce an overlay network system, Spines [46], that we developed to allow experimentation of our protocols, and to be a useful platform for other researchers and practitioners in the field.
2.1
Overlay networks An overlay network constructs a user level graph on top of an existing networking
infrastructure such as the Internet, using only a subset of the available network links and nodes, as seen in Figure 2.1. An overlay link is a virtual edge in this graph and may consist of many actual links in the underlying network. Overlay nodes act as user-level routers, forwarding packets to the next overlay link toward the destination. At the physical level, packets traveling along a virtual edge between two overlay nodes follow the actual physical links that form that edge. There can be many overlay networks running independently at the same time on top of a single networking infrastructure, each of them defining a specific virtual topology. An
11
Physical network link Physical link used by the overlay network Virtual overlay network link
Actual node in the physical network Actual overlay network daemon Overlay network node
Figure 2.1: An overlay network example overlay network may or may not overlap with other overlay topologies, such that a physical node in the underlying physical infrastructure can be part of more than one virtual overlay topology. The overlay handles traffic for multiple connections in various directions, such that every connection can have a limited number of intermediate overlay hops. Our experiments presented in Section 5.2, as well as previous work [10] show that increasing the number of nodes in an overlay follows a diminishing return function. At some early point, the benefit of adding additional nodes to an existing overlay is small, and is overcome by the overhead associated with a larger overlay. Therefore we believe that overlays should be relatively small (tens to hundreds of nodes) with direct link latencies in the order of milliseconds or tens of milliseconds, thus being able to cover most of achievable distances on our planet. Overlay networks have two main drawbacks. First, the overlay routers incur some overhead due to the the management of the overlay and also due to processing of each packet, which requires delivering the packet to the application level, processing it, and forwarding it to the next overlay router. Second, the placement of overlay routers in the topology of 12
Application Spines daemon
Figure 2.2: A Spines overlay the physical network is often far from optimal, because the creator of the overlay network rarely has control over the physical network (usually the Internet), or even the knowledge about its actual topology. Therefore, while overlay networks can sometimes find alternate paths that improve end-to-end latency, many times the multi-hop paths provided by the overlay networks have higher latency than the direct point to point Internet connections. However, overlays are small compared to the global underlying network, and therefore protocols that exploit the relatively limited size and scope of overlays not only can overcome their drawbacks, but can actually offer better performance to end-user applications. Overlay networks allow full control over the protocols running between participating nodes. While the Internet provides generic communication solutions that are not tailored to a specific application, an overlay network usually has a limited scope and therefore can deploy application-aware protocols.
2.2
Spines Spines [46] is an open source overlay network system that allows easy deployment and
testing of overlay protocols. It runs in the user space, does not need root access or kernel modifications, and encapsulates packets on top of UDP. Spines offers a two-level hierarchy 13
in which applications (clients) connect to the closest overlay node, and then the node is responsible for forwarding and delivering data to the final destination through the overlay network. The benefit of this hierarchy is that it limits the size of the overlay network, thus reducing the amount of control traffic exchanged. An example of a Spines overlay network is shown in Figure 2.2. Overlay nodes act both as servers (accepting connections from various applications) and as routers (forwarding packets towards clients connected to other overlay nodes). Applications may reside either locally with the Spines nodes or on machines different than the overlay node they connect to. In order to connect to a Spines overlay node, applications use a library that enables both UDP and TCP communication between the application and the selected Spines node. The API offered by the Spines library closely resembles the Unix socket interface both for unicast and multicast communication, and therefore it is easy to port any application to use Spines. As an example, we describe in Section 6.4 the necessary steps to adapt current Voice over IP applications to use Spines. Each client is uniquely identified by the IP address of the overlay node it connects to, and by an ID given at that node, which we call Virtual Port. Spines provides both reliable and best-effort communication between end applications, using the applications’ node IP address and the Virtual Port resembling TCP and UDP communication. Similarly to the socket() call, a spines socket() function returns a descriptor that can be used for sending and receiving data. A spines sendto() call resembles the regular sendto(), and a spines recvfrom() resembles the regular recvfrom(), with identical parameters. Virtual Ports are only defined in the context of an overlay node, and have no relation to the actual operating system ports. Spines also offesr multicast capabilities using its API that resembles the IP Multicast mechanism.
2.2.1
The Spines software architecture Spines runs a software daemon on each of the overlay nodes. The Spines daemon
communicates with clients through a Session layer as seen in Figure 2.3. There is one Session
14
Daemon-Client Interface Reliable Session
API Library
Session
Data Forwarder
Group State
Link State
State Flood
Hello Protocol
Reliable Datagram
Real-time Data Link
Best Effort Data Link
Reliable Data Link
Control Link
Overlay Link
Overlay Node
Routing
Datalink (UDP/IP unicast)
Figure 2.3: Spines software architecture for each client connection, and if the client requests a reliable end-to-end connection with some other client, the daemon will instantiate an end-to-end Reliable Session module that will manage the end-to-end reliability, FIFO ordering, and end-to-end congestion and flow control between the two end applications. By default, regardless of the type of overlay links used between overlay nodes, the communication between clients and their overlay daemon is done through TCP reliable channels. However, clients can also request best effort communication with their daemon. In this case data packets (spines sendto(), spines recvfrom()) are sent over UDP, while the the control communication (spines bind(), spines setsockopt(), etc.) is done through reliable TCP channels. The reliable channels between daemons and clients can buffer packets as needed, and in case of buffer overflow they can either drop outstanding packets, block the sending client, or disconnect the client, depending on the semantics requested. Note that Spines does provide end-to-end flow control between clients requesting reliable end-to-end communication, slowing down the sending applications to the
15
receiving speed of the destinations. Spines nodes connect to each other using virtual links forming the overlay network. Once a message is sent on a Spines overlay network it will be forwarded on the overlay links until it reaches the destination. Spines runs a number of protocols on each virtual link, including a best effort service, a TCP-fair reliable protocol [47], and a real time recovery protocol. Thus, each overlay link consists of four logical components, as seen in Figure 2.3. • An Unreliable Data Link sends and receives data packets with no regard to ordering and reliability. It is used for best effort, fast communication as it has no buffering other what is provided by the operating system. The unreliable protocol in Spines only provides overlay routing for data packets. • A Reliable Data Link provides overlay link reliability through a selective repeat protocol and a TCP-fair congestion control, but does not provide FIFO ordering. Packets are buffered before being sent on a Reliable Data Link only in case the available link capacity (or the congestion control) limits the outgoing bandwidth to a lower value than the incoming throughput. The explicit congestion notification mentioned in Section 5.1.2 is based on the size of these buffers. The Reliable Data Link protocol provides a TCP-fair congestion control. This allows the deployment of Spines overlays in the Internet, giving us fairness with external TCP traffic. • A Real-time Data Link behaves mostly like the Unreliable Data Link, but attempts to recover lost packets if the recovery can be done within a certain time constraint. This is useful for improving the packet delivery ratio for real-time applications that have strong requirements for communication delay. Retransmissions are attempted only once, and the total number of retransmissions is regulated through a token-bucket mechanism such that congested links will not suffer from an unlimited increase in traffic due to retransmissions. • A Control Link is used for sending and receiving control information between neigh16
boring daemons, and provides both reliable and unreliable communication between various components of the overlay nodes. In case reliable control packets are buffered, the unreliable control packets bypass the buffer and are sent directly on the network for fast response time. The Overlay Node is responsible for maintaining connections to its neighbors and forwarding data packets either on the overlay links or to its own clients. A Data Forwarder parses the header of each message and sends it on the next link or to the daemon-client interface. The Data Forwarder allows any combination of reliable and best effort Session, and real-time, reliable or unreliable links in order to experiment with different forwarding mechanisms. The type of Session and Data Link requested are stamped in the header of each message. For example, one can create a reliable end-to-end connection using either unreliable, real-time, or reliable links. Neighboring overlay nodes ping each other periodically using unreliable hello packets. The Spines Hello Protocol is responsible for creating, destroying and monitoring overlay links between neighbor daemons, and also for measuring the link latencies. Round trip time measurements are smoothed by computing a 5%-95% decaying average. Spines detects network failures through the hello protocol, and adjusts its routing accordingly in under 10 seconds. Spines adds a link specific sequence number on every data packet sent between two neighboring overlay nodes. The receiving overlay node uses this sequence number to estimate link loss rate. The loss rate is computed by averaging the number of packets received between two subsequent loss events over the last L loss events (in our implementation L = 50). This way, the loss estimate converges relatively fast when loss rate increases (less number of packets will be received between two loss events), but is conservative in using opportunistic overlay links that exhibit temporary low loss conditions. Based on link loss, latency and hop count, a cost for each link is computed using various metrics. Spines currently allows optimizing number of hops, latency, loss rate, or 17
a metric that we call expected latency, that we will discuss in Chapter 6. Link costs are propagated through the network by an incremental Link State mechanism that uses the reliable control links created among neighboring Spines nodes. A State Flood protocol is responsible for aggregating cost updates and disseminating them reliably to all the overlay nodes, only when the state of the links change, or periodically at large intervals for garbage collection. The same State Flood protocol is also responsible for propagating Group State membership information, containing the groups that each node intends to receive messages from. The link state protocol provides complete information about the existing overlay links, from which a Routing module chooses the neighbor providing the shortest path to each destination. All the routing information is maintained in dynamic hash data-structures that allows fast access on packet routing.
2.2.2
Spines overhead In addition to the IP and UDP headers, Spines adds its own headers for routing and
reliability. Also, for reliable connections Spines sends acknowledgments for every packet at the level of each link for hop reliability and at least four acknowledgments per end-to-end window for end-to-end reliability and congestion control. When possible, acknowledgments are piggybacked with data packets. The control traffic required for maintaining the overlay network is small compared to the overall data traffic, consisting in our implementation of periodical hello messages and small link updates. One 32 byte hello message is sent every second by each of the two endnodes of a direct link. A single link update is propagated to the other nodes in the overlay only in case of a network change. On the initial state transfer, when a new node is brought up, as well as in the case of multiple network events that happen simultaneously, multiple link updates are aggregated, so that a regular Ethernet packet can carry between 60 and 90 distinct updates, depending on the sparsity of the network. In the current implementation, Spines scales to up to several hundred overlay nodes, and up to one thousand clients per
18
node. When compared with a standard TCP connection running alone on a network link with capacity ranging from 500 Kbps to 100 Mbps, the Spines link protocol achieves about 3.5% less data throughput, and the end-to-end connection that uses both levels of reliability and congestion control (on the hop and end-to-end) shows an overhead of at most 5.7%. The best effort protocol, as well as the real-time protocol in Spines have an overhead of about 2.3%.
19
Chapter 3
Scalable Multi-group, Multi-sender Overlay Multicast We use the overlay paradigm to provide a transparent multicast service suitable for applications that use multiple senders and receivers, and multiple groups at the same time. This chapter presents the design of the multicast protocol, and its implementation in Spines. This chapter is based on joint work with Andreas Terzis. Multicast communication allows sending data packets to multiple recipients at the same time. Obviously, this can be achieved by opening multiple unicast connections in parallel (one for each recipient), but this approach will send multiple duplicate packets on network links shared by multiple source-destination paths. The goal of an efficient multicast protocol is to send packets only once on the shared links, and duplicate them at the points where their network paths diverge. The ideal result is a routing tree (multicast tree) that spans from the source to all of the recipients joining the multicast group, using the underlying network topology, such that a packet is not sent more than once on any network link. However, this usually is at odds with the overhead of managing the multicast routing state when users join and leave groups, and also when parts of the network become disconnected or re-connected.
20
IP Multicast [4] came as a solution for routing multicast traffic within the IP network. It requires network routers to constantly exchange information about the multicast groups they handle, and the routing information associated with it. Since IP Multicast is a global protocol, implemented as part of the Internet, the name space of the groups is also global, such that a multicast group cannot be used at the same time by two independent applications around the world, unless they want to receive each other’s packets. Specifically, a multicast group is defined as an IP address within a specific range of class D addresses. An IP address in the Internet usually defines a resource (a computer, a router, etc.), in general limited in number by the total of hardware participants in the network. In contrast, multicast groups are application specific, so virtually an infinite number of groups should be able to coexist in the network at the same time, independently. Obviously, this creates scalability, security and synchronization problems in deployment. As a consequence, IP Multicast is not widely used today, even though was introduced more than a decade ago. Application-level multicast uses software routers running on computers that create multicast trees between them in an overlay network. Since the overlay links do not always match the underlying topology, application-level multicast is not as efficient as IP Multicast, many times sending duplicate packets on the same physical links. However, it has all off the benefits of the overlay architecture it uses, allowing application-specific protocols and ease of deployment. Moreover, the group name-space of application-level multicast is only defined within the overlay network, and does not need to scale to the entire world. Our goal is to design a system capable of providing efficient application level multicast, that scales with the number of groups and with the number of participants - senders and receivers. Our approach allows any participant to join a large number of groups simultaneously and to send packets at any time to any group. Moreover, the approach is highly transparent, such that any application that uses IP Multicast can be easily modified to use our system. The protocols can handle network partitions, crashes, merges, or any combination of these events.
21
3.1
Overlay multicast We developed our multicast protocols in the context of our overlay network platform,
Spines, thus having the benefit of the less general, application-level unicast routing and of the daemon-client architecture as a baseline. We define a multicast group as a class D multicast address, exactly as IP Multicast. Note that even though they have similar naming scehme with IP Multicast, the overlay groups only extend to the scope of the overlay network, and are independent of other overlays. If an application intends to join a group, it informs the overlay node that it is connected to, and the server will pass to the application the messages sent to that group. Leaving a group follows a similar procedure. In order to multicast a message to a group, an application simply sends the message (through its overlay node) to the multicast address representing the group. The overlay network handles the routing of the multicast message according to the current membership of the group to which the message is sent. Applications can join, leave, send and receive messages to and from multicast groups at any time. An application can join multiple groups, thus it can be member of more than one group at the same time. In order to send messages to a group, it is not necessary that the application join that group.
3.1.1
Group membership Every overlay node knows the groups to which each of its own applications belong.
However, a server does not know the membership of individual applications connected to other nodes, but only the membership of other nodes in the overlay network. At the overlay level a node is considered member of a group if it has at least one application joining that group. When the first application joins a group locally, the node issues a join message that propagates to all other nodes in the overlay network. Subsequent application joins to the same group will not generate any new messages in the overlay, as the server is already a 22
member of that group. When the last local application member of a group leaves that multicast group, the server issues a leave message that propagates to all the other nodes. Node level joins and leaves are sent through the same State Flood mechanism used by the Link State protocol, as described in Section 2.2.1. Group updates are ordered per sender node and flooded using reliable channels between neighbor nodes, only when a node membership occurs. Using reliable channels allows us to send only incremental updates, so if nothing changes no joins and leaves are sent. The reliable channels used for control information like joins and leaves are separate from the data channels, so the control information is not queued with the data messages, therefore propagating fast. Node membership is maintained in a collection of (node id, group id) tuples for every group that a node (not application) belongs. Therefore, the size of our data structures grows linearly with the number of node members in every group. In our experiments, we were able to manage a number of node members in the order of one million, on regular PC computers. Note that the number of applications using an overlay and joining groups can be much higher than the number of nodes in the overlay, as each node can handle up to several hundreds of applications connected locally.
3.1.2
Routing The multicast routing in an environment with multiple senders, receivers and groups
should answer the following question: If a node receives a packet originated from a particular sender and sent to a specific group, what are the neighbors (if any) to which the node should forward the message. Distributed deterministic decisions should be taken, as multiple paths or multicast trees from the same sender to the designated group may co-exist in the overlay. The answer depends on the membership of the specific group the packet was sent to, the originator of the packet, and on the current overlay topology. As packets are not disseminated everywhere in the network, but only to the nodes that joined the group, the packet should be forwarded only on downstream links that have nodes joining that group.
23
Also, depending on the location of the sender in the network, a different multicast tree may be used, such that the cost of propagating the message can be optimized. Computing the routing for each packet can be prohibitively expensive, while pre-computing and storing all the combinations of (sender, multicast address) consumes a large amount of memory for pairs that may never be used, and requires extensive computation overhead in case of a join, leave, or topology change. We use an all pairs shortest path algorithm that computes the shortest path from every node to all the other nodes, only when a network topology change occurs, and not when an application (or node) joins or leaves a group. Regardless of the specific groups in the system, this gives us one complete multicast tree from each source to all the other nodes in the network, by combining all the shortest paths originating from a node to other nodes in a tree rooted at that node. For an overlay network with n nodes and m links, The complexity of the all-pairs shortest path algorithm we use is O(n 3 ). This can be optimized to recompute the routing in the order O(n 2 ) when a new link is added, or when the cost of a link goes down, and O(n·m+n2 ·log(n)) when a link is removed, or a link cost increases [48]. Per sender, per group routing is achieved by pruning the complete multicast trees for each sender and group individually, such that a packet is not sent on links that do not have downstream destinations. Pruning the tree at an intermediate node requires iterating through the list of members of the group the message is addressed to. For each node member of the group, we apply the all-pairs shortest path routing as unicast from the originator of the message to that destination, while considering downstream links only once. Obviously, this operation is expensive, and cannot be performed for each message, and on the other hand, we want to avoid large computations per membership change. We only compute and store the routing information for a specific pair (sender, multicast group) when the first message that matches that pair arrives. Subsequent packets from the same sender to the same group will be routed directly using the previously stored information. The stored routing state relevant to a group is discarded (and re-computed again, as above, when new messages arrive) any time that group experiences a membership change. 24
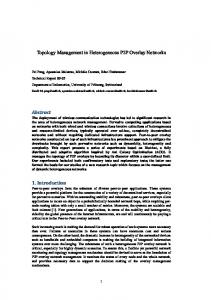
60000
A
Join Leave
50000
B
Time (msec)
40000
C
30000 20000 10000
D
E
F
G
0 10000
Figure 3.1: Membership topology
3.2
30000
50000 70000 90000 110000 Number of groups per node
130000
150000
Figure 3.2: Membership propagation delay
Experimental results We measured the time it takes to perform multiple join or leave operations in parallel
on multiple computers, and to propagate the routing information about the group membership in Spines. This is determined by the time required to process the membership updates on each computer, and by the time needed to propagate these updates through the reliable flooding mechanism, essentially the diameter of the network. In this experiment we focused on the processing and synchronization overhead. We deployed a network consisting of 7 computers, all running Linux and having an Intel Pentium IV 2.8Ghz processor, and 1GB memory. The nodes were set up in an overlay topology as in Figure 3.1, with local area links between the nodes. At each node, an identical application sends messages to two groups, say group J and L (these are actually two IP multicast addresses), every 20 milliseconds, using Spines. The messages contain the group address they are sent to, and the IP address of the sending application. A different application (joiner) at each node joins a number of groups, then joins group J and waits until it receives at least one message from each of the sending applications. This ensures that the entire membership information (including the last group J ) has been propagated to all the other nodes. Then all the joiner applications leave all the groups
25
they have previously joined, and finally, they join group L and wait for a message from each node. The time is recorded both after the join and leave information is propagated. Figure 3.2 shows the time required for join and leave operations, as the number of groups increase. We notice that joins and leaves take almost the same amount of time, and that the graphs follow a close to linear evolution with the number of groups, which means that a single join or leave operation does not depend on the number of groups already in the system. For example, for 150000 groups per application, it takes about 50 microseconds to join a group, and about 45 microseconds to leave.The computers running Spines were using 100% CPU during the experiments, showing that the bottleneck was the processing of the local data structures. This shows that a single Spines overlay network can handle a relatively large number of groups.
26
Chapter 4
Global Flow Control for Many-to-many Reliable Multicast in Overlays This chapter presents a flow control strategy for multi-group multi-sender reliable multicast and unicast in overlay networks, based on competitive analysis. Our goal is to maximize the total throughput achieved by all senders in overlay networks where many participants reliably multicast messages to a large number of groups. This chapter is based on joint work with Baruch Awerbuch and Jonathan Stanton. Our framework assigns costs to network resources, and benefits to achieving user goals such as multicasting a message to a group or receiving a message from a group. Intuitively, the cost of a network resource, such as buffers in routers, should go up as the resource is depleted. When the resource is not utilized at all its cost should be zero, and when the resource is fully utilized its cost should be prohibitively expensive. Finding the best cost function is an open question; however, it has been shown theoretically [1] that using a cost function that increases exponentially with the resource’s utilization is competitive with the optimal off-line algorithm. Competitive ratio is defined as the maximum, over all 27
possible scenarios, of the ratio between the benefit achieved by the optimal offline algorithm and the benefit achieved by the online algorithm. Our online algorithm allows the use of resources if the benefit attached to that use is greater than the total cost of allowing the use. The choice of benefit function enables us to optimize for various goals. By adjusting the benefit function, performance issues such as throughput and fairness can be taken into account when making flow control decisions. For example, the benefit can be the number of packets sent (sending throughput), the number of packets received by all receivers (receiving throughput), or the average latency given some throughput constraints. In this chapter we use only the sending throughput benefit function, seeking to optimize the total sending throughput of all the participants in the network. Reliability is provided both on each link of the overlay network, and end to end between the multicast members through a membership service. In our approach, each overlay link provides local retransmissions for reliability and uses a standard congestion control protocol that adapts the available bandwidth to the network congestion. This results in a dynamic capacity being available to our flow control framework on every overlay network link. All the traffic generated by our system on a link is seen as one TCP flow on that link, regardless of the number of senders or receivers. This provides a very conservative level of fairness between our multicast traffic and competing TCP flows. The global flow control problem deals with managing the available bandwidth of the overlay links and the buffers in the overlay nodes. One may also view this problem as congestion control for end-to-end overlay paths. The reason we define it as flow control is that at the physical network level, congestion control is achieved by TCP that runs between overlay nodes, while managing the buffers in the overlay routers is seen as an application level flow control task. Our framework requires the sender to be able to assign cost to a packet based on the aggregate cost of the links on which it travels. We develop the framework in the context of
28
overlay networks, where the number of network nodes is relatively small compared to the global Internet, while the number of senders, receivers and groups can be very large. For such systems, assigning the aggregate link cost is relatively cheap because dissemination tree information can be available at the sender. Also, as overlay network routers are flexible, it is easy to implement our protocol in the overlay nodes.
4.1
Background The network model used is an overlay graph with nodes and overlay links. Based
on the network topology, each overlay node chooses a tree from this graph, in which it will multicast messages. This tree is rooted at the daemon node and may differ from other daemons’ trees. In order to localize recovery for lost messages, we use the standard TCP protocol on each of the overlay overlay links. In Chapter 5 we show how using reliable overlay links can improve performance of end-to-end communication. The choice of TCP gives us a clean baseline to evaluate the behavior of our Cost-Benefit framework without side effects introduced by a different protocol. However, any other point-to-point reliable protocol could be used instead of TCP. The overlay nodes provide multicast services to client applications, and each node can have many clients connected to it. Each client may join an arbitrary number of groups, and may send multicast messages to any number of groups, including ones it has not joined. Clients connect to any daemon (preferably the closest one) and that daemon handles the forwarding of their traffic and provides all the required semantics, including reliability and ordering. The entire protocol described in this chapter is implemented only at the daemon level and is completely transparent to the multicasting clients. What the clients see is just a TCP connection to an overlay node, and they send their messages via a blocking or nonblocking socket. It is the responsibility of our flow control to regulate the acceptance rate of the client-daemon connection. 29
In a multi-group multiple sender system, each sender may have a different rate at which it can reach an entire receiver group, and different senders may reach that group over different multicast trees. Therefore, the bottleneck link for one sender may not be the bottleneck for other senders. The obvious goal is to allow each sender to achieve their highest sending rate to the group, rather than limiting them by what other senders can send to that group. To achieve this, rate regulation must occur on a per-sender per group basis rather than as a single flow control limit for the entire group or system. The result is a flow control that provides fine granularity of control (per-sender, per-group).
4.2
Global flow control for wide area overlay networks The algorithmic foundation for our work can be summarized as follows: We price
links based on their “opportunity cost”, which increases exponentially with link utilization. We compare different connections based on the total opportunity cost of the links they use, and slow down connections with large costs, by delaying their packets at the entry point.
4.2.1
Algorithmic foundation Whether a message is accepted or not into the system by a daemon is an online
decision problem. At the time of acceptance it is not known how much data the sending client (or the other clients) will be sending in the future, nor at what specific times in the future. The general problem with online allocation of resources is that it is impossible to optimally make irreversible decisions without knowing the future nor the correlations between past and future. Thus, our goal is to design a “competitive” algorithm whose total accrued benefit is comparable to that achieved by the optimal offline algorithm, on all scenarios (i.e. input sequences). The maximum possible performance degradation of an online algorithm
30
(as compared with the offline) is called the “competitive ratio”. Specifically, ρ = max x
Bof f line (x) Bonline (x)
(4.1)
where x is the input sequence, Bonline (x) is the benefit of the online algorithm, and Bof f line (x) is the benefit of optimal offline algorithm on sequence x. Our goal is to design an algorithm with a small competitive ratio ρ; such an algorithm is very robust in the sense that its performance is not based on unjustified assumptions about probability distributions or specific correlation between past and future. Theoretical background for the cost-benefit framework: Our framework is based on the theoretical result in [1]. The framework contains the following components: • User benefit function is defined, representing how much benefit a given user extracts out of their ability to gain resources, e.g., ability to communicate at a certain rate. • Resource opportunity cost is defined based on the utilization of the resource. The cost of a completely unused resource is equal to the lowest possible connection benefit, and the cost of a fully used resource is equal to the maximum connection benefit. • A connection is admitted into the network if the opportunity cost of resources it wishes to consume is lower than its benefit. • Flow control is accomplished, conceptually, by dividing the traffic stream into packets and applying the above admission control framework for each packet. Model of the resource – Cost function: The basic framework revolves around defining, for each resource, the current opportunity cost, which is, intuitively, the benefit that may be lost by higher-benefit connections as a result of consumption of the above resource by lower-benefit connections. Since the goal is to maximize the total benefit, it is “wasteful” to commit resources to applications (connections) that are not “desperate” for that resource, i.e., not enjoying 31
the maximal possible benefit from obtaining this resource. On the other hand, it is equally dangerous to gamble that each resource can be used with maximal benefit gained without knowing the sequence of requests ahead of time. For the purpose of developing the reader’s intuition, it is useful to consider a somewhat restrictive setting where the resources are either assigned forever, or rented out for a specific time. For a given resource l, (e.g., bandwidth of a given link l), denote by u l the normalized utilization of the resource, i.e., u l = 1 means the resource is fully utilized and ul = 0 means that the resource is not utilized at all. Also, let α be the minimum benefit value of a unit of a resource used by a connection and β be the maximum value. Let γ = β/α. In our framework, the opportunity cost of a unit of resource is defined as: C(ul ) = γ ul
(4.2)
As we will describe later, in our approach a unit of resource is a packet slot in the link buffers. Such an exponential cost function leads to a strategy where each 1/ log 2 γ of the fraction of the utilized resource necessitates doubling the price. For a path or a multicast tree consisting of multiple links, the opportunity cost of the path is the sum of opportunity costs of all the links which make up the path. Model of the user – Benefit function: This is part of the user specifications, and is not part of our algorithms. Each user (connection) associates a certain “benefit function” f (R) with its rate R. The simplest function f (R) = R means that we are maximizing network throughput; a linear function means we are maximizing weighted throughput. √ More interestingly, a concave function (second derivative negative, e.g. R) means that there is a curve of diminishing return associated with rate allocation for this user. For example, imagine that a traffic stream is encoded in a layered manner, and it consists of a number of streams, e.g., first 2KB is voice, next 10KB is black and white video, and last 50KB is color for the video stream. In this case, a concave benefit function may allocate $10 for the voice part, additional $5 for video, and additional $2 for color. Notice that concave functions enable one to implement some level of fairness: given 32
50KB of bandwidth, it is most “beneficial” to provide voice component for 25 connections, rather than voice + black and white video + color for a single connection since $10 x 25 = $250 is the total benefit in the former case, and $10 + $5 + $2 = $17 is the total benefit in the latter case.
4.2.2
An online auction model Let us focus on the following simple case of auctioning off an arbitrary resource, say
link capacity, in an online setting where the bids arrive sequentially and un-predictably. The input to the problem is a sequence of bids with benefits B 1 , B2 , Bk that are positive numbers in the range from α to β, generated online at times t 1 , t2 , tk ; each bid requests fraction ri of the total resource. The output is a sequence of decisions D i made online, i.e. at times t1 , t2 , tk , so that Di = 1 if the bid is accepted and Di = 0 otherwise. The total benefit of the auction is P
Bi · ri · Di and the inventory restriction is that
P
Di · ri ≤ C where C is the resource
capacity. The question is what is the optimal online strategy for decision making without knowing the future bids, given that decisions to accept “low” bids cannot be reversed after knowing about future higher bids. On the other hand, it is dangerous to wait for high bids since they may never arrive. This problem of designing a competitive online algorithm for allocating link bandwidth was shown in [1] to have a lower bound of Ω(log γ) on the competitive ratio ρ, where γ is the ratio γ = β/α between maximal and minimal benefit. It is achievable if 1/ log 2 γ of the fraction of the utilized resource necessitates doubling the price of the resource. Specifically, at time ti , the cost of the resource is defined as C i = C(ul ) = γ ul , and the decision to accept Di = 1 takes place if and only if Ci < Bi . Let P be the highest bid accepted by an optimal offline algorithm, but rejected by our algorithm. Since 1/ log 2 γ of the fraction of the utilized resource necessitates doubling 33
the price, then in order to reject a bid with benefit P , our algorithm should have set the resource cost higher than P , which means that at least 1/ log 2 γ fraction of the utilized capacity was already sold for at least half of P . So the benefit B online achieved by our online algorithm is at least Bonline > P/(2 · log 2 γ)
(4.3)
The total “lost” benefit, i.e. benefit of all the bids accepted by the offline algorithm and rejected by our algorithm, is at most P , achievable if the entire resource was sold at maximum price P by the offline algorithm. If we define B of f line as the total benefit achieved by the offline algorithm, then: Bof f line − Bonline < P
(4.4)
If we plug P from Equation 4.4 into Equation 4.3 we get B online > (Bof f line − Bonline )/(2 · log2 γ) which follows to a competitive ratio ρ of: ρ=
Bof f line < 1 + 2 · log 2 γ Bonline
(4.5)
This shows that our strategy of assigning an exponential cost to the resource leads to a competitive ratio that is within a logarithmic factor of γ.
4.2.3
Adapting the model to practice The above theory section shows how bandwidth can be rationed with a Cost-Benefit
framework leading to a near-optimal (competitive) throughput in the case of managing permanent connections in circuit-switched environments. The core theory has several assumptions which do not exactly match the reality in overlay networks. We will examine these assumptions and adapt the ideas of the CostBenefit framework to work in overlay networks. • The framework applies to permanent connections in circuit-switched environment, rather than to handling individual packets in packet-switched networks.
34
• The theoretical model assumes that the senders have instantaneous knowledge of the current costs of all the links at the instant they need to make a decision. It is also assumed that fine-grained clocks are available and essentially zero-delay responses to events are possible. • The natural application of the framework, as in the case of managing permanent virtual circuits, is to use bandwidth as the basic resource being rationed. However, available bandwidth, defined as the link capacity that can be used by our overlay protocols while fairly sharing the total capacity with the other external traffic, is not under the overlay nodes’ control. Competing external Internet flows may occupy at any point an arbitrary and time-varying fraction of the actual link capacity. Moreover, it is practically impossible to measure instantaneous available bandwidth without using invasive methods. Therefore, while available bandwidth is an essential component for performance, our protocols cannot meaningfully ration (save or waste) it, as its availability is primarily at the mercy of other applications that share the network with our overlay. (Recall that our application has to share the link bandwidth “fairly” with other external TCP flows.) This leads to the following adaptations:
Accommodating Packet Switching Although the model assumed admission control of connections in a circuit switched environment, it can be applied to packet switching in a straight-forward way. The path of each packet can be viewed as a short time circuit that is assigned by the source of the packet. For each packet, we can make a decision to accept or delay that packet individually.
Rationed Resource The underlying model does not specify which resources are to be managed by it. One of the most important issues is deciding what resource is to be controlled (rationed) since 35
not all of the resources used are controllable. Figuratively speaking, available bandwidth to flow control is like wind to sailing: it is controlled by adversarial forces rather than by us. We must try to adapt as much as possible to changing circumstances, rationing the controllable resources. Thus, we chose buffer space in each overlay node as the scarce resource we want to control. Conceptually, we model our software overlay node as a router with fixed size output link buffers where packets are placed into the appropriate output link queues as soon as the packet is received by the overlay node. Note that the number of queues is equal to the number of outgoing links, and does not depend on the number of senders, receivers or groups in the system. If a link is not congested, its corresponding queue will be empty. In this case, once a packet arrives in the buffer, it is immediately sent (maybe with a short delay due to operating system scheduling). If the incoming traffic is more than the capacity of an outgoing link, some packets will accumulate in the corresponding outgoing link buffer.
Practical Cost Function Every overlay node establishes the cost for each of its outgoing links and advertises this cost to all the other nodes. The price for a link is zero if its corresponding buffer is empty. This means that the cost is zero as long as the link is not congested, i.e. the link can accommodate all the incoming traffic. As the link gets congested and packets accumulate in the buffer, the cost of the link increases. The price can theoretically go as high as infinite when the buffer is full. In practice, the cost of the link will increase until a given value Cmax when no user will be able to buy it. Equation 4.2 from Section 4.2.1 gives the basic form of our cost function. The utilization of a link buffer is given by n/M where n is the average number of packets in the buffer and M is the desired capacity of the buffer. The cost of a link l as a function of packets in its buffer is Cl (n) = γ n/M which ranges from 1 to γ. We scale the cost of each
36
resource from 0 to Cmax (the prohibitive cost), so the cost of a link becomes: Cl (n) = Cmax ·
γ n/M − 1 γ−1
(4.6)
The theory does not make any assumptions about the user benefit function, or about the minimum and maximum user benefit that define the base of the exponent γ. If we use a large base of the exponent, then the cost function stays near zero until the buffer utilization is almost 1, and then the cost goes up very quickly. This would be acceptable if we had instantaneous feedback, but as we can only get delayed information from the network our reaction to a cost increase might be too late, allowing the number of used buffers to increase above our desired soft limit before any protocol could react and slow down the sending rate. A practical mechanism will provide incremental feedback on costs before the utilization becomes high, which calls for a small base of the exponent. For simplicity, we chose e as the base of the exponent, so finally we get: Cl (n) = Cmax ·
en/M − 1 e−1
(4.7)
Each router periodically advertises the cost of its links by multicasting a cost update message to all the other daemons through the overlay network. In Section 4.3 we show how to minimize the control traffic while maximizing the information it contains. Each sending daemon can compute the cost of a packet by summing up the cost of all the links that a packet will traverse in the multicast tree, plus a constant ∆ (packet processing cost) that will be discussed below in Section 4.2.3 . If we consider M T the set of the links belonging to a multicast tree of a packet p, then the total cost of the packet, Cp , is computed as: M T = {l|l ∈ Multicast tree of p} Cp = ∆ +
X
Cl
(4.8)
l∈M T
Given the exponential nature of our cost function, it may be possible to approximate the cost of a path with the cost of the single link having the highest utilization, as a higher utilization is likely to yield a dramatically higher cost value. This approximation can be 37
useful in systems that do not use a link-state propagation mechanism to reduce the control traffic in a way similar to distance vector algorithms. In this work we do not need to use such an approximation as we already have all of the necessary information to compute the cost of a path as the sum of the cost of all the links it uses.
Benefit Assignment The choice of benefit is tightly intertwined with the goal we want to achieve. In this work we choose to maximize the total sending throughput, which means we aim to send globally the maximum number of packets within a unit of time. As we delay packets at the entry point thorough our admission control mechanism, intuitively, the benefit of each packet increases with the time it waits to be sent. A user that has its packets delayed is more “desperate” than a user that has its packets sent immediately. In addition, we would like to encourage users that use cheap, non-congested links to forward their packets, and slow down the ones that use highly congested links. Although one would like to handle the benefit as a pure rate, in practice giving several units of benefit to a client at a time is more efficient due to the low granularity of the operating system scheduling. This is why we scale both the resource cost and the benefit functions to a value Cmax higher than γ. We define a “salary” as the amount of benefit units (say dollars) a client is given from time to time. A client is allowed to save up to S = Cmax dollars of its salary. The mechanism implements a token bucket of dollars with S, the maximum cost of a link, as the bucket size. We define the minimum benefit of a packet to be α = 1, and the maximum benefit to be β = e, achieved when the amount of accumulated tokens is S. This leads to a range from 1 to γ = e, as our initial link cost function, and we scale it in a linear function from 1 to C max , the prohibitive cost of a link. If the number of tokens available in the bucket is k, with 0 ≤ k ≤ S, the benefit of sending a packet is B = 1 + k/S · (Cmax − 1)
38
(4.9)
The sending rate of the clients is regulated by the daemon a client is connected to. The daemon acts as the client’s “agent”, purchasing packets whenever possible for the sending client. If the client wants to send a packet that costs more benefit dollars than it currently has in its budget, the daemon blocks the client by not reading from its socket anymore, and keeps the expensive packet until the client affords to buy it. This happens when the client receives more benefit dollars, or when the cost for the sending tree goes down. Since the sender will continue to accrue benefit and the links have a maximum possible cost, the packet will eventually be sent.
Packet Processing Costs A link that is not congested has a cost of zero, and a client that sends through it will see it this way until the next cost update arrives. Therefore, any client would be allowed to send an infinite number of packets on a non congested link between two cost updates, obviously leading to high burstiness and congestion on these links. A solution for this problem is to have a minimum cost per link greater than zero; however this will not scale with the size of the network (long paths could have a very large cost even if idle). Our solution is to keep the minimum link cost at zero, but add a constant cost per packet (like a processing fee). This cost is the constant ∆ referred to in Equation 4.8, and in our implementation we define it to be $1. Therefore we put a cap on the number of packets each client can send between two cost updates, even when the network cost is zero, because of the limited salary.
Non-intrusive Bandwidth Estimation Since we do not know the network capacity (assumed known by the theory), we approximate such knowledge by adaptively probing for the current network bandwidth. We choose to do this in a way very similar to TCP. When a client receives a salary, the daemon
39
checks whether the client was blocked during the last salary period (due to an intention to buy a packet more expensive that it could afford). If the client was not blocked, it means that it was able to buy, and therefore send, all the packets it initiated, so the next salary period will be exactly the same as the previous one. However, if the client was blocked, the daemon compares the cost of the most expensive packet that the client sent during the last salary period with a certain threshold H. If the maximum cost is less than the threshold, the time between two salaries is decreased, as the client might have been blocked due to processing fees on a relatively idle network. If the maximum cost is larger then the threshold H, it means that the client tried to buy expensive packets, therefore contributing to congestion in the network. The threshold H can be any arbitrary value larger than the processing fee. However, the larger the threshold is, the more likely each client will get an increase in the salary rate, even in a congested network, resulting in higher buffer occupancy. In our implementation we choose H = 2, slightly bigger than the processing fee ∆ = 1. The way we adjust the salary period follows the TCP congestion control algorithm. If the salary period should be decreased then the new salary period is: Tnew =
Told · Tupdate Told + Tupdate
(4.10)
where Told is the previous salary period and Tupdate is the minimum time between two cost updates. In our experiments, the initial salary period is 1 second. If the salary period should be increased, the new salary period will be: Tnew = 2 · Told
(4.11)
This algorithm resembles the TCP congestion control [23] where T new and Told would be the average time between two packets sent, and T update would be the round trip time. Equation 4.10 is algebraically equivalent to adding 1 to the congestion window in TCP, while equation 4.11 is equivalent to reducing the congestion window by half.
40
200
Max. buffer utilization (packets)
180 160 140 120 100 80 60
Buffer utilization No Randomization With Randomization
40 20 0
0
50
100
150
200
250 300 Time (sec)
350
400
450
500
Figure 4.1: Randomization effect on buffer utilization Cost Update Synchronization Finally, the coarse granularity of cost updates causes a high degree of synchronization between clients at the time an update is received. This synchronization phenomenon can cause oscillations in the overlay node buffers as every client buys/sends at the same time, then the cost goes up, then everybody waits for the price to go down, etc. To prevent the synchronization, the overlay node may delay a packet even though the client has sufficient funds to send it immediately. This delay will last until either another packet arrives in the sending queue, a new cost update arrives, or a short timeout elapses. Note that this scheduling delay does not reduce the client’s budget, so the main mechanism of admission control remains unchanged. Ideally, this scheduling randomization should depend on the number of senders in the system competing for a link. Propagating such an information would be prohibitively expensive, so we use an approximation in which the client sends a packet with probability 1/Cp , where Cp is the total cost of the packet, otherwise it delays the packet. The experiment depicted in Figure 4.1 demonstrates the benefit of randomization. In this experiment, our flow control is deployed on a single 2Mbps link serving 100 streams that compete over the link capacity. The figure shows the maximum buffer utilization over the last sampling interval with and without randomization. 41
4.3
Fairness and scalability What definition of fairness is best in a multicast environment is an area of active
research. For this work we choose a conservative approach of considering each link on our overlay network as one TCP flow. We fairly share each link with all the external competing traffic. Some might argue that this is too conservative, as many people may be using our multicast service at once, and each one would receive their own TCP flow if they were using a separate unicast service, but here they will share only one TCP flow. This is true. However, for the purpose of this work we tried to provide an overlay network flow control that works in any environment and thus made a conservative choice. The difference between looking at the receiving throughput and at the sending throughput when comparing a multicast protocol with TCP is big, as there can be more than one receiver for one sender. However, we try to be very conservative by taking into account the worst case scenario and analyze only the sending throughput. Giving a “fair” amount of traffic to all the senders, regardless of their intended use of network resources, is at odds with maximizing throughput of the network as a whole. We choose, by default, to provide a fair share of our overlay network resources to all senders who have the same cost per packet. That could be because their packets travel over the same multicast tree, or just by coincidence. However, senders who have higher costs, e.g. because they cross more congested links, will be allowed to send at a lower rate. This is depicted in Section 4.5 Scenario 3, where sender A-F who uses all the network links receives much less than its “fair” share of the resources.
4.3.1
Router State Scalability The cost-benefit flow control protocol provides a fine-grained level of control (per-
group, per-sender, per-packet flow control) in a complex multi-group multi-sender multicast environment, without keeping any per-flow state in the intermediate routers. The only required router state is one cost record for each outgoing link of the router. Moreover, the 42
amount of control traffic does not depend on the number of groups, senders, or receivers in the system, neither does it carry any information about them. The cost updates carry information only about the state (buffer sizes) of the links - edges in the overlay network graph. Thus, a much larger number of clients and groups, in the order of thousands to tens of thousands can be supported.
4.3.2
Frequency of Cost Updates Each daemon in the overlay network multicasts a cost update at every T max interval
as long as its outgoing links are not congested, or their costs did not change significantly. However, if at least one of its links becomes congested - the link cost increases - the daemon will send more frequent cost updates, at T min intervals. This mechanism is based on the observation that, in general, in a multicast tree there are only a few bottleneck links that will limit the speed of the entire tree. Moreover, it is likely that the bottleneck links for different senders or groups will be the same. Therefore, only the daemons that control bottleneck links will send frequent cost updates, while the others will not contribute much to the control traffic. Since the cost updates are very small (64 bytes in our implementation), they are piggy-backed with the data packets whenever possible. Electing the values of the advertising intervals Tmax and Tmin is a compromise between the control traffic we allow in the network and the performance degradation due to additionally delayed feedback. They depend also on the diameter of the network, the maximum client link bandwidth, and the size of buffers in the intermediate nodes. In our experiments we show that in practical overlay networks with delays in order of tens of milliseconds and throughput in the order of megabits per second, values such as Tmax = 2.5 seconds, and Tmin 50 milliseconds, coupled with overlay buffers of about 100 packets, achieve good performance. For an overlay network with the average link bandwidth of 2Mbps this leads to a control traffic of about 0.5 percent per congested link, and 0.01 percent per non-congested link. We believe that for higher throughput networks we may need to either send cost updates more often or increase the size of the overlay buffers. 43
4.4
The Cost-Benefit protocol To summarize, we present the Cost-Benefit protocol below:
• On each topology change, the overlay routers compute their routing tables, and the set of links in the overlay that will be used by their clients to multicast packets • When an overlay node needs to forward a packet, if the reliability window of the downstream link is full, the overlay node will buffer the packet. For all its downstream links that have at least a packet in their buffer, the overlay node computes the link cost Cl and multicasts it to the other routers every T min interval. For all other links, the overlay node advertises a zero cost every T max interval. • Overlay nodes maintain a token-bucket budget and a token rate for each of their clients. The cost of a packet is computed based on the cost of the links that packet will use, and is subtracted from the budget (token bucket) of the client that sent it. • Clients that cannot afford sending their current packet are blocked until either their budget increases (they get more tokens) or the cost of sending their current packet decreases. • The token rate of the clients “salary period” is adjusted only for clients that are blocked: If the most expensive packet they bought over the last salary period was higher than the threshold, their salary period doubles (the rate is reduced by half). Otherwise, the new salary period Tnew becomes: Tnew =
Told · Tupdate Told + Tupdate
(4.12)
where Told is the previous salary period and Tupdate is the minimum time between two cost updates.
44
...
Scdg1 Scdg2 Scdgn
bps
C
A
A-CFG ...
Sacfg1 Sacfg2 Sacfgn
s m 0.1
00 ;1
M
bp
5ms 10Mbps
s
A-CFG
20ms 10Mbps
B
1 1M 5m bp s s Congested link Flow of multicast senders
F 25 2M ms bp s
1 10 0m M s bp s
C-DG
0.1 ms; 100 M
E
3 10 0m M s bp s
D
G
Figure 4.2: Scenario 1: Network Configuration
4.5
Simulation results We used the ns2 network simulator [49] to evaluate the performance and behavior of
our flow control protocol. The main issues we focused on are: • Optimal network resource utilization; • Automatic adjustment for dynamic link capacities; • Optimal sharing of network resources to achieve maximum throughput; • Fairness between flows using the same congested links; • Scalability with number of clients, groups and diameter of the network; Scenario 1 – achieving the optimal network throughput: We used the multicast tree shown in Figure 4.2, with the link capacities and latencies as shown in the figure. All the intermediate buffers in the network have a soft limit of 100 packets. Clients receive a $10 salary, and they can save up to S = C max = $20 in their budget. The processing fee is ∆ = $1/packet. Two classes of 20 separate clients each initiate multicast messages, S acf g and Scdg . Receiver clients are connected to nodes C, D, F and G. For simplicity we do not show the receiving clients, but only the daemons they are connected to. The S acf g clients multicast 45
2.5
160 140 Max. buffer utilization (packets)
Throughput (Mbits/sec)
2
1.5
1
0.5
0
Sending flows A - CFG C - DG 0
50
100
Figure 4.3: Throughput
150
200
250 300 Time (sec)
Scenario
1,
350
400
120 100 80 60 Queues E-F B-D
40 20
450
0
500
Simulation:
0
50
100
150
200
250 300 Time (sec)
350
400
450
500
Figure 4.4: Scenario 1, Simulation: Buffers
to receivers connected to nodes C, F and G, and the S cdg clients multicast to receivers connected to nodes D and G, sharing the links B-C, B-E and E-G. S acf g clients are limited by the 2Mb bottleneck link E − F , and S cdg clients are limited by the 1Mb link B − D. There are no other bottleneck links in the system. The aggregate sending throughput of the two flows is shown in Figure 4.3. The two flows achieve maximal network usage, S acf g clients getting on average 1.977 Mbps and S cdg getting 0.992 Mbps. Rather than looking at the instantaneous buffer occupancy which is very dynamic and depends on the sampling frequency, we chose to analyze the evolution of the upper bound of the buffer utilization. We measure the maximum buffer size over the last sampling period and present it in Figure 4.4. The reason for a higher buffer utilization on link E − F is that there is a higher feedback delay from node E to node A (25 milliseconds) than from node B to node C (10 milliseconds), as in Figure 4.2. Link E − F also experiences higher variability in buffer utilization and throughput. In general, higher latency paths will experience higher variability in throughput and buffer occupancy. Scenario 2 – fair sharing of network resources: To examine the effect of a congested link, the network shown in Figure 4.5 is used. Here, link E − G forms the 46
Scdgn
50000 bps
C
A
A-CFG Sacfg1 Sacfg2
M
...
0 10 s; m 0.1
Sacfgn
bp
5ms 10Mbps
s
A-CFG
20ms 10Mbps
B
E
1 10 5m M s bp s
Congested link Flow of multicast senders
F 25 10 ms M bp s
1 10 0m M s bp s
C-DG
0.1 ms; 100 M
Throughput (bits/sec)
...
Scdg1 Scdg2
3 2M 0m bp s s
30000
20000
10000
G
D
40000
0
0
5
10 Sender Number
Figure 4.5: Scenario 2: Network Topology
15
20
Figure 4.6: Scenario 2, Simulation: Fairness 180
2.5
Flows A - CFG C - DG
2
140 Throughput (Mbits/sec)
Max. buffer utilization (packets)
160
120 100 80 60
Queues E-G
40
1.5
1
0.5
20 0
0
100
200
300 Time (sec)
400
500
0
600
Figure 4.7: Scenario 2, Simulation: Buffers with delayed senders
0
100
200
300 Time (sec)
400
500
600
Figure 4.8: Scenario 2, Simulation: Throughput with delayed senders
bottleneck for both flows. Each flow represents 20 sending clients. The two flows share the bottleneck link fairly equal. Flow S acf g gets an average of 997.3 Kbps and flow Scdg gets an average of 997.6 Kbps, while the buffer of the link G − E stays below 150 packets. The various clients who make up each flow also share the bandwidth fairly. In Figure 4.6, we show the sending throughput achieved by each of the 20 Sacf g clients. The variance of the clients throughput was less than 4.6%. A second experiment uses the same tree configuration as Figure 4.5 but starts the second group of senders Scdgg only after 200 seconds, and also changes the bandwidth of the link E-G to 1Mbps after 400 seconds. Figure 4.7 shows the maximum buffer utilization
47
on the links E-G, B-D and E-F. After 200 seconds, as well as after 400 seconds we do not see any major change in the buffer utilization on the bottleneck link. Specifically, there is no large spike in maximum utilization when the second group of clients begins sending all at once, or when the bottleneck link reduces its capacity by half. This is because the link has an existing non-zero cost and so the clients must pay that cost before sending. Figure 4.8 shows how the throughput of the two groups of clients responds to the new load, or change in the available bandwidth, sharing fairly the congested link. The response time for adjusting the rate of the flow Sacf g when the second flow is introduced was under 5 seconds. Scenario 3 – unicast behavior and comparison with TCP: Our flow control tries to maximize throughput by allowing low cost packets to pass, and reducing high cost traffic. A simple way to demonstrate this is to set up a chain network in which some clients try to send their packets across the entire network, while other clients use only one link in the chain. Figure 4.9 shows such a network with 5 links connected in a chain. One client sends from node A to node F, and 5 other clients send only over one link, i.e. from B to C or from E to F. Figure 4.10 shows the throughput on the chain network as short path connections start up every 150 seconds. The client A-F starts trying to use the entire capacity of the network. When the client A-B starts, they share the congested link, AB, about equally. When the third client, B-C, starts at time 300, the long flow A-F slows down letting short flows use the available bandwidth. As we add more congested links by starting more short connections, the throughput of the flow A-F goes almost to zero, thus almost maximizing the global throughput of the system. If the flow control had been fair, the aggregate throughput would be 6 Mbps, 1 Mbps for each client. We achieved an aggregate throughput after all clients have started of 9.677 Mbps, while the theoretical maximum is 10 Mbps. The results of the previous simulation present a definite bias toward short flows and show how such a bias can increase network throughput. One can view reliable unicast
48
A-B
0.1ms 100Mbps
Sbc 0.1ms 100Mbps
A
C-D
B-C
Sab
7ms 2Mbps
B
D-E
Scd 0.1ms 100Mbps 7ms 2Mbps
E-F
Sde 0.1ms 100Mbps 7ms 2Mbps
C
D
Sef 0.1ms 100Mbps 7ms 2Mbps
E
7ms 2Mbps
F
0.1ms 100Mbps Saf
Unicast flow A-F
Figure 4.9: Scenario 3: Network Configuration connections as a special case of reliable multicast, and in this experiment we show that our cost-benefit flow control achieves similar behavior to that of a set of end-to-end connections using TCP on the same network. Figure 4.11 presents the throughput on the same chain network, only instead of hop-by-hop connections regulated by our flow control, we run end-to-end TCP connections. With end-to-end TCPs, the long A-F connection is biased against in the same way as our flow control. Moreover, when competing with only one other TCP flow A-B, the longer flow A-F receives less bandwidth. We believe this is because TCP is biased against both long RTT connections as well as having to cross multiple congested links. So even when only one link is congested, the longer RTT of the A-F flow causes it to receive lower average bandwidth then the short RTT A-B flow. Scenario 4 – scalability with number of nodes and groups: In order to see how a large number of clients multicasting to many different groups share the network resources, we set up the network presented in Figure 4.12. The overlay network consists of 1602 nodes, and there are 1600 clients, each of them connected to a separate daemon, joining 800 different groups. We could not run a bigger scenario due to memory limitation using the ns simulator on our machines. Each of the clients S1 to S800 multicasts to a different group composed of three different receivers. S1 sends to R1 , R2 and R3 , S2 sends to R2 , R3 and R4 , and so on, until
49
2.5
2
2 Throughput (Mbits/sec)
Throughput (Mbits/sec)
2.5
1.5
1
Senders A-F A-B B-C C-D D-E E-F
0.5
0
0
100
200
Figure 4.10: Throughput
300
400
500 600 Time (sec)
700
Scenario 3,
800
1.5
1
Senders A-F A-B B-C C-D D-E E-F
0.5
900
0
1000
Simulation:
0
100
200
300
400
500 600 Time (sec)
700
800
900
1000
Figure 4.11: Scenario 3, Simulation: TCP throughput 180
C2
10 5ms M bp s
0.1ms 100Mbps
A
10ms 2Mbps
s s 5m bp M 10
B
s s 5m bp M 10
Cn
10 5ms M bp s
D1
0.1ms R1 100Mbps
D2
0.1ms R2 100Mbps
…
Sn
0.1ms 100Mbps
C1
Dn
800 receivers
S2
0.1ms 100Mbps
…
800 senders
S1
Max. buffer utilization (packets)
160
0.1ms Rn 100Mbps
140 120 100 80 60 40 20
Figure 4.12: Scenario 4: Network Topology
0
0
100
200
300 400 500 Number of senders
600
700
800
Figure 4.13: Scenario 4, Simulation: Buffers S800 that sends to R800 , R1 and R2 . All the senders share the same bottleneck link, A-B. We ran the simulation with different number of senders, from 5 to 800. As shown in Figure 4.13 the maximum buffer utilization on the bottleneck link A-B stays about the same until the number of senders reaches to the buffer soft limit (in our case, 100), and then it starts increasing. However, the Cost-Benefit framework kept the buffer size under controllable limits (under 170 packets for 800 senders). The aggregate throughput was not affected by the number of senders, getting an average of 1.979Mbps for the aggregate sending rate of 800 senders.
50
2
1.6
1.8
1.4
1.4
Throughput (Mbits/sec)
Throughput (Mbits/sec)
1.6
1.2 1 0.8 0.6 0.4
Sending flows A_CFG C-DG
0.2 0
0
200
400
600
800
1 0.8 0.6 0.4 Receiving flows A_CFG C-DG
0.2 1000
Time (sec)
Figure 4.14: Scenario 1, Emulab: Sending throughput
4.6
1.2
0
0
100
200
300
400
500 600 Time (sec)
700
800
900
1000
Figure 4.15: Scenario 1, Emulab: Receiving throughput
Simulation validation on an emulated wide area testbed Spines provides multicast through the mechanism described in Chapter 3, and allows
use of a reliable protocol on the overlay links. However, in the current implementation Spines offers end-to-end reliability guarantees only for unicast communication, and not for multicast. Although the global flow control described in this chapter is not dependent on the end-to-end reliability mechanisms, we chose to evaluate our protocols in a reliable multicast environment. We implemented our global flow control algorithm in the Spread wide area group communication system [50, 51]. The Spread system provides a similar architecture to our model with daemons running on end-hosts acting as routers in an overlay network. Spread provides strong semantics for messages including reliable multicast, message ordering guarantees (unordered, fifo, total order), and a membership service supporting Extended Virtual Synchrony (EVS) [52] and Virtual Synchrony (VS) [53] models. It is designed to support a small to medium number of members of a group (1-1000’s), with a large number of active groups and many senders. The Spread system provides end-to-end multicast reliability by using a reliable point-to-point protocol for each link on the overlay network [36] and through a group membership service.
51
We run Spread on the Emulab [54] testbed, where we created the network setups of Scenario 1 and Scenario 2 presented in Section 4.5. Emulab is a network facility that allows real instantiation in a hardware network (composed of actual computers and network switches) of a given topology, simply by using an ns script in the configuration setup. Link latency, capacity and loss are emulated using additional computers that delay packets or drop them with certain probability or if their rate exceeds the requested link capacity. The emulated link latencies for the above scenarios measured with ping were accurate up to a precision of 3ms, while the throughput measured by TCP flooding was 1.91Mbps for the 2Mbps bottleneck link and 0.94Mbps for the 1Mbp link. Spread has its own overhead of about 15% of data sent due to headers required for routing, group communication specific ordering and safety guarantees, as well as to provide user-friendly group names of up to 32 characters. In addition, any node that is not part of receiver set of a multicast message does not receive the actual message, but must receive a 96 byte ordering header required for group communication guarantees to be maintained, no matter how big the message is. Therefore, receiver D in Scenario 1 receives a message header for each message sent in the S ACF G flow. Note that Spread allows messages to be as large as 100 KB. What we measured in our results is actual user data sent and received by clients connected to Spread, sending 1200 byte messages. For these experiments we gave each client a $10 salary, and allowed up to $20 of savings. The processing fee was $1. All the overlay network links had a soft buffer limit of 100 packets. Figure 4.14 shows the sending throughput of the two flows in Scenario 1, while Figure 4.15 shows the receiving throughput at the nodes behind bottleneck links. The Sacf g flow achieved a sending rate of 1.53Mbps while the S cdg flow achieved 664Kbps. Taking into account the Spread overhead and meta-headers this leads to a total throughput of 1.9Mbps for the Sacf g flow and 904Kbps for the Scdg flow. Comparing these numbers with the available bandwidth offered by the Emulab setup, we obtain a difference
52
2
1.6
1.8
Sending flows A_CFG C-DG
1.4
1.4
Throughput (Mbits/sec)
Throughput (Mbits/sec)
1.6
1.2 1 0.8 0.6 0.4
1.2 1 0.8 0.6 0.4 0.2
0.2 0
Receiving flows A_CFG C-DG
0
200
400
600
800
1000
0
Time (sec)
Figure 4.16: Scenario 2, Emulab: Sending throughput
0
100
200
300
400
500 600 Time (sec)
700
800
900
1000
Figure 4.17: Scenario 2, Emulab: Receiving throughput
of about 4% between what we get and the available network resources. Figure 4.16 and Figure 4.17 show the sending and receiving throughput achieved by Spread clients in Scenario 2. As we start the S cdg flow at time 300 we see the two flows fairly share the bottleneck link. Similarly, when the available bandwidth on the bottleneck link drops to 1Mbps at time 600, both flows adapt to the network conditions by reducing their rate to half. The above experiments show that the system implementation of our cost-benefit flow control achieves good performance on a controlled emulated testbed with real computers and networks. We achieve similar results to the simulated experiments, showing the feasibility of our adaptation of the theoretical model to practical networked environments.
4.7
Real-life Internet experiments To further validate our results and demonstrate real-life behavior we conduct exper-
iments over a portion of the CAIRN network [55]. This is a wide-area network that crosses the entire United States, and consists of links that range from 1.5Mbps to 100 Mbps. The CAIRN routers are Intel machines that run FreeBSD. Figure 4.18 shows the portion of the CAIRN network that we used for our experiments. We measured individual link latencies
53
2 1.8 tisepc.cairn.net
A C
RB RA
B isipc2.cairn.net
33.7ms 1.89Mbps
RA
isiepc3.cairn.net
D
0.07ms 71.23Mbps
F
S2
isiepc2.cairn.net
s s m bp 07 0. .01M 70
0 92 .09 .6M ms bp s
isipc.cairn.net
1.6
RB RB
s ps 8m b 2. 6M 4 1.
s m s .6 bp 25 4M 1 2.
S1
E
Throughput (Mbits/sec)
kupc.cairn.net
mitpc2.cairn.net
G
5.15ms 12.0Mbps
H
S3
isipec.cairn.net
1.4 1.2 1 0.8 0.6 0.4
RA
RB
Sending flows S1 S2 S3
0.2 0
0
50
100
150
200
250 300 Time (sec)
350
400
450
500
Figure 4.18: CAIRN: Network Topology Figure 4.19: CAIRN: Sending throughput using ping under zero traffic, and the available bandwidth with point to point TCP connections for each link. Note that our flow control uses the available bandwidth given by the underlying TCP link protocol, and not the physical bandwidth of the network. Sender S1 multicasts messages to a group A joined by the receivers R A , while senders S2 and S3 multicast to a group B joined by the receivers R B . All the clients run directly on the overlay network machines, connected to the daemons through Unix Domain Sockets. Obviously, S1 was limited by the bottleneck link C-D, while S 2 and S3 had to share the bottleneck link D-E. Taking into account the data overhead in Spread, we can see in Figure 4.19 that the sending clients use the network resources optimally and share them fairly between senders S2 and S3 , S1 getting 1.417 Mbps, while S2 and S3 got 0.618 and 0.640 Mbps respectively. Comparing these numbers with the available bandwidth offered by CAIRN we achieve a difference between 1% and 14%. The uncontrollability of the Internet network conditions did not affect the performance of our protocol. The real-life Internet experiments show that different senders located at different sites and multicasting messages to the same or different groups achieve near optimal bandwidth utilization and fairly share the network resources.
54
Chapter 5
Reducing Latency in Reliable Communication Using Overlay Networks The overlay network paradigm gives us the flexibility to deploy custom protocols on the links of the virtual topologies we create. In this chapter, we present a reliable protocol that uses reliable overlay links in order to reduce the end-to-end latency and jitter of communication. Reliable point-to-point communication is one of the main uses of the Internet, where over the last few decades TCP has served as the dominant protocol. Over the Internet, reliable communication is performed end-to-end in order to address the severe scalability and interoperability requirements of a network in which potentially every computer on the planet could participate. Thus, all the work required in a reliable connection is distributed only to the two end nodes of that connection, while intermediate nodes route packets without keeping any information about the individual packets they transfer. In overlay networks, reliable communication is usually achieved by applying TCP on the edges of a connection. This surely works. However, in this chapter we argue that 55
employing hop-by-hop reliability techniques considerably reduces the average latency and jitter of reliable communication. When using such an approach one has to consider networking aspects such as congestion control, fairness, flow control and end-to-end reliability. We discuss these aspects and our design decisions in Section 5.1. In Section 5.2, we demonstrate through simulation that our approach provides tremendous benefit for the application as well as for the network itself, even when very few packets are lost. Simulations usually do not take into account many practical issues such as processing overhead, CPU scheduling, and most important, the fact that overlay network processing is performed at the application level of general purpose computers. These may have considerable impact on real-life behavior and performance. Therefore, we test our approach in practice using our overlay network platform, Spines. We run the same experiments that were simulated, on a Spines overlay network. The results are presented in Section 5.3. We show that the benefit of hop-by-hop reliability greatly overcomes the overhead of overlay routing and achieves much better performance compared to standard end-to-end TCP connections deployed on the same overlay network.
5.1
Hop-by-hop reliable communication in overlay networks The easiest way to achieve reliability in Overlay Networks is to use a reliable protocol,
usually TCP, between the end points of a connection. This mechanism has the benefit of simplicity in implementation and deployment, but pays a high price upon recovery from a loss. As overlay paths have higher delays, it takes a relatively long time to detect a loss, and data packets and acknowledgments are sent on multiple overlay hops in order to recover the missed packet.
5.1.1
Hop-by-hop reliability We propose a mechanism that recovers the losses only on the overlay hop on which
they occurred, localizing the congestion and enabling faster recovery. Since an overlay link 56
A-F
0.1ms 100Mbps
A-B
A
10ms 10Mbps
B-C
B
C-D
10ms 10Mbps
C
D-E
10ms 10Mbps
D
E-F
10ms 10Mbps
E
10ms 10Mbps
F
0.1ms 100Mbps Unicast flow A-F
Figure 5.1: Chain Network Setup has a lower delay compared to an end-to-end connection that traverses multiple hops, we can detect the loss faster and resend the missed packet locally. Moreover, the congestion control on the overlay link can increase the congestion window back faster than an end-toend connection, as it has a smaller round-trip time. Hop-by-hop reliability involves buffers and processing in the intermediate overlay nodes. These nodes need to deploy a reliable protocol, and keep track of packets, acknowledgments and congestion control, in addition to their regular routing functionality. Although such an approach may not be feasible to implement at the level of the Internet routers due to scalability limitations, we can easily deploy it at the level of an overlay network, thus allowing us to pinpoint the congestion, limiting the problem to the congested part of the network. Let us consider a simple overlay network composed of five 10 millisecond links in a chain, as shown in Figure 5.1. Such a network may span a continent such as North America or Europe. Every time a packet is lost (say on middle link C-D), it will take at least 50 milliseconds from the time that packet was sent until the receiver detects the loss, and at least 50 additional milliseconds until the sender learns about it. The sender will retransmit the lost packet that will travel 50 more milliseconds until the receiver will get it. This accounts for a total of at least 150 milliseconds to recover a packet. If the sender continues to send packets during the recovery period, even if the new packets arrive at the receiver
57
in time (assuming no loss for them), they will not be delivered at the receiver until the missing packet is recovered, as they are not in order. Our experimental results presented in Sections 5.2 and 5.3 show that the number of packets delayed is much higher than the number of packets lost. Let us assume that we use five reliable hops of 10 milliseconds each instead of one end-to-end connection. Suppose the same message is lost on the same intermediate link, as in the above scenario. On that particular link (with 10 milliseconds delay) it will take only about 30 milliseconds for the receiver to recover the missed packet. Moreover, as the recovery period is smaller, a smaller number of out of order packets will be delayed. This effect becomes even more beneficial as the throughput increases.
5.1.2
End-to-end reliability and congestion control Simply having reliable overlay links does not guarantee end-to-end reliability. Inter-
mediate nodes may crash, overlay links may get disconnected. Such events are not likely to happen and most of the reliability problems (generated by network losses) are indeed handled locally at the level of each hop. However, in order to guarantee end-to-end reliability, some of the packets can only be recovered from the initial sender in case of intermediate node failure or route changes. We still need to send some end-to-end acknowledgments from the end-receiver to the initial sender, at least once per round-trip time, but not for every packet. This means that for some of the packets we will pay the price of sending two acknowledgments, one on each of the overlay hops for local reliability, and one end-to-end, that will traverse the entire overlay path. However, acknowledgments are small and are piggy-backed on the data packets whenever possible. We believe that the penalty of sending double acknowledgments for some of the packets is drastically reduced by resending the missed data packets (which are much bigger than the acknowledgments) only locally, on the hop where the loss occurred, and not on the entire end-to-end path. Intermediate overlay nodes handle reliability and congestion control only for the links
58
to their immediate neighbors and do not keep any state for individual flows in the system. Packets are forwarded and acknowledged per link, regardless of their originator. This is essential for the scalability with the number of reliable sessions in the system. Since the packets are not needed in order at the intermediate overlay nodes, but only at the final destination, in case of a loss there is no need to delay the following packets locally on each link in order to forward them FIFO on the next link. We choose to forward the packets even if out of order on intermediate hops, and reestablish the initial order at the end receiver. Our tests show that out of order forwarding reduces the burstiness inside the network. It also contributes to the reduction of the end-to-end latency (although that contribution is not as significant as the latency reduction achieved by the hop-by-hop reliability). The latency effect of out of order forwarding is magnified when multiple flows use the same overlay link. In that case, they do not need to reorder packets with respect to each other but only according to their own packets. The same occurs when more than one overlay link is congested and looses packets. Overlay links are seen as individual point-to-point connections by the underlying network. Since overlay flows coexist with external traffic, each overlay link needs to have a congestion control mechanism in place. Our approach uses a window-based congestion control on each overlay link, that very closely follows the slow start and congestion avoidance of TCP [23]. We define the available bandwidth of an overlay link as the throughput achievable by a TCP-fair protocol on that link. The available bandwidth is different on each overlay link, depending on the underlying network characteristics, and is also dynamic, as the overlay link congestion control adjusts to provide fairness with the external traffic. If, at an intermediate node, the incoming traffic is higher than the outgoing available bandwidth of the overlay link, that node will buffer the incoming packets, but if the condition persists it will either store an infinite number of packets or will start dropping them. Since
59
end-to-end recovery is expensive, there needs to exist a congestion control mechanism that will limit, or even better, avoid dropping packet at the overlay level. As opposed to the regular mechanism in TCP that uses packet losses to signal congestion, we use an explicit congestion notification scheme [56] where congested routers stamp the header of the data packets. Upon receiving such a stamped packet, the end receiver will send an end-toend acknowledgment signaling the congestion immediately, and the sender’s congestion control will treat that acknowledgment as a loss, even though the sender will not resend the corresponding packet. Note that the initial sender still sends retransmissions if necessary (e.g. in case of node failures and rerouting). Since end-to-end acknowledgments are not sent for every packet, the end-to-end window may advance in big chunks once a cumulative acknowledgment is received. If the network path is not congested, this phenomenon does not affect the burstiness of the traffic, as the sending throughput is anyway smaller than the size of the window. However, in case of congestion the receiver sends end-to-end acknowledgments for every packet (stamped by an intermediate overlay router that is congested) until the congestion is resolved. We use a daemon-client architecture, where applications connect to overlay nodes in order to send or receive messages, and overlay daemons are responsible to distribute messages towards receiving applications. If an application is slow in receiving messages (even though the overlay network is not congested), an end to end flow control mechanism should slow down the sender application. We use an approach similar to TCP flow control, where the end-to-end acknowledgments contain an advertised window parameter, which represents the number of packets that can be buffered by the receiving overlay node in case the application does not read them. We assume that the receiving buffer is larger than the end-to-end congestion window. When running the congestion control mechanism, the sender will consider the minimum between the computed congestion window and the advertised window received from the receiver. If the receiving buffer is full, the advertised window will be zero, and therefore the sender will stop sending. Note that in our approach every application can be both sender and receiver. 60
10000
TCP 10ms TCP 50ms
9000
TCP Throughput (Kbps)
8000 7000 6000 5000 4000 3000 2000 1000 0
0
0.2
0.4
0.6
0.8 1 1.2 Loss rate (%)
1.4
1.6
1.8
2
Figure 5.2: TCP throughput (analytical model)
5.1.3
Fairness We intend to deploy our protocols on the Internet, and therefore we need to share the
global resources fairly with the external TCP traffic. A “TCP-compatible” flow is defined in [57] as one that is responsive to congestion notification, and in steady state, it uses no more bandwidth than a conformant TCP running under comparable conditions (loss rate, round-trip time, packet size, etc.). The throughput obtained by a conformant TCP flow is evaluated analytically in [58], where the authors approximate the bandwidth B of a TCP flow as a function of packet size s, loss rate p and round-trip time RT T , where T 0 is the retransmission timeout and b is the number of packets that have to be received before sending an acknowledgment. s
B= RT T
q
2bp 3
+ T0 3
q
3bp 8 p(1
+ 32p2 )
Considering b = 1 and T0 = RT T in the ideal case, on a network topology such as in in Figure 5.1 the throughput obtained by an end-to-end TCP connection (50 millisecond delay) and by a short one hop TCP connection (10 millisecond delay on link CD) sending 1000 byte packets are shown in Figure 5.2 as a function of loss rate. Clearly, an end-to-end reliable connection with a delay of 50 milliseconds will achieve
61
less bandwidth than a hop-by-hop flow that will be limited only by the short bottleneck link C-D with 10 milliseconds delay, where the losses occur. This phenomenon happens because TCP throughput is biased against long connections. Analytically, RT T appears at the denominator of the throughput formula, and in practice it will take more time for the long connection to recover its congestion window (the congestion avoidance protocol adds one to the congestion window for each RT T ). Note that achieving more throughput by a hop-by-hop flow does not happen with respect to external TCP connections that run outside of the overlay traffic. Each of the overlay links provide congestion control and fairness with respect to the external flows. However, a fair comparison of the end-to-end throughput obtained by a single flow traversing multiple hops on the overlay network with one that uses the Internet directly cannot be done because of several factors: • Flows that run within the overlay network usually have longer paths (higher delay) than direct Internet connections (due to the overlay routing which is usually far from optimal), and therefore achieve less throughput. • In general, multiple connections coexist within an overlay network, so there is more than one stream using a single overlay link. In that case, multiple streams will share a single overlay link using only a part of what they could get if each of them used the Internet directly by opening a separate TCP connection. One way to give each flow a fair share of the total bandwidth is to open multiple connections between two overlay nodes depending on the number of internal flows using that overlay link. Another way is to modify the congestion control on the overlay links to take into account the number of independent flows that traverse that link, and behave as a number of TCP flows run in parallel. Spines, our overlay network system presented in Section 2.2, provides such an optional mechanism for experimentation purposes. Spines can determine the number of flows for which packets are kept in the current congestion window,
62
Table 5.1: Average latency for under loss Protocol Avg. delay (ms)
Tahoe 407.49
Reno 217.52
NewReno 155.76
SACK 144.70
Fack 84.66
Vegas 74.07
Redhat 7.1 90.06
Spines 117.55
and consider the congestion window of the overlay link as a sum of multiple windows for each flow. However, in this work we see an overlay network as a single distributed application, no matter how many internal flows it carries; therefore, an overlay link gets only one share of the available bandwidth. Some mechanisms can be deployed in order to limit the internal hop-by-hop throughput to the one obtained by an end-to-end connection that uses the overlay network. Such mechanisms can evaluate the loss rate and round-trip time of a path and adjust the sending rate accordingly, in a way similar to [59]. We believe such mechanisms are not necessary in our case - since we provide end-to-end congestion control, obtaining more throughput is just an effect of pinpointing the congestion and resolving it locally. However, in all the experiments of this chapter we choose a conservative approach and limit the sending throughput to values achievable by both end-to-end and hop-by-hop flows, and focus only on the packet latency of the connections.
5.2
Simulation Environment and Results In this section we analyze the multihop reliability behavior using the ns2 simulator
[49]. We run a simple end-to-end TCP connection from node A to node F on a network setup as shown in Figure 5.1, while changing the packet loss rate on link C-D. Since we focus on the latency of reliable connections, we limit the sending throughput to the same value for end-to-end and hop-by-hop flows in order to keep the same network parameters for our latency measurements. For a fair analysis, in the experiments presented in this chapter we compare an end-
63
to-end path with an overlay path composed of multiple links that total the same network latency. Depending on the underlying topology and the placement of overlay nodes, using an overlay network can reduce or increase the end-to-end latency of a connection. For example, Akella et al [60] show that in over 30% of the cases, using an overlay network can decrease the connection latency by optimizing the Internet path selection. If the overlay path chosen is longer than the direct end-to-end connection, the latency difference manifests itself as a constant overhead of the overlay approach. However, our results show that the performance difference between the end-to-end and hop-by-hop approaches grows dramatically with the increase of the network loss rate, greatly overcoming the latency overhead of using an overlay network. We record the delay of each packet for the different sending rates and packet loss for both end-to-end and hop-by-hop reliability approaches. We define the delay of a packet as the difference between the time the packet was received at the destination, and the time it was initiated by a constant rate sending application. Note that there is a difference between the time a packet is sent by an application and the time that packet is actually put on the network by the reliable protocol (in our case, TCP). If TCP shrinks its window or reaches a timeout, it will not accept or send new packets until it has enough room for them. During this time, the new packets generated by the application will be stored in a buffer owned either by the host operating system or by the application itself. We believe that a delay measurement that is fair to the application would count the time spent by packets in these buffers as well. The ns2 simulator offers a variety of TCP implementations. Out of these, we used TCP-Fack - TCP with forward acknowledgments - as we believe it resembles a behavior closest to the actual TCP implementation in the Linux Redhat 7.1, that we use in Section 5.3. The Linux kernel allows adjustment of different TCP parameters (for example, turning off forward acknowledgments would give us a version similar to TCP-SACK), however we opted for leaving the default protocol in the kernel unaltered.
64
450
600
End-to-End Hop-by-Hop
400
500
300
Average delay (ms)
Average delay (ms)
350
250 200 150 100
400 300 200 100
50 0
End-to-End Hop-by-Hop
0
0.2
0.4
0.6
0.8 1 1.2 Loss rate (%)
1.4
1.6
1.8
0
2
Figure 5.3: Average delay for a 500 Kbps stream (simulation)
0
0.2
0.4
0.6
0.8 1 1.2 Loss rate (%)
1.4
1.6
1.8
2
Figure 5.4: Average delay for a 1000 Kbps stream (simulation)
Table 5.1 shows the average packet delay given by different TCP variations in ns2, as well as the Linux TCP implementation and the Spines reliable link protocol (described in Section 2.2) when a 500Kbps stream is sent on an end-to-end A-F connection in the network showed in Figure 5.1, with link C-D experiencing 1% loss. The Redhat 7.1 TCP and the Spines link protocol delays were measured on an emulated network setup described in Section 5.3. We compare the performance of the standard end-to-end approach to that of our hopby-hop approach, where we forward packets reliably on each link, A-B, B-C, ... up to link E-F. For hop-by-hop reliability we use a modified version of TCP-Fack: the initial sender (at node A) adds its original sequence number in an additional packet header, intermediate receivers deliver packets out of order, and the destination delivers packets FIFO according to the original sequence number available in the new header. We did not change the congestion control or the send and acknowledge mechanisms in any way. We verified that our modified TCP and the original TCP-Fack in ns2 behave identically with respect to each individual packet on a point-to-point connection under different loss rates. All the simulations in this section were run for 5000 seconds, sending 1000 byte messages. Figure 5.3 shows that the average delay for a 500 Kbps data stream increases faster with an end-to-end connection while a hop-by-hop flow maintains a low average delay even 65
End-to-End Hop-by-Hop
600
Jitter (ms)
500 400 300 200 100 0
0
0.2
0.4
0.6
0.8 1 1.2 Loss rate (%)
1.4
1.6
1.8
2
Figure 5.5: Average jitter for a 500 Kbps stream (simulation) when it experiences a considerable loss rate. This phenomenon is magnified as the throughput required by the flow increases, as depicted by Figure 5.4 for a 1000 Kbps data stream. Jitter is an important aspect of network protocols behavior due to its impact both on other flows at the network level and on the application served by the flow. Figure 5.5 shows that the jitter of an end-to-end connection is considerably higher and increases faster than the jitter of a hop-by-hop connection for a 500 Kbps stream. We computed the jitter as the standard deviation of the packet delay. It is interesting to see the distribution of the packet delay for a certain loss rate. In Figure 5.6, we see that for a 500 Kbps data stream under 1% loss rate, over 27% of the packets are delayed more than 60 milliseconds (including the 50 milliseconds network delay) for an end-to-end connection, while for a hop-by-hop connection only about 3% of the packets are delayed more than 60 milliseconds. Similarly, about 18% of the packets are delayed more than 100 milliseconds by the end-to-end connection, while for a hop-by-hop connection only 1% of the packets are delayed as much. Note that the actual number of packets delayed is much higher than the number of packets lost. We studied how the performance is affected by the number of intermediate reliable hops in an overlay network. We consider the same network of 50 milliseconds delay, and we measure the percentage of packets that are delayed as we increase the number of interme66
30
70
End-to-End Hop-by-Hop
Delayed packets (%)
Percentage of packets (%)
25 20 15 10 5 0
2% loss 1% loss
60 50 40 30 20 10
60
80
100
120
140 160 180 200 Delay more than (ms)
220
240
260
0
280
Figure 5.6: Packet delay distribution for a 500 Kbps stream (simulation)
1
2
3
4
5 6 Number of hops
7
8
9
10
Figure 5.7: Increasing the number of hops (simulation)
diate hops from 1 to 10, while keeping the total path latency constant. First, we use two hops of 25 milliseconds each, then three hops of 16.66 milliseconds each, and so forth. Figure 5.7 shows the percentage of packets delayed more than 60 milliseconds (10 milliseconds more than the path latency) for a 500 Kbps data stream with 1% and 2% packet loss as the number of hops increases. It is interesting to note that two to four hops appear to be sufficient to capture almost all of the benefit associated with hop-by-hop reliability. This is encouraging as small overlay networks are relatively easy to deploy. The important factor in obtaining better performance with hop-by-hop reliability is the latency of the lossy link rather than the number of hops in the end-to-end connection. The reason for the phenomenon depicted in Figure 5.7 is that increasing the number of hops from one to two reduces the latency of the lossy link by approximately 50 percent (25 milliseconds in our case), while increasing the number of hops from nine to ten reduces the latency of the lossy link only by approximately 1 percent (0.55 milliseconds). It is important how well we can isolate a potentially lossy or congested Internet link in an overlay link that is as short as possible. This can be achieved in practice by placing a few overlay nodes such that we create close to equal latency overlay links, as we do not usually know in advance which Internet connections will be congested. We believe that the simulation results are promising. The reminder of this chapter 67
10000
TCP 10ms Spines 10ms Analytic 10ms TCP 50ms Spines 50ms Analytic 50ms
10ms 10Mbps
C
10ms 10Mbps
D
10ms 10Mbps
E
10ms 10Mbps
F
ms s 0.1 Mbp 100
ms ps 0.1 Mb 0 10
s s 1m bp 0. 0M 10
10 0.1 0M ms bp s
B
10 0.1m 0M s bp s
10ms 10Mbps
0 100 .1ms Mb ps
A
Average Throughput (Kbps)
9000
LAN
8000 7000 6000 5000 4000 3000 2000 1000
Figure 5.8: Emulab Network Setup
0
0
0.2
Figure 5.9: (Emulab)
0.4
0.6
0.8 1 1.2 Loss rate (%)
1.4
1.6
1.8
2
Spines congestion control
will investigate whether the same behavior is not limited to our simulation environment but is in fact achieved in practice.
5.3
Experimental results In this section we evaluate the hop-by-hop reliability behavior using the Spines over-
lay network deployed on the Emulab testbed [54]. We instantiated on Emulab the network setup presented in Figure 5.8 that follows the topology used in our Section 5.2 simulations. All the Emulab machines are also directly connected through a local area network through which they are managed and can be accessed from the Internet. On this local area network we constantly monitored the clock synchronization between the computers involved in our experiments and accurately adjusted our one-way latency measurements. The routing was set up such that all the experiment traffic went on the 10 millisecond links, while on the local area network we measured the clock difference continuously (every 100 milliseconds) between the computers making the end nodes of a connection. The oneway delay of the data packets was calculated as the difference between the timestamp at the sender and the current time at the receiver, adjusted with the clock difference between the end nodes.
68
On the overlay network, the round-trip delay between nodes A and F measured with ping under no traffic was 99.96 milliseconds, and the throughput achieved by a TCP connection on each of the 10 millisecond links was about 9.59 Mbps. On the local area network the round-trip delay between any two nodes was about 0.135 milliseconds, which gave us a very good accuracy in measuring the clock difference and one-way delay of the packets. For each experiment in this section we sent 200000 messages of 1000 bytes each. We first verified that the congestion control implemented in the Spines overlay link protocol is TCP-fair. Figure 5.9 shows the throughput obtained by an end-to-end TCP stream and by the Spines link protocol for a 10 and a 50 millisecond delay link of 10 Mbps capacity under different levels of losses, and compares it to the analytical TCP model from [58]. The throughput achieved by Spines is very close to that of a TCP connection under similar conditions. Note that for a 10 millisecond link, as the throughput of both TCP and Spines approaches the maximum capacity of 10Mbps, they start developing their own additional losses in order to probe the available bandwidth. This is why they appear to achieve less than the analytical model that takes into account only the original losses we enforced on the link. We compared the packet delay of a data stream using an end-to-end TCP connection between nodes A and F, with that of a hop-by-hop connection using Spines on the overlay nodes, while varying the sending rate (at node A) and the loss rate on the intermediate link C-D. Note that the end-to-end TCP connection does not go through the Spines applicationlevel routers, but only through the overlay nodes A, B, ... F - so it is not affected in any way by the Spines overhead in user-level processing and added headers. Figure 5.10 and Figure 5.11 show that the low latency effect of hop-by-hop reliability is very significant also in the experimental setting, overcoming by far the overhead of userlevel processing at the level of the intermediate overlay network nodes. The latency of a real TCP connection is lower than the simulation result (presented in Figure 5.3 and Figure 5.4), especially at high loss rates, which shows us that the TCP model we used in
69
250
600
End-to-End Hop-by-Hop
500 Average delay (ms)
Average delay (ms)
200
150
100
50
0
0
0.2
0.4
0.6
0.8 1 1.2 Loss rate (%)
300
1.4
1.6
1.8
300 200
0
2
0
0.2
0.4
0.6
0.8 1 1.2 Loss rate (%)
1.4
1.6
1.8
2
Figure 5.11: Average delay for a 1000 Kbps stream (Emulab) 40
End-to-End Hop-by-Hop
End-to-End Hop-by-Hop
35 Percentage of packets (%)
250 200 Jitter (ms)
400
100
Figure 5.10: Average delay for a 500 Kbps stream (Emulab)
150 100 50 0
End-to-End Hop-by-Hop
30 25 20 15 10 5
0
0.2
0.4
0.6
0.8 1 1.2 Loss rate (%)
1.4
1.6
1.8
0
2
Figure 5.12: Average jitter for a 500 Kbps stream (Emulab)
60
80
100
120
140 160 180 200 Delay more than (ms)
220
240
260
280
Figure 5.13: Packet delay distribution for a 500 Kbps stream (Emulab)
the simulation (TCP-Fack), even though the closest, does not resemble exactly the Linux kernel implementation. The latency achieved by Spines hop-by-hop reliability is slightly higher than the latency obtained in the simulator, mainly due to simplifying assumptions of the simulation. However, the hop-by-hop latency remains very low, and increases much slower compared to the latency of the end-to-end TCP connection. Jitter follows a similar pattern, as seen in Figure 5.12 (and compared with Figure 5.5). Packets sent through the Spines overlay network arrive at the destination with a jitter up to three to four times smaller than the jitter of an end-to-end connection. In Figure 5.13, although the delay distribution for the end-to-end TCP connection is almost identical to 70
the result of the simulation (Figure 5.6), the overhead of the application-level routing is clearly visible in the hop-by-hop delay distribution. However, even with this overhead, the number of packets delayed by Spines is significantly (more than three times) lower than the number of packets delayed by the end-to-end connection.
71
Chapter 6
Improving Quality of VoIP Using Overlay Networks This chapter describes an overlay architecture that can easily be deployed to address network loss and failures in voice communication over the Internet. This approach maintains a high packet delivery ratio even under high loss, and adds minimal overhead under low, or no loss conditions. This chapter is based on joint work with Stuart Goose, David Hedqvist and Andreas Terzis. Although subscribers are accustomed to the consistent voice quality and high reliability provided by traditional Public Switched Telephone Network (PSTN), the promise of a single converged IP network to carry voice and data – and the cost savings therein – motivates the interest and adoption of voice-over-IP (VoIP) technologies. As the Internet evolves into a ubiquitous communication substrate offering a plethora of services including telephony, it will be expected to meet and exceed the standard of quality long offered by PSTN. It is non-trivial to engineer a solution that meets the stringent constraints expected by humans, of a high quality, reliable, real-time voice communication service. Delays of 100-150 msec and above are detectable by humans and can impair the interactivity of
72
conversations. By comparison, humans are far less tolerant of audio degradation than of video degradation. Hence, to meet these requirements it is crucial to minimize primarily the network latency and secondarily packet loss as much as possible. To minimize latency, contemporary VoIP solutions rely upon UDP as the transport protocol. However this has the potential to expose VoIP packets to network loss and failures. Although the Internet can offer reasonable quality (relatively low loss and good stability) for the majority of VoIP streams, it has been shown [61] [62] [63] that it remains vulnerable to occasional bursts of high loss and link failures that preclude it from delivering a constant, high quality service demanded for telephony. Our first observation is that it is often possible to recover packets even given the tight delay budget of VoIP. While many VoIP streams exhibit large latencies that prohibit timely end-to-end recovery, it is possible to perform recovery for many short links that are in the order of up to 30 msec. Our second observation is that by breaking long links into several smaller links, an overlay network architecture can help localize the packet recovery within overlay hops. Thus, even for VoIP streams with end-to-end latencies considerably larger than 30 msec, the vast majority of the packet losses can be rapidly recovered on the shorter overlay hop on which they were dropped. Overlay networks facilitate the deployment of flexible routing protocols that can address the needs of a specific application. Our third observation is that the overlay approach allows the deployment of a routing algorithm that optimizes the probability of packets being delivered within the delay requirements of VoIP, hence having a significant impact on the resulting voice quality. Our overlay network approach is tailored to support VoIP by judiciously combining two complementary mechanisms: First, a real-time 1 packet recovery protocol that immediately delivers newly received packets, similarly to UDP, but this protocol attempts to recover missing packets. Recovery is attempted only once, and only if a packet is likely to arrive at the destination within the VoIP delay constraint. This protocol is deployed 1
Our definition of real-time refers to timely recovery of packets on short overlay links. Protocols such as RTP and RTCP, that do not attempt to recover packets, work independently of our protocols and benefit of our higher packet delivery ratio.
73
on every overlay link. Second, an adaptive overlay routing protocol tailored to VoIP, that optimizes path selection based on an approximation metric that combines the measured latency and loss of a link. The approximation metric dynamically assigns a cost to each overlay link by estimating the packet latency distribution and loss rate of the real-time recovery protocol. We implemented these protocols as part of the Spines overlay network platform, and evaluated their behavior under controlled network conditions on the Emulab testbed and directly in the Internet on the Planetlab [64] network. The performance of the proposed routing metric was evaluated through extensive simulations, comparing it to other metrics, on thousands of random topologies with various loss and delay link characteristics. We show that by leveraging our overlays for disseminating VoIP streams, the loss rate of the communication can be drastically reduced. For example, for a network loss rate of 5%, our system can usually recover within the latency constraints all but 0.5% of the packets. This leads to a commensurate increase in the voice quality of the calls. Our results reveal that using a standard voice codec, we could achieve PSTN voice quality despite loss rates of up to 7%. Our routing metric achieves good performance, selecting paths that optimize packet delivery ratio. It achieves better performance than individual latency, loss or hopbased routing schemes – especially in high latency networks where the voice delay constraint becomes more stringent. The rest of this chapter is organized as follows: In Section 6.1 we present the motivation and background of our work. We present and evaluate our protocols in Section 6.2. The routing limitations of overlay networks and how they can be addressed in real systems are described in Section 6.3, and Section 6.4 discusses how we can integrate our approach with SIP in the current VoIP infrastructure.
74
6.1
Background There are several steps involved in sending voice communication over the Internet.
First, the analog audio signal is encoded at a sampling frequency compatible with the human voice. The resulting data is partitioned into frames representing signal evolution over a specified time period. Each frame is then encapsulated into a packet and sent using a transport protocol (usually UDP) towards the destination. The receiver of a VoIP communication decodes the received frames and converts them back into analog audio signal. The quality of Voice over IP depends on the network performance of delivering frame packets to the destination.
6.1.1
Voice over IP As opposed to media streaming, VoIP communication is interactive, i.e. participants
are both speakers and listeners at the same time. In this respect, delays higher than 100150 msec can greatly impair the interactivity of conversations, and therefore delayed packets are usually dropped by the receiver codec. Voice quality can be adversely affected by a number of factors including latency, jitter, node or link failures, and by the variability of these parameters. Their combined impact, as perceived by the end-users, is that voice quality is reduced at random. Contemporary VoIP codecs use a buffer at the receiver side to compensate for shortly delayed packets, and use forward error correction (FEC) or packet loss concealment (PLC) mechanisms to ameliorate the effect of packet loss or excessive delay. The error correction mechanisms usually add redundancy overhead to the network traffic and have limited ability to recover from bursty or sudden loss increase in the network. Currently, almost any network-based telephony device that converts voice audio to network packets uses a standard codec, the ITU-T G.711 [65] recommendation. This codec, combined with its PLC [66] mechanism offers high quality voice communication. The G.711 codec we used in our experiments in this chapter samples the audio signal at a rate of 8kHz 75
4.5
4.5
Uniform 25% burst 50% burst 75% burst UDP PESQ - 5 percentile
UDP PESQ - Average
4
3.5
3
2.5
4
3.5
3
2.5 0
1
2
3
4
5 6 loss rate (%)
7
8
9
10
Uniform 25% burst 50% burst 75% burst
0
1
2
3
4
5 6 loss rate (%)
7
8
9
10
Figure 6.2: Network loss - 5 percentile PESQ (worst affected)
Figure 6.1: Network loss - Average PESQ
and partitions the data stream into 20 msec frames, thus sending 160 byte packets at a rate of 50 packets/sec. The VoIP quality is evaluated using an objective method described in ITU-T recommendation P.862 [67], known as Perceptual Evaluation of Speech Quality (PESQ). The PESQ score is estimated by processing both the input reference and the degraded output speech signal, similarly to the human auditory system. The PESQ score ranks speech signals on a scale from -0.5 (worst) to 4.5 (best), where 4.0 is the quality achieved in regular PSTN.
6.1.2
Internet loss and failure characteristics Data packets are lost in the Internet due to congestion, routing anomalies and physi-
cal errors, although the percentage of physical errors is very small at the core of the network. Paxson [62] studied the loss rate for a number of Internet paths and found that it ranged from 0.6% to 5.2%. Furthermore, in that study and a follow-up [68], Paxson discovered that loss processes can be modeled as spikes where loss occurs according to a two-state process, where the states are either “packets not lost” or “packets lost”. According to the same studies, most loss spikes are very short-lived (95% are 220 msec or shorter), but outage duration spans several orders of magnitude and in some cases the duration can be modeled 76
by a Pareto distribution. In a recent study, Andersen et al [63] confirmed Paxson’s earlier results but showed that the average loss rate for their measurements in 2003 was a low 0.42%. Most of the time, the 20-minute average loss rates were close to zero; over 95% of the samples had a 0% loss rate. On the other hand, during the worst one-hour period monitored, the average loss rate was over 13%. An important finding in [63] is that the conditional probability that a second packet is lost given that the first packet was lost was 72% for packets sent back-to-back and 66% for packets sent with a 10-msec delay, confirming the results in [68]. In addition to link errors and equipment failures, the other major factor contributing to packet losses in Internet is delayed convergence of the existing routing protocols. Labovitz et al [69] use a combination of measurements and analysis to show that inter-domain routes in the Internet may take tens of minutes to reach a consistent view of the network topology after a fault. They found that during this period of delayed convergence, end-to-end communication is adversely affected. In [70], Labovitz et al. find that 10% of all considered routes were available less than 95% of the time and that less than 35% of all routes were available more than 99.99% of the time. In a followup study [71], Chandra et al showed that 5% of all failures last more than 2 hours and that failure durations are heavy-tailed and can last as long as 20 hours before being repaired. In a related study performed in 2003, Andersen et al [63] showed that while some paths are responsible for a large number of failures, the majority of the observed Internet paths had some level of instability. All these statistics indicate the Internet today is not ready to support high quality voice service as we are going to show in the following section.
6.1.3
Voice quality degradation with loss We evaluated the effect of a loss pattern such as the one reported on the Internet on
the VoIP quality, using the the standardized PESQ measure. To do so, we instantiated a network with various levels of loss and burstiness (we define burstiness as the conditional
77
probability of loosing a packet when the previous packet was lost) in the Emulab 2 testbed, and measured the quality degradation when sending a VoIP stream on that network. We used the G.711 codec with PLC to transfer a 5 minute audio file using UDP over the lossy network, repeating each experiment for 20 times. The network had a 50 msec delay and 10 Mbps capacity, enough to emulate a trans-continental long-distance call over a wide area network. We finally decoded the audio file at the destination, divided it into 12 second intervals corresponding to normal conversation sentences, and compared each sentence interval with the original to generate its PESQ score. Figure 6.1 shows the average PESQ score of all the sentence intervals as a function of loss rate and burstiness of the link. We can see that on average, the G.711 codec can handle up to 1% loss rate, while keeping a PESQ score higher than 4.0 (the expected PSTN quality level). Burstiness does not play a major role until the loss rate is relatively high, when the voice quality is anyway low. However, given the expectancy of high quality for phone calls, we also need to analyze the most affected voice streams. Figure 6.2 presents the 5 percentile of the above measurements. We can see that for the most affected streams burstiness does have a significant impact, and even at 0.5% loss rate the G.711 codec cannot provide PSTN standard voice quality. At 0.5% loss and 75% burstiness the PESQ score dropped to 3.69. Considering the fact that current loss rate measurements in the Internet average at about 0.42% with an average burstiness of 72%, and that occasionally loss can be even much higher, these experiments show that new solutions are required to improve the quality of VoIP traffic if it is to compete with the existing PSTN. 2
Emulab cannot set conditional loss probability on the links. For burstiness experiments we dropped packets with conditional probability at the application level, before processing them.
78
4.5 4
3.5
3 2.5 2 1.5
2.5 2 1.5 1
0.5
0.5 0 0
1
2
3
4 5 6 Link loss (%)
7
8
9
10
90
2
3
4 5 6 Each link loss (%)
7
8
9
10
70
60 50 40 30
60 50 40 30
20
20
10
10 80
82
84
86
88 90 92 Packets (%)
94
96
Uniform
80
Delay (milliseconds)
70
98
100
Figure 6.5: Delay distribution - 1 link, 5% loss
6.2
1
90 Uniform 25% burst 50% burst 75% burst
80
0
0
Figure 6.4: Real-time loss recovery - 2 concatenated links
Figure 6.3: Real-time recovery loss - 1 link
Delay (milliseconds)
3
1
0
Uniform 25% burst 50% burst 75% burst
4
RT protocol loss (%)
3.5 RT protocol loss (%)
4.5
Uniform 25% burst 50% burst 75% burst
0
80
82
84
86
88 90 92 Packets (%)
94
96
98
100
Figure 6.6: Delay distribution - 2 concatenated links, 5% loss each
Protocols for increasing VoIP performance Contemporary VoIP systems use the UDP best effort delivery service to transfer data,
exposing the audio channels to packet losses and path failures. One of the main reasons for not using packet retransmissions is that lost packets, even when recovered end-to-end from the source, are not likely to arrive in time for the receiver to play them. Overlay networks break end-to-end streams into several hops, and even though an overlay path may be longer than the direct Internet path between the two end-nodes, each individual overlay hop usually has smaller latency, thus allowing localized recovery on lossy overlay links.
79
6.2.1
Real-time recovery protocol Our overlay links run a real-time protocol that recovers packets only if there is a
chance to deliver them in time, and forward packets even out of order to the next hop. We describe our real time recovery protocol as follows: • Each node in the overlay keeps a circular packet buffer per outgoing link, maintaining packets sent within a time equal to the maximum delay supported by the audio codec. Old packets are dropped out of the buffer if they have expired, or when the circular buffer is full. • Intermediate nodes forward packets as they are received, even out of order. • Upon detecting a loss on one of its overlay links, a node asks the upstream node for the missed packet. A retransmission request for a packet is only sent once. We only use negative acknowledgments, thus limiting the amount of traffic when no packets are lost. • When an overlay node receives a retransmission request it checks in its circular buffer, and if it has the packet it resends it, otherwise it does nothing. A token bucket mechanism regulates the maximum ratio between the number of retransmissions and the number of data packets sent. This way we limit the number of retransmissions on lossy links. In all experiments presented in this chapter the maximum retransmission rate was set to 20%. • If a node receives the same packet twice (say because it was requested as a loss, but then both the original and the retransmission arrive), only the first instance of the packet will be forwarded towards the destination. The protocol does not involve timeouts and never blocks for recovery of a packet. The downside is that this is not a fully reliable protocol and some of the packets will be lost in case where the first retransmission attempt fails. Such events can appear when a packet 80
is lost, the next packet arrives and triggers a retransmission request, but the retransmission request is also lost. For a symmetric link with independent loss rate p in both directions, this happens with probability: p · (1 − p) · p = p 2 − p3 . Another significant case is when the retransmission request does arrive, but the retransmission itself is lost, which can happen with probability: p · (1 − p) · (1 − p) · p = p 2 − 2p3 + p4 . Other types of events, that involve multiple data packets lost can happen, but their probability of occurrence is negligible. We approximate the loss rate of our real-time protocol by 2p 2 − 3p3 , assuming a uniform3 loss probability on the link. The delay distribution of packets follows a step curve, such that for a link with delay T and loss rate p, (1−p) fraction of packets arrive in time T , (p−2p 2 +3p3 ) are retransmitted and arrive in time 3T + ∆, where ∆ is the time it takes the receiver to detect a loss, and (2p2 − 3p3 ) of the packets will be lost by the real time recovery protocol. For a path that includes multiple links, the delay of the packets will have a composed distribution given by the combination of delay distributions of each link of the path. The time ∆ it takes the receiver to trigger a retransmission request depends on the inter-arrival time of the packets (the receiver needs to receive a packet to know that it lost the previous one) and on the number of out of order packets that the protocol can tolerate. For a single VoIP stream, packets usually carry 20 msec of audio, so they arrive at relatively large intervals. In our overlay approach, we aggregate multiple voice streams sent by different applications within a single real-time recovery protocol on each link. The overlay link protocol handles packets much more often than a single VoIP stream, and therefore the inter-arrival time of the packets is much smaller. Standard TCP protocol needs three packets out of order before triggering a loss. Since latency is crucial for VoIP applications, and as packet reordering happens relatively rarely [72], in our experiments we trigger a retransmission request after receiving the first out of order packet. 3
In many cases, the loss rate probability may not be uniform. Later in this chapter, we investigate the impact of burstiness on our protocols.
81
We implemented the real time protocol in the Spines overlay network platform and evaluated its behavior by running Spines on Emulab. Figure 6.3 shows the loss rate of the real time recovery protocol on a symmetric 10 msec link with various levels of loss and burstiness, and Figure 6.4 shows the combined loss for two concatenated 10 msec links that experience the same amount of loss and burstiness, in both directions, running Spines with the real-time protocol on each link. For each experiment, an application sent traffic representing the aggregate of 10 VoIP streams for a total of two million packets of 160 bytes each, and then average loss rate was computed. We can see that the level of burstiness on the link does not affect the loss rate of the real-time protocol. The real-time loss rate follows a quadratic curve that matches our 2p 2 − 3p3 estimate. For example, for a single link with 5% loss rate, applying the real-time protocol reduces the loss rate by a factor of 10, to about 0.5% regardless of burstiness, which yields an acceptable PESQ score (see Figure 6.1). For the single 10 msec link experiment with 5% loss rate, the packet delay distribution is presented in Figure 6.5. As expected, 95% of the packets arrive at the destination in about 10 milliseconds. Most of the losses are recovered, showing a total latency of 30 msec plus an additional delay due to the inter-arrival time of the packets required for the receiver to detect the loss, and about 0.5% of the packets are not recovered. In the case of uniform loss probability the delay of the recovered packets is almost constant. However, when the link experiences loss bursts, multiple packets are likely to be lost in a row, and therefore it takes longer for the receiver to detect the loss. The increase of the interval ∆ results in a higher delay for the recovered packets. Obviously, the higher the burstiness, the higher the chance for consecutive losses, and we can see that the packet delay is mostly affected at 75% burstiness. Figure 6.6 shows the delay distribution for the two-link network, where both links experience 5% uniform distribution loss rate. As in the single link experiment, most of the losses are recovered, with the exception of 1% of the packets. We notice, however, a small fraction of packets (slightly less than 0.25%) that are lost and recovered on both 82
…
…
A
10 Mbps 10 ms
B
10 Mbps 10 ms
10 Mbps 10 ms
C
D
10 Mbps 10 ms
10 Mbps 10 ms
E
F
4.5
4.5
4
4
RT PESQ - 5 percentile
PESQ - Average
Figure 6.7: Spines network - 5 links
3.5
Spines Uniform Spines 25% burst Spines 50% burst Spines 75% burst UDP Uniform UDP 75% burst
3
2.5
0
1
2
3
4
5 6 loss rate (%)
7
8
9
3.5
3
2.5
10
Figure 6.8: Real-Time protocol - Average PESQ
Spines Uniform Spines 25% burst Spines 50% burst Spines 75% burst UDP Uniform UDP 75% burst
0
1
2
3
4
5 6 loss rate (%)
7
8
9
10
Figure 6.9: Real-Time protocol - 5 percentile PESQ
links, and that arrive with a latency of about 66 msec. This was expected to happen with the compound probability of loss on each link, p c = 0.05 · 0.05. Burstiness results for the two-link network, not plotted in the figure, follow the same pattern as shown in Figure 6.5. In order to evaluate the effect of local recovery on voice quality we ran the same experiment depicted in Figure 6.1 and Figure 6.2 on top of a Spines overlay network. We divided the 50 msec network into 5 concatenated 10 msec links as shown in Figure 6.7, ran Spines with the real-time protocol on each link, and sent 10 VoIP streams in parallel from node A to node F . We generated losses with different levels of burstiness on the middle link C − D and set the threshold network latency for the G.711 codec to be 100 msec. Figure 6.8 presents the average PESQ score of the G.711 streams using Spines, and compares it with the results obtained when sending over UDP directly. Since most of the packets are received in time to be decoded at the receiver, we can see that when using Spines, regardless of burstiness, the G.711 codec can sustain on average even network losses 83
10 ms, 2% loss B A
D
?
E
C 20 ms, 1% loss Figure 6.10: Two-metric routing decision of 7% with PSTN voice quality. As discussed earlier, phone service subscribers expect high quality service. Therefore, in addition to average performance characteristics, it is important to look at the performance of the worst cases. Figure 6.9 shows the quality of the worst 5 percentile calls. We can see that the codec can handle up to 3.5% losses with PSTN quality and even for the worst 5% calls, the burstiness did not play a major role in the voice quality.
6.2.2
Real time routing for audio The real time protocol recovers most of the missed packets in case of occasional, or
even sustained periods of high loss, but if the problem persists, we would like to adjust the overlay routing to avoid problematic network paths. Given the packet delay distribution and the loss rate of the soft real-time protocol on each overlay link, the problem is how to find the overlay path between a pair of source and destination, for which the packet delay distribution maximizes the number of packets that arrive within a certain delay, so that the audio codec can play them. The problem is not trivial, and requires a two metric routing optimizer. For example, in Figure 6.10, assuming a maximum delay threshold for the audio codec to be 100 msec, if we try to find the best path from node A to node E, even in the simple case where we do not recover packets, we cannot determine which partial path from node A to node D is better (maximizes the
84
100
99.5
99.5
99
99
Avg. delivery ratio (%)
Avg. delivery ratio (%)
100
98.5 98 97.5 expected latency hop distance latency loss rate greedy optimizer best route
97 96.5 96
0
10
20
98.5 98 97.5 expected latency hop distance latency loss rate greedy optimizer
97 96.5
30 40 Network diameter (ms)
50
60
96
70
Figure 6.11: Comparing routing metrics - 15 node networks
0
10
20
30 40 Network diameter (ms)
50
60
70
Figure 6.12: Comparing routing metrics 100 node networks
number of packets arriving at E within 100 msec) without knowing the latency of the link D-E. On the other hand, computing all the possible paths with their delay distribution and choosing the best one is prohibitively expensive. However, if we can approximate the cost of each link by a metric dependent on the link’s latency and loss rate, taking into account the characteristics of our real-time protocol and the requirements of VoIP, we can use this metric in a regular shortest path algorithm with reasonable performance results. Our approach is to consider that packets lost on a link actually arrive, but with a delay T max bigger than the threshold of the audio codec, so that they will be discarded at the receiver. Then, the packet delay distribution of a link will be a three step curve defined by the percentage of packets that are not lost (arriving in time T ), the percentage of packets that are lost and recovered (arriving in 3T + ∆), and the percentage of packets missed by the real-time protocol (considered to arrive after T max ). The area below the distribution curve represents the expected delay of the packets on that link, given by the formula: Texp = (1 − p) · T + (p − 2p2 + 3p3 ) · (3T + ∆) + (2p2 − 3p3 ) · Tmax . Since latency is additive, for a path consisting of several links, our approximation for the total expected delay will then be the sum of the expected delay of each individual link. We call this metric expected latency cost function. We evaluated the performance of the expected latency based routing and compared 85
it with other cost metrics. We used the BRITE [73] topology generator to create random topologies using the Waxman model, where the probability to create a link depends on the distance between the nodes. We chose this model because it generates mostly short links that that fit our goal for localized recovery. We assigned random loss from 0% to 5% on half of the links of each topology, selected randomly. We considered every node generated by BRITE to be an overlay node, and every link to be an overlay edge. For each topology we determined the nodes defining the diameter of the network (the two nodes for which the shortest latency path is longest), and determined the routing path between them given by different cost metrics. By adjusting the size of the plane in which BRITE generates topologies, networks with different diameters are created. For each network diameter we generated 1000 different topologies and evaluated the packet delivery ratio between the network diameter nodes when running the real-time protocol on the links of the network, using different routing metrics. Figure 6.11 shows the average delivery ratio for network topologies with 15 nodes and 30 links, and Figure 6.12 shows the delivery ratio for network topologies with 100 nodes and 200 links. For a link with direct latency T and loss rate p, considering an audio codec threshold Tmax = 100 msec and the packet inter-arrival time ∆ = 2 msec, the cost metrics used are computed as follows: • Expected latency: Cost = (1 − p) · T + (p − 2p 2 + 3p3 ) · (3T + ∆) + (2p2 − 3p3 ) · Tmax • Hop distance: Cost = 1 (mnimizes the number of hops on a path) • Link latency: Cost = T (minimizes the total path latency) • Loss rate: Cost = −log(1 − p) (minimizes the compound loss rate of the path) • Greedy optimizer: We used a modified Dijkstra algorithm that, at each iteration, computes the delay distribution of the selected partial paths and chooses the one with the maximum delivery ratio.
86
• Best route: All the possible paths and their delay distributions were computed, and out of these the best one was selected. Obviously, this operation is very expensive, mainly because of the memory limitation of storing all combinations of delay distributions . Using a computer with 2GB memory, we could not compute the best route for networks with more than 16 nodes. As expected, for small diameter networks the loss-based routing achieves very good results, as the delay of the links is less relevant. With the increase in the network diameter, the latency-based routing achieves better results. At high latencies, the packet recovery becomes less important than the risk of choosing a highly delayed path, with latency more than the codec threshold. The expected latency routing achieves lower delivery ratio than the loss-based routing for small diameter networks, but behaves consistently better than the latency-based routing. The slight drop in delivery ratio for low diameter networks is causing just a small change in VoIP quality (see Figures 6.1 and 6.2), while the robustness at high network delays is very important. Interestingly, the greedy optimizer fails at high latency networks, mainly due to wrong routing decisions taken early in the incremental algorithm, without considering the full topology. Our conclusion is that the expected latency metric, while being slightly worse than other routing metrics for small diameter networks achieves better routing in high latency networks, exactly where it is needed the most.
6.3
Routing limitations of overlay networks Running overlay nodes in the user level space gives us great flexibility and usability,
but this comes at the expense of packet processing through the entire networking stack, and process scheduling on the machines running the overlay nodes. Executing overlay network functionality on loaded computers naturally degrades the performance of the overlay system. This degradation is critical especially for latency
87
…
… 100 Mbps LAN
A
B
100 Mbps LAN
C
Figure 6.13: Spines network - 2 links 0.4
Spines UDP
Average packet latency (ms)
0.35 0.3 0.25 0.2 0.15 0.1 0.05 0
20
40
60
80 100 120 VoIP streams
140
160
180
200
Figure 6.14: Spines forwarding delay sensitive VoIP streams. For example, if the overlay daemon runs as a user level process on a computer that has other CPU intensive processes, it is common for the overlay network system not to be scheduled for several hundred milliseconds, and even seconds, which of course, is not useful for VoIP. In fact, our experience with another messaging system, the Spread toolkit [74] that is commonly deployed on large websites, shows that on heavily loaded web servers a process may be scheduled only after eight seconds. It is common practice on such systems to assign the messaging system higher priority (real time priority in Linux). For a VoIP service it is reasonable to expect that the overlay nodes will be well provisioned in terms of CPU and networking capabilities.
6.3.1
Routing performance in Spines It is interesting to evaluate the overhead of running the overlay nodes as regular
applications in the user space, and how the routing performance is affected by the amount
88
of traffic or load on the computers. We deployed Spines in Emulab on a three node network as shown in Figure 6.13, where the middle node B had two network interfaces and was directly connected to nodes A and C through local area links. All the computers used were Intel Pentium III 850MHz machines. The one-way UDP latency between node A and node C measured sending 160 byte packets and adjusted with the clock difference between the nodes was 0.189 msec. We ran a Spines node on each node, using the real-time protocol on the links A − B and B − C. Then we sent a varying number of voice streams in parallel (from 1 to 200 streams), consisting of 20000 packets of 160 bytes each, from node A to node C using Spines. We measured the one way latency of each packet, adjusted by the clock difference between machines A and C. When forwarding 200 streams, the middle node B running Spines showed an average CPU load of about 40%. However, the sending node A, on which both Spines and our sending application were running, reached a maximum 100% CPU utilization. Figure 6.14 shows the average latency of packets forwarded through Spines as the number of parallel streams increases from 1 to 200, and compares it to the base network latency measured with UDP probes. The standard deviation of all the measurements was a very low 0.012, and the highest single packet latency measured, which happened when we sent 200 streams in parallel, was 0.963 msec. What we see is that regardless of the number of streams, the three Spines nodes add a very small delay totaling about 0.15 msec due to user-level processing and overlay routing. We evaluated the routing performance of Spines on a CPU loaded computer by running a simple while(1) infinite loop program on the middle node B, and repeated the above experiment. Running Spines with the same priority as the loop program, when forwarding a single voice stream we achieved a very high packet delay average of 74.815 msec, and the maximum packet delay was 154.468 msec. When competing with 4 loop programs in parallel, with the same priority as Spines, the average packet delay for a single stream
89
went up even more to 298.354 msec (about 900 times more than without CPU competing applications), and the maximum packet delay was 604.917 msec. Obviously, such delays are not suitable for VoIP. However, when we set real-time priority for the Spines process, the high CPU load did not influence our performance. Even when competing with 10 loop programs and a load of 200 streams, the average packet delay was a low 0.315 msec and the maximum packet delay measured was 0.469 msec. The performance of overlay routing at the application level can be highly affected by the load on the supporting computers. However, this overhead can be easily reduced to negligible amounts compared to wide area latencies simply by increasing the priority of the overlay node applications. This should not be a problem in general, as the overlay node applications do not use CPU unless they send packets, and if they do need to send packets in a system dependent on real-time packet arrival, the overlay nodes should not be delayed. Table 6.1: Planetlab sites 1 2 3 4 5 6 7 8
6.3.2
CMU Columbia University Dartmouth College Duke University Intel Research Berkeley Intel Research Seattle MIT Princeton University
9 10 11 12 13 14 15
Univeristy University University University University University University
of of of of of of of
California, San Diego Georgia Maryland Oregon Virginia Washington Utah
Case study: Planetlab Planetlab [64] is a large overlay testbed that can be seen as a collection of comput-
ers distributed around the world, each of them directly accessing the Internet. Currently Planetlab has 403 nodes at 169 sites. As opposed to Emulab, which has a reservation mechanism that completely allocates computers to a particular experiment, Planetlab uses a shared environment. Users create slices on each computer they need to run their programs on, and each slice acts like a virtual machine, sharing the computer resources with other 90
100
100
95
85 80 75 70 65
85 80 75 70 65
60
60
55
55
50
0.25
0.5
0.75
1 1.25 loss rate (%)
1.5
1.75
Spines UDP
90 CDF: Streams (%)
CDF: Streams (%)
95
Spines UDP
90
50
2
Figure 6.15: Planetlab - lost packets
0.25
0.5
0.75
1 1.25 loss rate (%)
1.5
1.75
2
Figure 6.16: Planetlab - missed packets
users, running within their own slices. In the current deployment of Planetlab it is not possible to set process priorities higher than other processes in other slices, and the CPU load and availability on the machines is dependent on the particular applications that various researchers run at the same time. Out of the sites in the US we found 15 to have computers synchronized to under 30 msec. The 15 sites are presented in Table 6.1. Note that our overlay protocols do not require clock synchronization, but we do need synchronized clocks in our experiments to evaluate the number of packets arriving within a certain delay constraint. The average load measured on the machines at these sites varied from 0.56 to 5.95, with an average of 2.91 (i.e. at any point in time there are on average 2.91 processes ready and competing for CPU), with only 2 nodes having a load below 1. Such a high load is expected and normal for a shared testbed, and can be easily handled by Spines if we run it with real-time priority. However, as we cannot set higher process priorities against users running in different slices, we expect that any overlay path that uses at least an intermediate high CPU loaded node on Planetlab, would delay much more packets than it can recover using the real-time protocol, and therefore behave worse than the direct Internet connection between the end nodes. It is interesting though to see how the real time recovery protocol behaves, even at high CPU load, on the direct connections between the Planetlab nodes. We deployed
91
a Spines overlay network consisting of a fully connected graph, such that each of the 15 overlay nodes had a direct overlay link to each of the other 14 nodes. We then sent streams of 20000 packets, 160 bytes each at a rate of 50 packets/sec from each node to all the other nodes, directly using UDP and also using Spines. We combined nodes in alternating groups of 7 pairs, such that each node can only be a sender or a receiver at a time, but not both. We also alternated UDP and Spines streams, so that we minimized as much as possible the effect of loss or delay variations between the same nodes when running different streams. We considered only 94 streams for which the minimum packet delay was less than 30 msec (so that the real-time protocol had a chance to recover any packets) and set the delay threshold for the codec to be 115 msec (we add 15 milliseconds to compensate for the 0 to 30 msec clock difference between the nodes). For each UDP and Spines stream we counted the lost packets, the late packets (arriving at destination after more than 115 msec) and the packets missed by the codec as the sum of both lost and late packets. Figure 6.15 presents the CDF of the streams as a function of lost packets. First, we see that many of the UDP streams in Planetlab are affected by loss. About 22% of the UDP streams lost more than 0.25% of the packets, and about 4% of the UDP streams lost more than 1% of their packets. Spines was able to recover almost all the packets for most of the streams, such that there was only one stream that lost more than 0.25% of the packets. That stream lost 609 packets total, most of them in three bursts of 102, 359 and 87 packets respectively. We believe this happened either because of short outages between Planetlab nodes, but most likely because Spines was not scheduled to run for several seconds. Figure 6.16 presents the CDF of the streams as a function of missed packets. Even though Spines did recover almost all of the packets, some of the recoveries did not arrive in time at the destination, also due to process scheduling delays when sending retransmissions. Nevertheless, while almost 27% of the UDP streams missed more than 0.25% of the packets, only about 4% of the Spines streams had more than 0.25% of the packets missed.
92
6.4
Integration with SIP in the the current Voice over IP infrastructure Given the large installed base of VoIP end clients and the even larger planned fu-
ture deployments, it is imperative that our system integrates seamlessly with the existing infrastructure. We explain what are the necessary steps to achieve this in the rest of this section. The first component of the integration has to do with how VoIP clients are able to find their closest Spines server. We assume that each domain that wants to take advantage of the benefits provided by our system will deploy a Spines node as part of their infrastructure. In this case VoIP clients can use DNS SRV [75] records to locate the Spines node that is serving their administrative domain. This DNS query will return the IP address of (at least one) Spines node that can serve as their proxy in the Spines overlay. Once this node is found the VoIP clients can communicate with it using the interface we described in Section 2.2. Then, the VoIP clients have to direct media traffic to flow through the Spines network. We have two proposed solutions for this issue: one that requires changes to the endclients and one that does not. We begin with the solution that requires “Spines-enabled” clients. In the current architecture, the Session Initiation Protocol (SIP) [76] is used as a signaling protocol so that the two communication endpoints can negotiate the session parameters, including the IP address and ports that each client is waiting to receive media traffic on. A Spines-enabled VoIP client announces its capability using the parameter negotiation feature that is part of SIP, within the initial INVITE SIP message. The VoIP client includes in the same INVITE message the IP address and the Virtual Port that it’s Spines server is waiting to receive media traffic for the client. If the peering VoIP client is also Spines-enabled it will reply positively and include in its reply the address and Virtual Port at its own server. On the other hand, if the peer is not Spines-enabled it will return an error code indicating to the session initiator that it will have to revert to a “legacy” session. After the SIP negotiation has successfully finished, each source will send media 93
traffic through its local Spines server towards the Spines server indicated by the peer client. As the traffic is forwarded through the overlay network, the egress Spines node will finally deliver it to the destination VoIP client. RTP [77] and RTCP data is sent seamlessly through the Spines network, offering the end clients information about the network conditions along the overlay path they use. While this first solution is architecturally pure, it requires changes to the end clients which may not be initially possible. In this case, we propose to use a solution similar to the NAT-traversal in SIP [78]. Specifically, Spines nodes will be required to intercept SIP INVITE messages and change the IP address and ports to point to themselves rather than to the VoIP clients. This way all the media traffic will flow through the Spines network which will eventually deliver it to the end-hosts.
94
Chapter 7
Conclusions Overlay networks offer a very powerful concept that allows researchers and practitioners to deploy user-level topologies on which application specific protocols can be used. The additional flexibility of overlay networks can be used to provide new services, not available in the current infrastructure, and also to improve performance of demanding applications. In order to facilitate experimentation for the research presented in this thesis, and also to allow other researchers to deploy their own protocols, we developed an overlay network system, and made it publicly available with an open source license. This thesis introduced an overlay multicast architecture that is scalable with the number of groups and participants. Our approach provides a transparent interface to existing multicast applications, and overcomes the deployment and usability limitations of IP Multicast. We presented a global flow control approach for reliable multicast and unicast in overlay networks that is based on sound theoretical foundations. Our Cost-Benefit framework provides a simple and flexible way to optimize flow control to achieve several desirable properties such as near optimal network throughput and automatic adjustment to dynamic link capacities. The resulting algorithm provides fairness between equal cost internal flows and is fair with outside traffic, such as TCP.
95
We presented a hop-by-hop reliability approach that considerably reduces the latency and jitter of reliable connections in overlay networks. We quantified these effects in simulations and in a real network environment.Our results show that the overhead associated with overlay network processing does not play an important factor compared with the considerable gain of the approach. We also learned that having a small number of hops is sufficient to capture most of the performance benefit of hop-by-hop reliability. We analyzed that current loss and delay characteristics of the Internet and showed that the current networking infrastructure inhibits the deployment of PSTN quality Voice over IP. We proposed a deployable solution that can overcome the bursty loss pattern of the Internet. Our solution uses an overlay network to segment end-to-end paths into shorter overlay hops and attempts to recover lost packets using limited hop-by-hop retransmissions. We present an adaptive routing algorithm that avoids chronically lossy paths in favor of paths that will deliver the maximum number of voice packets within the predefined time budget.
96
Bibliography [1] Baruch Awerbuch, Yossi Azar, and S. Plotkin, “Throughput-competitive on-line routing,” in Proceedings of 34th IEEE Symposium on Foundations of Computer Science, 1993, vol. 30, pp. 32–40. [2] R. Hagens, N. Hall, and M. Rose, “Use of the internet as a subnetwork for experimentation with the osi network layer,” RFC 1070, February 1989. [3] S. Deering and D. Cheriton, “Multicast routing in datagram internetworks and extended lans,” ACM Transactions on Computer Systems, May 1990. [4] S. Deering, D. Estrin, D. Farinacci, V. Jacobson, C.-G. Liu, and L. Wei, “An Architecture for Wide-Area Multicast Routing,” in Proceedings of SIGCOMM’88, 1994. [5] C. Diot, B. Levine, B.N. Lyles, B. Kassan, and D. Balensiefen, “Deployment issues for the ip multicast service and architecture,” IEEE Networks Special Issue on Multicasting, 2000. [6] H.W. Holbrooke and D.R. Cheriton, “Ip multicast channels: Express support for large-scale single-source applications,” in In Proceedings of SIGCOMM 99, Aug. 1999. [7] H. Eriksson, “MBONE: the multicast backbone,” in Communications of the ACM, Aug. 1994. [8] E. Rosen, A. Viswanathan, and R. Callon, “Multiprotocol Label Switching Architecture,” RFC 3031, Jan 2001. 97
[9] J. Touch and S. Hotz, “The x-bone,” in Third Global Internet Mini-Conference at Globecom ’98, Nov. 1998. [10] D. Andersen, H. Balakrishnan, F. Kaashoek, and R. Morris, “Resilient overlay networks,” in Proc. of the 18th Symposium on Operating Systems Principles, Oct. 2001, pp. 131–145. [11] I. Stoica, D. Adkins, S. Zhuang, S. Shenker, and S. Surana, “Internet indirection infrastructure,” 2002. [12] R. Perlman, Interconnections: Bridges, Routers, Switches, and Internetworking Protocols, Addison- Wesley Professional Computing Series, second edition, 1999. [13] Dah Ming Chiu, Miriam Kadanski, Joe Provino, Joseph Wesley, Hans-Peter Bischof, and Haifeng Zhu, “A congestion control algorithm for tree-based reliable multicast protocols,” in Proceeding of IEEE Infocom, June 2002, pp. 1209–1217. [14] Sally Floyd, Van Jacobson, Ching-Gung Liu, Steven McCanne, and Lixia Zhang, “A reliable multicast framework for light-weight sessions and application level framing,” IEEE/ACM Transactions on Networking, vol. 5, no. 6, pp. 784–803, Dec. 1997. [15] Paul
Francis,
“Yoid:
Extending
the
internet
multicast
architecture,”
http://www.icir.org/yoid/docs/yoidArch.ps, April 2000. [16] Lakshminarayanan Subramanian, Ion Stoica, Hari Balakrishnan, and Randy Katz, “OverQoS: An Overlay Based Architecture for Enhancing Internet QoS,” in USENIX NSDI ’04, Mar. 2004. [17] Jean-Chrysostome Bolot, Sacha Fosse-Parisis, and Donald F. Towsley, “Adaptive FECbased error control for internet telephony,” in INFOCOM (3), 1999, pp. 1453–1460. [18] John Jannotti, David K. Gifford, Kirk L. Johnson, M. Frans Kaashoek, and James W.O’Toole Jr, “Overcast: Reliable multicasting with an overlay network,” in Proceedings of OSDI 2000, 2000, pp. 197–212. 98
[19] Y. Chawathe, S. McCanne, and E. Brewer, “An architecture for internet content distribution as an infrastructure service,” 2000. [20] B. Zhang, S. Jamin, and L. Zhang, “Host multicast: A framework for delivering multicast to end users,” in In Proceedings of IEEE Infocom 2002., June 2002. [21] Yang-Hua chu, Sanjay G. Rao, and Hui Zhang, “A case for end system multicast,” in In Proceedings of ACM SIGMETRICS Conference 2000, June 2000. [22] Sally Floyd and Van Jacobson, “Random early detection gateways for congestion avoidance,” IEEE/ACM Transactions on Networking, vol. 1, pp. 397–413, August 1993. [23] V. Jacobson, “Congestion avoidance and control,” ACM Computer Communication Review; Proceedings of the Sigcomm ’88 Symposium in Stanford, CA, August, 1988, vol. 18, 4, pp. 314–329, 1988. [24] K. K. Ramakrishnan and R. Jain, “A binary feedback scheme for congestion avoidance in computer networks with a connectionless network layer,” Proceedings of the 1988 SIGCOMM Symposium on Communications Architectures and Protocols; ACM; Stanford, CA, pp. 303–313, 1988. [25] Sally Floyd, “TCP and explicit congestion notification,” ACM Computer Communication Review, vol. 24, no. 5, October 1994. [26] K. K. Ramakrishnan and Sally Floyd, “A proposal to add explicit congestion notification (ECN) to IP,” RFC 2481, January 1999. [27] R. G. Gallager and S. J. Golestaani, “Flow control and routing algorithms for data networks,” in Proceedings of 5th International Conference on Computers and Communication, 1980, pp. 779–784. [28] R. J. Gibbens and Frank P. Kelly, “Resource pricing and the evolution of congestion control,” Automatica, vol. 35, December 1999. 99
[29] S. Jamaloddin Golestani and S. Bhatacharyya, “End-to-end congestion control for the Internet: A global optimization framework,” in Proceedings of International Conference on Network Protocols, October 1998, pp. 137–150. [30] Frank P. Kelly, A. K. Maulloo, and David. K. H. Tan, “Rate control for communication networks: shadow prices, proportional fairness and stability,” Journal of the Operational Research Society, vol. 49, no. 3, pp. 237–252, March 1998. [31] David Lapsley and Steven Low, “An IP implemention of optimization flow control,” in Proceedings of IEEE Globecom, 1998, pp. 3023–3028. [32] David E. Lapsley and Steven Low, “Random early marking for Internet congestion control,” in Proceedings of IEEE Globecom, 1999, vol. 3, pp. 1747–1752. [33] Idit Keidar, Jeremy Sussman, Keith Marzullo, and Danny Dolev, “A client-server oriented algorithm for virtually synchronous group membership in wans,” in Proceedings of the 20th IEEE International Conference on Distributed Computing Systems, Taipei, Taiwan, April 2000, pp. 356–365, IEEE Computer Society Press, Los Alamitos, CA. [34] Idit Keidar and Roger Khazan, “A client-server approach to virtually synchronous group multicast: Specifications and algorithms,” in Proceedings of the 20th IEEE International Conference on Distributed Computing Systems, Taipei, Taiwan, April 2000, pp. 344–355, IEEE Computer Society Press, Los Alamitos, CA. [35] D.A. Agarwal, L. E. Moser, P. M. Melliar-Smith, and R. K. Budhia, “The totem multiple-ring ordering and topology maintenance protocol,” ACM Transactions on Computer Systems, vol. 16, no. 2, pp. 93–132, May 1998. [36] Yair Amir, Claudiu Danilov, and Jonathan Stanton, “A low latency, loss tolerant architecture and protocol for wide area group communication,” in Proceeding of International Conference on Dependable Systems and Networks. June 2000, pp. 327–336, IEEE Computer Society Press, Los Alamitos, CA.
100
[37] Takako M. Hickey and Robbert van Renesse, “Incorporating system resource information into flow control,” Tech. Rep. TR 95-1489, Department of Computer Science, Cornell University, Ithaca, NY, 1995. [38] Dan Rubenstein, Jim Kurose, and Don Towsley, “The impact of multicast layering on network fairness,” in Proceedings of ACM SIGCOMM, October 1999, vol. 29 of Computer Communication Review, pp. 27–38. [39] Thomas Bonald and Laurent Massoulie, “Impact of fairness on Internet performance,” in SIGMETRICS/Performance, 2001, pp. 82–91. [40] Robert C. Chalmers and Kevin C. Almeroth, “Developing a multicast metric,” in Proceedings of GLOBECOM 2000, 2000, vol. 1, pp. 382–386. [41] Huayan Amy Wang and Mischa Schwartz, “Achieving bounded fairness for multicast and TCP traffic in the Internet,” in Proceedings of ACM SIGCOMM, 1998. [42] Luigi Rizzo, “pgmcc: a TCP-friendly single-rate multicast congestion control scheme,” in ACM Computer Communications Review: Proceedings of SIGCOMM 2000, October 2000, vol. 30, pp. 17–28. [43] Todd Montgomery, “A loss tolerant rate controller for reliable multicast,” Tech. Rep. NASA-IVV-97-011, West Virginia University, August 1997. [44] Yair Amir, Baruch Awerbuch, Claudiu Danilov, and Jonathan Stanton, “Global flow control for wide area overlay networks: A cost-benefit approach,” in Proceedings of IEEE Openarch, June 2002. [45] Shuming Chang, H. Jonathan Chao, and Xiaolei Guo, “TCP-friendly window congestion control with dynamic grouping for reliable multicast,” in Proceedings of GLOBECOM 2000, 2000, vol. 1, pp. 538–547. [46] “The Spines Overlay Network,” http://www.spines.org.
101
[47] Yair Amir and Claudiu Danilov, “Reliable communication in overlay networks,” in Proceedings of the IEEE DSN 2003, June 2003, pp. 511–520. [48] Hans Rohnert, “A dynamization of the all pairs least cost path problem,” in STACS, Kurt Mehlhorn, Ed. 1985, vol. 182 of Lecture Notes in Computer Science, pp. 279–286, Springer. [49] “ns2 network simulator,” Available at http://www.isi.edu/nsnam/ns/. [50] “Spread group communication system,” http://www.spread.org/. [51] Yair Amir and Jonathan Stanton, “The Spread wide area group communication system,” Tech. Rep. 98-4, Johns Hopkins University Department of Computer Science, 1998. [52] L. E. Moser, Yair Amir, P. M. Melliar-Smith, and D. A. Agarwal, “Extended virtual synchrony,” in Proceedings of the IEEE 14th International Conference on Distributed Computing Systems. June 1994, pp. 56–65, IEEE Computer Society Press, Los Alamitos, CA. [53] R. Vitenberg, I. Keidar, G. V. Chockler, and D. Dolev, “Group communication specifications: A comprehensive study,” Tech. Rep. CS99-31, Institute of Computer Science, The Hebrew University of Jerusalem, 1999. [54] Brian White, Jay Lepreau, Leigh Stoller, Robert Ricci, Shashi Guruprasad, Mac Newbold, Mike Hibler, Chad Barb, and Abhijeet Joglekar, “An integrated experimental environment for distributed systems and networks,” in Proc. of the Fifth Symposium on Operating Systems Design and Implementation, Boston, MA, Dec. 2002, USENIX Association, pp. 255–270. [55] “The CAIRN Testbed,” http://www.cairn.net. [56] K. K. Ramakrishnan and Sally Floyd, “A proposal to add explicit congestion notification (ECN) to IP,” RFC 2481, January 1999. 102
[57] B. Braden, D. Clark, J. Crowcroft, B. Davie, S. Deering, D. Estrin, S. Floyd, V. Jacobson, G. Minshall, C. Partrige, L. Peterson, K. Ramakrishnan, S. Shenker, J. Wroklawski, and L. Zhang, “Recommendations on queue management and congestion avoidance in the internet,” RFC 2309, April 1998. [58] Jitedra Padhye, Victor Firoiu, Don Towsley, and Jim Krusoe, “Modeling TCP throughput: A simple model and its empirical validation,” in ACM Computer Communications Review: Proceedings of SIGCOMM 1998, Vancouver, CA, 1998, pp. 303–314. [59] Sally Floyd, Mark Handley, Jitendra Padhye, and Jorg Widmer, “Equation-based congestion control for unicast applications,” in ACM Computer Communications Review: Proceedings of SIGCOMM 2000, Stockholm, Sweden, August 2000, vol. 30, pp. 43–56. [60] Aditya Akella, Jeffrey Pang, Anees Shaikh, Bruce Maggs, and Srinivasan Seshan, “A comparison of overlay routing and multihoming route control,” in Proceedings of SIGCOMM 2004, Aug. 2004. [61] Athina Markopoulou, Fouad A. Tobagi, and Mansour J. Karam, “Assessing the quality of voice communication over internet backbones,” IEEE/ACM Transactions On Networking, vol. 11, no. 5, pp. 747–760, October 2003. [62] Vern Paxson, “End-to-End Packet Dynamics,” IEEE/ACM Transactions on Networking, vol. 7, no. 3, pp. 277–292, 1999. [63] David G. Andersen, Alex C. Snoeren, and Hari Balakrishnan, “Best-Path vs. MultiPath Overlay Routing,” in Proceedings of IMC 2003, Oct. 2003. [64] L. Peterson, D. Culler, T. Anderson, and T. Roscoe, “A Blueprint for Introducing Disruptive Technology into the Internet,” in Proceedings of the 1st Workshop on Hot Topics in Networks (HotNets-I), Oct. 2002. [65] “ITU-T Recommendation G.711: Pulse code modulation (PCM) of voice frequen-
103
cies,” http://www.itu.int/rec/ recommendation.asp?type=items&lang=E&parent=TREC-G.711-198811-I. [66] “ITU-T complexity
Recommendation algorithm
G.711 for
appendix
packet
loss
http://www.itu.int/rec/recommendation.asp?type
I:
A
high
concealment
quality with
low-
G.711,”
=items&lang=E&parent=T-
REC-G.711-199909-I!AppI. [67] “ITU-T Recommendation P.862: Perceptual evaluation of speech quality (PESQ),” http://www.itu.int/rec/ recommendation.asp?type=items&lang=e&parent=T-RECP.862-200102-I. [68] Y. Zhang, N. Duffield, V. Paxson, and S. Shenker, “On the Constancy of Internet Path Properties,” in Proceedings ACM SIGCOMM Internet Measurement Workshop, Nov. 2001. [69] C. Labovitz, A. Ahuja, and F. Jahanian, “Delayed Internet Convergence,” in Proceedings of SIGCOMM 2000, Aug. 2000. [70] C. Labovitz, C. Malan, and F. Jahanian, “Internet Routing Instability,” IEEE/ACM Transactions on Networking, vol. 5, no. 6, pp. 515–526, 1998. [71] B. Chandra, M. Dahlin, L. Gao, and A. Nayate, “End-to-End WAN Service Availability,” in Proceedings of 3rd USISTS, Mar. 2001. [72] Gianluca Iannaccone, Sharad Jaiswal, and Christophe Diot, “Packet reordering inside the Sprint backbone,” Tech. Rep. TR01-ATL-062917, Sprintlab, June 2001. [73] Alberto Medina, Anukool Lakhina, Ibrahim Matta, and John Byers, “BRITE: An approach to universal topology generation,” in International Workshop on Modeling, Analysis and Simulation of Computer and Telecommunications Systems - MASCOTS ’01, August 2001. [74] “The Spread Toolkit,” http://www.spread.org. 104
[75] A. Gulbrandsen, P. Vixie, and L. Esibov, “A DNS RR for specifying the location of services (DNS SRV),” RFC 2782, Feb. 2000. [76] J. Rosenberg, H. Schulzrinne, G. Camarillo, A. Johnston, J. Peterson, R. Sparks, M. Handley, and E. Schooler, “SIP: Session Initiation Protocol,” RFC 3261, June 2002. [77] H. Schulzrinne, S. Casner, R. Frederick, and V. Jacobson, “RTP: A transport protocol for real-time applications,” RFC 1889, IETF, Jan. 1996. [78] Fredrik Thernelius, “SIP, NAT and Firewalls,” Master’s thesis, Department of Teleinformatics, Kungl Tekniska Hgskolan, May 2000.
105
Vita Claudiu Danilov was born in 1970 in Bucharest, Romania. He attended the National College I. L. Caragiale in Bucharest, Romania, and got his bachelor degree in 1995 from Politehnica University of Bucharest, with a major in automation and computers. From 1995 to 1998 he worked for the National Institute for Research and Development in Informatics, Bucharest, Romania, and from 1998 to 2004 he did his PhD in computer science at The Johns Hopkins University, Baltimore, MD.
106