*Manuscript
Performance and quality of service of data and video movement over a 100 Gbps testbed Michael Klugea , Stephen Simmsb , Thomas Williamc , Robert Henscheld , Andy Georgie, Christian Meyerf , Matthias S. Muellerg , Craig A. Stewarth , Wolfgang W¨unschi , Wolfgang E. Nagelj a Technische Universit¨ at Dresden – 01062 Dresden, Germany;
[email protected] (Corresponding Author) Indiana University Information Technology Services – 2709 E 10th St., Bloomington, IN 47408;
[email protected]; 011-1-812-855-7211 c Technische Universit¨ at Dresden – 01062 Dresden, Germany;
[email protected] d Indiana University Information Technology Services – 2709 E 10th St., Bloomington, IN 47408;
[email protected] e Technische Universit¨ at Dresden – 01062 Dresden, Germany;
[email protected] f Technische Universit¨ at Dresden – 01062 Dresden, Germany;
[email protected] g Technische Universit¨ at Dresden – 01062 Dresden, Germany;
[email protected] h Indiana University Pervasive Technology Institute and Office of the Vice President for Information Technology – 2709 E 10th St., Bloomington, IN 47408;
[email protected] i Technische Universit¨ at Dresden – 01062 Dresden, Germany;
[email protected] j Technische Universit¨ at Dresden – 01062 Dresden, Germany;
[email protected]
b
Abstract Digital instruments and simulations are creating an ever-increasing amount of data. The need for institutions to acquire these data and transfer them for analysis, visualization, and archiving is growing as well. In parallel, networking technology is evolving, but at a much slower rate than our ability to create and store data. Single fiber 100 Gbps networking solutions are soon to be deployed as national infrastructure. This article describes our experiences with data movement and video conferencing across a networking testbed, using the first commercially available single fiber 100 Gbps technology. The testbed is unique in its ability to be configured for a total length of 60, 200, or 400 km, allowing for tests with varying network latency. We performed low-level TCP tests and were able to use more than 99.9% of the theoretical available bandwidth with minimal tuning efforts. We used the Lustre file system to simulate how end users would interact with a remote file system over such a high performance link. We were able to use 94.4% of the theoretical available bandwidth with a standard file system benchmark, essentially saturating the wide area network. Finally, we performed tests with H.323 video conferencing hardware and Quality of service (QoS) settings, showing that the link can reliably carry a full high-definition stream. Overall, we demonstrated the practicality of 100 Gbps networking and Lustre as excellent tools for data management. Keywords: High Performance Computing, Lustre, Networking, Performance Analysis
Preprint submitted to Future Generation Computer Systems
October 19, 2011
1. Introduction It is a common observation that the processing, storage, and networking capabilities of computers and eScience or cyberinfrastructure systems [1][2] generally have grown at different rates in the past decade. Processing capabilities of CPUs have grown at a Moore’s Law rate of doubling every 18 months; disk capacity has of late been increasing at a similar rate. With regard to long haul networking, we have for years been stuck at 10 Gbps and multiples thereof as the standard. There are some implementations of 40 Gbps but they are not common in production networks. Data production is changing in a variety of ways: new capabilities of the most advanced supercomputers generate prodigious amounts of data – for example, COLA (Center for Ocean-LandAtmosphere Studies) produces roughly 1.8 petabytes (PB) of data per year [3]; a single next-generation DNA sequencing system can produce more than 350 terabytes (TB) of data per day [4]; and sensor nets such as the Earth Science Data and Information System create 2.9 TB per day [5]. 100 Gbps long haul networks are a significant step forward in long haul networking capability. They constitute the highest commercially available bandwidth over a single lambda on an optic fiber. 100 Gbps networking has the potential to have a significant impact on design of distributed computing systems of all kinds. Table 1 shows the time to move data sets of various sizes over 100, 10, and 1 Gbps networks, assuming perfect efficiency in terms of the practical impact on moving large amounts of data. While the arithmetic of these calculations is quite basic, the practical impact bears note. At 10 Gbps it really is not effective to move a petabyte of data over a network. At 100 Gbps such an amount of data can be moved in just more than a day. Table 1: Time to move large data sets over networks of varying capability. Data size
Network capability
1 TB
1Gbps 10 Gbps 100 Gbps 1 Gbps 10 Gbps 100 Gbps
1PB
Time to move (assuming perfect data transport efficiency) 2.4 hours 14.7 minutes 88 seconds 3.4 months 10.4 days 25 hours
This has profound effects on the organization of cyberinfrastructure and eScience facilities at all levels, from the campus to the national level to the international level. Within the US this topic is discussed under the term campus bridging. The goal of campus bridging is “to enable the seamlessly integrated use among a scientist or engineer’s personal cyberinfrastructure; cyberinfrastructure on the scientist’s campus; cyberinfrastructure at other campuses; and cyberinfrastructure at the regional, national, and international levels; as if they were proximate to the scientist. When working within the context of a Virtual Organization (VO), the goal of campus bridging is to make the
2
‘virtual’ aspect of the organization irrelevant (or helpful) to the work of the VO.” [6] In the context of the data deluge, the concept of campus bridging is important in terms of moving data within a campus, and moving data from campuses to other campuses and to national eScience and cyberinfrastructure systems. These challenges are general to any campus that may produce many terabytes of data per day – in aggregate – and have at best one or two 10 Gbps connections to national facilities. A facility with dozens of next generation sequencers would create enough data that it would be practically impossible to move data out of the facility to a national computational resource for analysis or storage system for archiving. There are implications at the level of organization of national facilities as well. For example, within the US, XSEDE [7] partner institutions make two very large supercomputers available to the US research community – the two “track II” systems (the 579 TFLOPS Ranger at TACC [8] and the 1.17 PFLOPS Kraken at NICS [9]). Within each of these facilities, the basic networking infrastructure is many 10 Gbps connections within a single machine room. Given the capabilities of each system to produce data from simulations or data analysis and visualization, it becomes very challenging to move the very large data sets produced from one site to another. As a result, matters such as backup or migration of jobs from one system to another become very difficult. These examples demonstrate that the availability of 100 Gbps networking creates a major change in the practical options for grid computing system design and distributed scientific workflows. If 100 Gbps networking is efficient and effective, this would have significant implications for achieving the goals of campus bridging and organizing national and international cyberinfrastructure and eScience facilities. With the assistance of several vendor partners, we were able to set up and test a 100 Gbps testbed using the first commercially available networking equipment – from Alcatel-Lucent. This testbed was in operation between Technische Universit¨at Dresden [10] and Technische Universit¨at Bergakademie Freiberg [11] between June 11, 2010 and May 31, 2011. The partners in creating the testbed included Technische Universit¨at Dresden, Technische Universit¨at Bergakademie Freiberg, Alcatel-Lucent [12], Indiana University [13], T-Systems GMBH [14], Fraunhofer ITWM [15], Hewlett Packard (HP) [16], Data Direct Networks (DDN) [17], VMware [18], interface:systems [19], and Whamcloud, Inc. [20]. This testbed provided an opportunity to perform a variety of data movement and quality of service (QoS) tests with the first commercially available networking gear that transports 100 Gbps on a single optical network wavelength. The Lustre-WAN tests resulted in the full saturation of the first commercial 100 Gbps link. This testbed is the first of its kind outside of a vendor lab, and the results contained in this document are the first from this testbed submitted for publication. We conducted a variety of performance tests to investigate the capabilities and utility of the network in a variety of ways, as follows: • Basic TCP/IP performance over a 100 Gbps network • Bulk data movement using the object store file system Lustre over Wide Area Networks (Lustre-WAN) • QoS performance over a stressed network, using videoconferencing as the service enjoying a QoS performance guarantee 3
The work reported here focused on data transport with TCP/IP and via LustreWAN. The importance of TCP/IP is clear; the data transport via TCP/IP forms the upper limit for data movement for any applications that use TCP/IP for transport (which are most, although not all applications that involve large amounts of data transport). The largest part of our testing focused on data transport with Lustre. Lustre is an object store file system available as open source [21] and used in a variety of contexts in advanced computing. As of the latest list of the 500 fastest supercomputers in the world [22], about 50% of the hundred fastest use Lustre as their scratch file system. Some have used Lustre as a site-wide file system, while others have used it as a wide area file system. Lustre was used in production for the TeraGrid’s globally accessible file system from 2008 [23] [24] to the end of the TeraGrid project in June 2011. We have demonstrated the value of remote file systems mounts, using Lustre, as a way to transport data effectively and efficiently to enable wide area distributed workflows [25] [26]. There has been one head-to-head test between Lustre and GPFS – at the SC07 Bandwidth Challenge, a Lustre-based system achieved a greater peak bidirectional bandwidth of data movement than GPFS (or any other file system participating in that contest) [27]. We have previously demonstrated 90% efficiency across production 1 Gbps network links and 80% efficiency across production 10 Gbps network links, both with latencies around 18ms. Because of the importance of Lustre within large supercomputer centers, and the likely outcome that many of the early implementations of 100 Gbps research networks will connect existing supercomputer centers, most of this paper focuses on data transfer performance over a 100 Gbps testbed. In addition, we had the opportunity to test Quality of Service guarantees over a 100 Gbps network. In practice, demands on 10 Gbps networks are so high that there is little opportunity in practice to provide meaningful enhancement of services with QoS, simply because for many applications “all of the bandwidth and them some more” would be the only reservation that would be of any practical value. With the substantial step up in network bandwidth from 10 to 100 Gbps, it seemed useful and interesting to test QoS guarantees since at that level of networking capability it may be possible, practically, to divide the bandwidth among multiple applications and guarantee each enough bandwidth to be useful. We used a combination of videoconferencing and file transfer to test QoS over 100 Gbps, providing a QoS guarantee for videoconferencing traffic within a network when attempting to overload it with file transfers. In the remainder of this paper, we first describe the experimental testbed itself, and then describe the tests and performance results obtained in each of the four application areas described above. 2. Experimental framework – the TU-Dresden TU-Freiberg 100 Gbps testbed The testbed is depicted schematically in Figure 1. The testbed spans the distance between TU Dresden and TU Bergakademie Freiberg. This distance is about 37 km geographically, but the fiber run from place to place was about 60 km. To simulate even longer distance networking, canisters of optical fiber cable were connected in a series to create physical networks of 200 and then 400 km.
4
Dresden
5x QDR InfiniBand
ClusterVision 120 nodes
17x 10GE
17x HP server
ALU 7750 20x 10GE
ALU 1830 100GE
1x 100GE
16x FC-8
1x DDN SFA10000
2x DDN S2A9900
16x FC-8
60, 200, 400 km
1x 100GE
ALU 1830 100GE
17x 10GE
ALU 7750 20x 10GE
17x HP server
SGI ICE 8200 64 nodes
17x DDR InfiniBand
Freiberg
Figure 1: Schematic diagram of 100 Gbps testbed between TU Dresden and TU Bergakademie Freiberg.
At each site, connections from the fiber to other IT systems are in the following order: • Alcatel-Lucent 1830 photonic service switch (100 Gbps on a single lambda) • Alcatel-Lucent 7750 SR-12 service router, with the following MDAs (Media Dependent Adapters): – One adapter with one 100 Gbps connection – Two adapters with 5 x 10 Gbps connections – Five adapters with 2 x 10 Gbps connections – One adapter with 20 x 1 Gbps connections In total, the local network connections at each site to the Alcatel-Lucent 1830 photonic service switch totaled 320 Gbps. We should note that the 100 Gbps network is not implemented in the AlcatelLucent equipment by simply trying to drive the data transmission rate in baud units up to 100 Gbaud. At 100 Gbaud, several fiber propagation effects – such as chromatic dispersion, polarization mode dispersion, optical noise, and nonlinearities – have a highly detrimental impact on overall transmission performance and signal quality. Alcatel-Lucent’s 100 Gbps optical networking technology is implemented by using more complex modulation formats and receiver architectures that establish a 100 Gbps data transmission rate at 25 Gbaud. This implementation involves the combined use of polarization division multiplexing (where two orthogonal polarizations of the optical light can be used to encode more information), quaternary phase-shift keying, and a four-phase state coding scheme. This solution, however, requires a different type of receiver with respect to conventional optical transmission. Alcatel-Lucent implements coherent detection. When using coherent detection, an optical mixer receives a spectrum of phase-modulated signals in a wavelength. By mixing this with the signal of a local oscillator that runs at the same frequency, only the optical signal at the same
5
frequency is amplified (constructive beating). All other frequencies are attenuated because they are not coherent with the local oscillator [28] [29] [30]. A variety of computational, storage, and private cloud (VM hosting) systems were available as sources and targets of data transmission at each site: • Computation and VM hosting. A total of 34 HP DL160G servers (17 at each site), each equipped with one six core Intel Westmere (Xeon 5650, 2.67 GHz) processor and 24 GB RAM. Each server had three PCIe cards providing three different connections via three different network protocols: – One ServerEngines 10GE card providing a single 10 Gbps connection to the 7750 service router for each server. – One InfiniBand (IB) connection to a local compute cluster - DDR IB in Dresden and QDR IB in Freiberg. – One FibreChannel link running at 8 Gbps (FC-8), able to transfer about 800 MB/s of application data, connecting to the storage systems described below. • Storage. The storage systems used in this testbed have been supplied by DDN – two S2A9900 for Dresden and one SFA10K for Freiberg. This allowed the storage to deliver at least 10 GB/s of data from disk to the main memory of the HP servers on both sides. 3. TCP/IP tests The most basic level of network performance testing is simply data transport performance via TCP/IP. The measurements at the transport layer are the basis for all subsequent tests. The latency of the different components was determined with the help of BenchIT [31] by sending a 64 byte TCP/IP message to a server, which sent it back. Two timestamps were taken – one when the packet was sent and the other when it returned. The difference of the two timestamps divided by two gives the latency of the infrastructure. Table 2: Transit time for a 64 byte TCP/IP message on various network components. Component of network TCP/IP-Stack and network adapter (measured by direct connection of two servers) ALU 7750 Service Router: (measurement at one site) ALU 1830 Photonic Service Switch and a 60 km dark fiber
6
Measured latency or transit time (ms) 0.05 0.04 0.27
Table 3: Round Trip Time for a 64 byte TCP/IP message depending on the connection type. Connection type 60 km physical connection 200 km physical connection 400 km physical connection
Round Trip Time (ms) 0.72 2.17 4.14
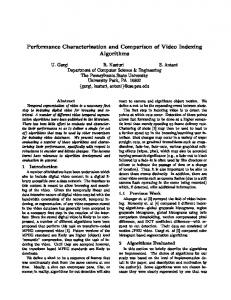
Achieved bandwidth of a data payload transmission with a single 10 Gbps data stream was then measured and tuned. Techniques learned in tuning a standard 10 Gbps connection were of significant aid [32]. Applying these well understood techniques, tuning of the TCP kernel and using a Path Maximum Transmission Unit (PMTU) of 9000 bytes, a data payload transfer rate, generated with iperf, of 9.92 Gbps was achieved. Due to the fact that the maximum achievable data rate depends on the transferred amount of payload data, the distance had no measurable effect. However, because there are more data on the link at a time, a parameter adjustment was necessary. The next step in data transmission tuning was to increase the number of data streams employed in data transmission. By increasing the number of HP server nodes in the cluster connected to the ALU 1830 switch from 1 to 16 (each producing data at the maximum possible rate of effectively 9.92 Gbps), we increased the total amount of data and the number of fully utilized 10 Gbps network connections transmitting data to the ALU 1830 step by step. Figure 2 shows the data payload throughput from 1 node to 16. Utilization increases almost linearly, with actual data payload transport peaking at 99.9% efficiency at 98.78 Gbps with 10 nodes producing data. The actual distance between both ends (60, 200, or 400km) had no influence on this and the following numbers. At node counts higher than 10, when the network connections coming in to the ALU 1830 100 Gbps switch exceed a total of 100 Gbps, the per port/per node data payload transfer becomes more variable and actually decreases slightly. Figure 3 demonstrates the data rate in Gbps from each node as the number of nodes transmitting data goes from 1 to 16. For each, a box plot shows in green the average, 95% confidence intervals, the minimum in yellow, and the maximum data rate transmitted by each participating node in red. The plot for one node is the average over time for a single node as there are no competing data transfers. For 11 and higher input nodes, the 100 Gbps connection is under excess load, which is reflected in the increasing variance and the narrowing average data throughput. In summary, TCP/IP over the 100 Gbps testbed showed round trip latency from 0.72 ms for 60 km up to 4.14 ms for 400 km. With one cluster node transmitting data over a 10 Gbps link to the 100 Gbps ALU 1830 switch we achieved overall data throughput of 9.92 Gbps. Increasing the number of cluster nodes transmitting data over 10 Gbps increased data at an approximately linear rate, with a maximum data throughput rate of 98.78 Gbps, or 99.9% of the total theoretical capacity of the 100 Gbps optical network connection.
7
port utilization depending on the number of used nodes 100 maximum port utilization in %
90 80 70 60 50 40 30 20 10 16
15
14
13
12
s
s
s
de
no
de
no
s
de
no
s
de
no
s
s
de
no
de
no
s
de
no
s
de
no
s
de
no
s
de
no
s
s
s
de
no
de
no
de
no
s
de
de
no
de
no
no
10
9
8
7
6
5
4
3
2
1
11
0
Figure 2: Increase in TCP/IP data transmission as the number of cluster nodes sending data over 10 Gbps network connections to the 100 Gbps switch increases from 1 to 16.
4. Lustre file transfer over Wide Area Networks (Lustre-WAN) For performance testing of data reading and writing via Lustre-WAN we used the IOR benchmark [33], a well known benchmark for file systems developed by Lawrence Livermore National Laboratories. It is widely used for evaluating POSIX I/O [34], MPI I/O [35], and HDFS [36] data movement performance. We used the following scenario to maximize network utilization: Both local compute clusters were used to write data to (or read data from) the storage devices at the other side of the link. The first task in the sub-project dedicated to the evaluation of parallel file systems was to saturate the link with file I/O. The compute cluster in Dresden generated I/O traffic, which was then transmitted through the local HP nodes to the HP nodes on the other side. Finally, the remote HP nodes fulfilled the associated I/O requests. In this context the local HP nodes function as routers to translate InfiniBand (IB) traffic from the client nodes to 10Gbit Ethernet traffic, which the remote HP nodes received and acted upon. One HP server on each side is dedicated to the file system metadata (MDS) and 16 servers to serving the file content (OSS). We virtually divided the Lustre I/O network into two parts by using different network identifiers with the Lustre networking layer. One was responsible for requests to the metadata server and one for requests to all OSS servers. This allows for the general case to route all MDS requests through dedicated servers and thus to proceed without interfering with other traffic. This separation is a common practice to avoid the starvation of metadata message traffic due to high bandwidth demands. Lustre supports many networks that are common to the HPC environment by using its own network abstraction layer (LNET). LNET acts as a broker between different
8
data rate depending on the number of used nodes 10
data rate in Gbit/s
8
6
4
2
16
15
14
13
12
s
s
s
de
no
de
no
s
de
no
s
de
no
s
de
no
s
de
s
de
no
no
s
de
no
s
de
no
s
de
no
s
de
no
s
s
de
de
no
no
s
de
de
no
de
no
no
10
9
8
7
6
5
4
3
2
1
11
0
Figure 3: Box plot of per-node data transport performance from 1 to 16 cluster nodes, each connected by a 10 Gbps network connection to the 100 Gbps switch.
network technologies and different subnets. As a service layer for the actual file I/O, LNET transmits packets that represent Lustre remote procedure calls (RPCs). The routing between the IB and 10Gbit Ethernet network on the HP nodes does not induce high demands on CPU load, as for each incoming packet LNET has to strip off the header, generate new packets (if the allowed packet sizes do not match) and add headers for the outgoing network. This happens completely within the Linux kernel, which avoids unnecessary copies between user and kernel space. Furthermore, LNET has a built-in self test capability that allows it to simulate Lustre read and write RPCs with different RPC sizes and different numbers of communication pairs. On the server side, Lustre uses a modified ext4 (ldiskfs) as a backend to access the storage devices. Writing to such a file system includes writing a file system journal that keeps track of ongoing I/O requests that have not been committed by the disk device yet. Hence, for each large I/O request there is an additional small I/O request that goes to a different part of the disk. This includes a head seek on the disk, therefore interrupting a constant stream of large I/O blocks. Today it is common to place these journals onto a solid-state drive (SSD). Having no SSD devices, we wrote the journals to random-access memory disks on the HP nodes. While this is not suitable for production systems, it allowed consistent measurements closer to what would normally be achieved in a production system with SSD devices than would writing these journals onto spinning disk. Due to the limited hardware resources to which we had access, we were not able to potentially take advantage of alternate concurrent routes by using multi-path I/O. The DDN devices internally use an 8+2 RAID scheme with an implied chunk size of 131 KB (128 KiB); thus, the optimal I/O request size is 1.05 MB (1 MiB) – which also happens to be the maximum size of a Lustre RPC. Another configuration choice 9
LNET routing 10 GE
FC-8
OSC OBDFILTER
From / To Other Site
From Local Cluster
DDR/QDR IB
OSS NODE
To DDN Storage
Figure 4: Protocol conversion within an HP node for parallel Lustre tests.
is whether to use buffered or direct I/O. By using buffered I/O on the client early in our investigations we observed that the cores on the clients became busy with the copying of the memory between user and kernel space. With direct I/O the throughput per process is limited, as Lustre has to wait for the completion of I/O requests before the associated system call can return to user space. Our initial testing with Lustre-WAN was done with the basic 60 km physical network connecting Dresden and Freiberg. The network bandwidth of LNET is the upper limit for bandwidth for file I/O requests, but Lustre provides the possibility to exercise the internal networking layer separately. We tested paths between the two groups of HP servers and between the clients on one side and the HP servers on the other side. Between the two groups of servers we observed 12.049 Gbps as peak bandwidth, and from one compute cluster to the HP servers on the other side the peak was at 11.94 Gbps. The difference can be interpreted as the IB to TCP routing overhead in the HP switches plus additional overhead induced by an IB switch within the compute cluster. For the actual file system tests we used the IOR benchmark [33] to generate the I/O workload. The basic decisions for the IOR test were to choose a block size, number of processes per node, stripe size, and stripe count, as well as whether to use Direct I/O. After a series of initial tests, I/O requests of 10 MiB, a file size of about 8 GiB per process, a stripe size of 1, 24 processes per HP node, and the use of Direct I/O proved to be the most successful combination. Over the 60 km testbed, with the configuration described above, we achieved a unidirectional throughput of 11.8 GB/s and bidirectional throughput of 21.9 GB/s. This is equivalent to network bandwidth of 94.4 Gbps unidirectional and 175.2 Gbps bidirectional. This is 95.6% of the peak data payload transfer we achieved with TCP/IP, and 94.4% of the maximum theoretical possible with perfect data transport efficiency. In
10
other words, the 100 Gbps testbed link was effectively saturated. In early November 2010, Indiana University’s Pervasive Technology Institute announced the saturation of first commercial 100 Gbps link [37]. 4.1. Lustre-WAN testing with bursty data Having consistently achieved excellent data transfer over the network with an extremely predictable and nicely behaved system configuration, we wished to test data transport with workloads that correspond better to the sort of workloads more commonly encountered in practice – bursty workflows. This provides a better view of what users might actually experience in practice. We also wished to test the impact of the 200 and 400 km physical network on Lustre-WAN data transport. We used the same Lustre configuration described above in these tests. The basic test configuration was to generate bursty data in Dresden and transport it to Freiberg. IOR was again used to generate traffic. We used POSIX I/O writing one file per process with O DIRECT, as earlier experiments showed higher CPU loads for non-O DIRECT I/O. IOR uses MPI to synchronize processes; therefore, switching on “intraTestBarriers” adds an MPI Barrier()between each test to ensure that there is no traffic left from a previous I/O burst. The benchmarks were executed on the Dresden HP nodes on a mount point pointing to the Lustre in Freiberg with the SFA10K DDN storage, where 48 OSTs created on the 16 Freiberg HP nodes were connected via FibreChannel links (see Figure 1). Dataflow of the bursts on the 100 Gbps line from the file system view were in one direction only, always writing on the Dresden HP nodes to the Lustre on the Freiberg SFA10K DDN. IOR uses the 1Gigabit Ethernet management links for MPI Communication to not disrupt the Lustre traffic. The value “blockSize” denotes the amount of data to be written to each file per process and test run, and “transferSize” denotes the quantity sent with each I/O request. The latter is restricted by IOR to a minimum of 8 bytes and a maximum of 2 GB. The 4 GB bursts are thus internally split by IOR into 2x2 GB I/O calls. The use of IOR in this context then involved setting one portion of the configuration statically (shown in Figure 5), with parameters tuned based on our earlier experiments with TCP/IP and steady streams of data flow with Lustre. IOR can also be configured to create bursts of data. A total of 2,672 burst tests were run using 1 to 16 processes in parallel; the configuration of one of those bursts is shown in Figure 6. Multiple clients simulated different scenarios ranging from simultaneously sending a few byte messages up to 2 GB bursts. As the two compute clusters beside the HP nodes (see Figure 1) were not available during the time frame dedicated to the burst measurements, the Lustre file system was mounted on the 16 HP nodes directly and the benchmarks were run there as well. We instrumented IOR with VampirTrace [38] to better understand the performance characteristics of the system in the burst tests. The Alcatel-Lucent 7750 router (see Section 2) keeps internal statistics of the bytes sent and received. Using an experimental tool currently under development at ZIH [10], these statistics were added to the Vampir analysis of the data. As a result the raw amount of data passing through the 100 Gbps line can be measured and correlated to the data sent and received at the application level by IOR. 11
RUN
api=POSIX
blockSize=32000000
filePerProc=1
transferSize=32000000
useO_Direct=1
numTasks=4
intraTestBarriers=1
RUN
repetitions=10
blockSize=33000000
writeFile=1
...
readFile=0
Figure 5:
IOR configuration header.
Figure 6: Burst test with 4 processes, each sending 32 MB.
Figure 7 shows an overview of the full run visualized with Vampir7 [39] made on the 60km testbed. The colors denote the type of code running on each process where red is MPI (here only used for synchronization), green is IOR management code and yellow depicts I/O function calls. As can be seen in the picture the test scenario repeats the burst pattern described above for 1-16 processes and IOR blocks the unused ones with an MPI Barrier. The zooming capability of Vampir now allows for each number of processes, each test, or even each single I/O call to be analyzed in detail.
Process 0 Process 1 Process 2 Process 3 Process 4
MPI_Barrier
Process 5 Process 6
MPI_Barrier
MPI_Barrier
Process 7
MPI_Barrier MPI_Barrier
Process 8
MPI_Barrier
Process 9
MPI_Barrier
Process 10 MPI_Barrier Process 11 MPI_Barrier Process 12 MPI_Barrier Process 13 MPI_Barrier Process 14 MPI_Barrier Process 15 MPI_Barrier
Figure 7: Trace of the full parameter sweep visualized with Vampir where the range of the burst length was 8 B to 2 GB and the length of the 100G link was 60 km. The figure shows the complete overview for all the 2672 burst lengths and 1-16 processes running in parallel. Yellow depicts IO, green is IOR management code, and red is MPI used to synchronize the processes between the bursts.
Figure 7 shows the same 2672 burst tests run 16 times for 1 to 16 processes in parallel. This is comparable to the TCP bursts done from 1 to 16 HP servers in parallel. With the different displays available in the Vampir GUI it is possible to zoom in and 12
to look at the section where only process 0 is actively performing its bursts alone, or to look at the end of the trace where all 16 processes were doing the same bursts at the same time. As the statistical displays in Vampir only show statistics of the part of the trace actually zoomed in to, one can compare process 0 running alone to process 0 when running with 15 other processes concurrently. In the course of tests using the 60 km network setup, statistics from IOR showed that a total of 27.82 TB (25.301 TiB) of data were written over the 100 Gbps line from the Dresden HP server to the Lustre in Freiberg. This is the data transport measured at the application level. Looking at network statistics, the router in Dresden showed a total of 28.093 TB (25.551 TiB) sent and 81.024 GB (75.460 GiB) received. The network based statistics thus showed 268 GB (250 GiB) more outgoing traffic and 81 GB (75 GiB) more incoming traffic than is recorded at the application level. This represents a mixture of Lustre metadata and TCP overhead. As process 0 participated in all 16 repetitions (1-16 processes running in parallel), it transferred a total of 3.27 TB (2.977 TiB) whereas process 15 transferred only 204.55 GB (190.502 GiB), which equals one parameter sweep for all burst lengths. Figure 8 shows the time process 0 spent for each full parameter sweep as a function of the numbers of active processes creating bursts. It shows the total time spent for the sweep, the time for the burst itself (I/O), the part that was spent in the management code (IOR) and the seconds blocked in MPI Barrier() as well as the overhead caused by VampirTrace. times of process 0 depending on the number of parallel bursts 1000
I/O management code MPI VT
time in s
800
600
400 200
0
6 /1 16 6 /1 15 6 /1 14 6 /1 13 6 /1 12 6 /1 11 6 /1
16
10
9/
16
16
8/
7/
16
16
6/
5/
16
16
4/
3/
16
16
2/
1/
number of processes creating traffic in parallel
Figure 8: Time spent on each parameter sweep by process 0 as a function of the numbers of bursts being sent in parallel.
It took 688.1 seconds (s) for process 0 doing a full run operating alone on the testbed and 996.6 s with all 16 processes writing in parallel, which is an increase of
13
308.5 s (45%) in total runtime. Looking at the time spent in I/O function calls this increases from 509.5 s by 173.5 s to 683.0 s (34%). The time spent in MPI Barrier() to synchronize is 1.1 s in the first case and 135.6 s if all processes create traffic. The time spent in IOR internal functions stays nearly the same regardless of how many processes are running. The increase in runtime is mainly affected by two factors. The more processes writing to Lustre in parallel, the more time is needed to synchronize as the wait time is dependent on the slowest process to finish writing. I/O rates tend to vary more with rising concurrency, although we are using only a fraction of the possible total bandwidth available. Additionally, VampirTrace has to flush its buffers (set to 512 MB) from time to time. This is done automatically during the MPI Barrier() to reduce perturbation of the trace pattern. This flushing happened during the runs with 7 and 13 active processes, and adds 8.7 s to the total runtime. Interesting is the run with 8 active bursts. Compared to the 7/16 run, the time needed for the burst itself drops by 69.1 s, and at the same time MPI needs 44.3 s more. This effect can be explained by looking at the other seven processes active in that run. Figure 9 depicts the times for each of the eight processes individually for the 7/16 run. It shows that process 0 needs only 513.9 s for I/O compared to process 5, which needs 638.2 s. The reverse is true for MPI, as process 0 spends 149.1 s in MPI Barrier() and process 5 only 25.2s. The average for I/O with eight bursts in parallel is 604.3 s with a total time of 863 s for each process. times of the processes doing parallel burst I/O 1000
I/O management code MPI
time in s
800 600 400 200
s es oc
s
es
oc
pr
pr
s es oc
s
es
oc
pr
pr
s es oc
pr s
es
oc s
es
oc
s
es
oc
pr
pr
pr
0
7
6
5
4
3
2
1
0
Figure 9: Time spent on parameter sweep with eight active processes.
4.2. Effect of distance Table 4 shows a selection of interesting data for all three route lengths of the 100 Gbps testbed. The 60 km run is used as a baseline for the percent values of the 200 km
14
and 400 km columns. Comparing the three routes shows an increase of the total time for all processes and all runs from 13,744 s to 17,659 s, which equals a 28.5% increase compared to the 60 km run. Overall, I/O takes 22.% longer whereas the time spent in internal functions of IOR, which includes some metadata I/O to check the file size and file system size, increases by 7.1%. Table 4: Selected data of all three route lengths, times in seconds if not stated otherwise.
Total time I/O Internal functions 1/16 I/O IOR 8 Byte min 8 Byte max 2 GB min 2 GB max 16/16 MPI I/O 8 Byte min 8 Byte max 8 Byte avg 2 GB min 2 GB max 2 GB avg
60 km 13,744 85,662 24,225
200 km 15,521 (112.9%) 93,557 (109.2%) 24,919 (102.9%)
400 km 17,659 (128.5%) 105,248 (122.9%) 25,945 (107.1%)
510.2 177.3 3.8 ms 6.9 ms 5.4 5.7
546.0 (107.0%) 182.5 (102.9%) 6.7 ms (176.3%) 8.4 ms (121.7%) 4.9 (90.7%) 6.9 (121.1%)
622.4 (122.0%) 192.2 (108.4%) 10.9 ms (284.2%) 28.3 ms (410.1%) 5.0 (92.6%) 6.9 (121.1%)
2340.0 10,648 3.9 ms 16.8 ms 5.1 ms 5.9 10.5 6.7
3821.7 (163.3%) 11,638 (109.3%) 6.6 ms (169.2%) 111.0 ms (660.1%) 8.5 ms (166.7%) 5.7 (96.6%) 9.9 (94.3%) 6.5 (97.0%)
5021.1 (214.6%) 13,066 (122.7%) 10.6 ms (271.2%) 66 ms(392.3%) 12 ms (235.%) 5.8 (98.3%) 10.0 (95.2%) 6.6 (98.5%)
Looking at a single process, it is interesting to note that although minimal values for the 8 byte transfer are within the expected range after the round-trip time measurements of Section 4.1, the scattering between minimal and maximal duration for a 8 byte burst becomes quite significant. In the 1/16 run for 400 km line length, one 8 byte write operation is omitted as it took 1.4 s and would have therefore distorted the statistic too much. The data gathered from the 7750 router show additional traffic that may indicate a retransmission. As the time spent in MPI in the total time and 1/16 run includes the MPI Barrier() used to block inactive processes, only the value of the 16/16 run is of interest. This represents time spent waiting for other processes to finish the actual burst. Comparing I/O duration times for the two route extensions shows the same behavior for the overall time, for only one active process (1/16), and for the test with all 16 bursts in parallel (Table 5). This indicates that the 22.9% increase for the 400 km sweep compared to the 60 km sweep is mainly due to latency. The number of parallel bursts does not seem to have a big influence as we are not saturating the link and overload
15
effects do not occur. The minimum, maximum, and average values for the 8 byte, 2 GB, and the 16/16 runs are the combined values of all processes. These values show the expected performance where the small values are dependent on the latency, whereas for large files the line length is of no importance but the scattering of the bandwidth gets more severe. Table 5: Bursts of process 0 running exclusively versus concurrent with 15 processes. Process 0 1/16 16/16 active
Burst length 8 Byte 2GB 3.8 ms 6.4 s 3.9 ms 11.0 s
Bandwidth Min 573.5 B/s 257.7 B/s
Max 468.3 MiB/s 461.6 MiB/s
4.3. Effects of WAN latency on small I/O requests in Lustre The testbed provides an undisturbed WAN environment with a path length that can be adjusted to 60, 200, and 400 km. In addition, it is possible to use only a part of the HP nodes as file servers and use the other part as clients to have an additional set (for simulated 0 km) of measurement data. This provides an ideal platform to study the impact of the network latency on file I/O and file systems. For users, latency is typically an issue for the interactive use of a remote system. Thus, they will see an influence on the file system performance depending on the distance between the compute cluster and the location of the file system. To investigate the impact of distance and latency on file I/O that would reflect use of Lustre over a wide area network, we used the IOzone benchmark [40] that executes a range of typical I/O patterns with different file sizes and different I/O request sizes. We used small files of 65.5 KB (64 KiB) up to 4.2 MB (4 MiB), as these are more likely to be used in an interactive session, and we ran IOzone in the 0 km, 60 km, 200 km, and 400 km configuration with a standard setup. All measurements were repeated a number of times with different stripe counts, thus taking into account that users may distribute their files over multiple storage devices (striping) to get better I/O performance. Figures 10a through 10c show the sum of the time that IOzone needs to open a file (for a given stripe count) and to write the file content with a single write() call. The respective latencies for the 0 km, the 200 km, and the 400 km case are 0 ms, 2.17 ms, and 4.14 ms. At the left of the x axis all graphs start at a point that is close to the latency. All graphs within the same figure are identical for file sizes in the range of 65.6 KB (64 KiB) up to 1 MiB. After that, for each stripe there is an additional penalty time in the range of the latency. In addition, each MiB written costs another (but smaller) penalty. This penalty is equal to the ratio of the transfer size and the transfer rate. We have to take different input parameters into account to understand this behavior. These are latency, number of Lustre RPCs needed to transfer the file content, a penalty per stripe, a penalty per MiB, the memory bandwidth, and the network bandwidth. As it turns out, the time that IOzone needs to complete the open() and write() calls depends linearly on the number of stripes accessed and the time needed to place the file data on 16
0.1 1 stripe 2 stripe 4 stripe 8 stripe 16 stripe
response time in seconds
response time in seconds
0.1
0.01
0.01
0.001
0.0001
0.001 64
128
256
512
1024
2048
4096
8192
16834
(a) 0 km 0.1
64
128
256
512
1024
2048
4096
8192
16834
file size in KiB
file size in KiB
response time in seconds
1 stripe 2 stripe 4 stripe 8 stripe 16 stripe
(b) 200 km
1 stripe 2 stripe 4 stripe 8 stripe 16 stripe
0.01
0.001 64
128
256
512
1024
2048
4096
8192
16834
file size in KiB
(c) 400 km
Figure 10: Time IOzone needs to open a file for a given stripe count and to write the file content for different path lengths: (a) 0 km, (b) 200km, (c) 400km. the network card (access size divided by bandwidth per HP node). An investigation revealed that Lustre locks the individual file stripes in a sequential fashion [39] . Only after it has written the first stripe will it start to acquire the second. Furthermore, if Lustre has collected 1 MiB of dirty data that needs to be sent, it will block the calling process and wait until all data are on the network. 4.4. Simulating more latency While it was nice to be able to test 4.2 milliseconds of latency with the 400 km connection, the distance from ZIH to IU is on the order of 130 milliseconds. For this reason, we looked at simulating the additional latency using a program called netem [41]. The author of netem says that it works best with single network streams [42]. Through testing, we confirmed that netem is useful only for simulating delay for low stream counts. Because Lustre relies on multiple parallel streams even while reading and writing single stripe files, netem is not an appropriate tool for simulating Lustre across the WAN. It became clear that if we wanted to perform latency simulations with Lustre, it would be necessary to use a network impairment device that would provide hardwarebased delay. Placed between a single 10Gb client and a Lustre cluster, the impairment device could more accurately simulate the behavior of a WAN. 17
4.5. Comparing LNET and IPERF performance The Lustre Network (LNET) protocol is used to communicate between OSS/MDS and the Lustre clients. Every data transfer is implemented on top of LNET. To benchmark the performance of LNET, the Lustre distribution contains the LNET self-test utility that allows for testing only the networking portion of the Lustre file system. Figure 11 shows the script that was used to measure the performance from one 10Gbps client to a 10Gbps OSS. The script performs a bulk write operation from the IP address listed as writers to the IP address listed as readers. The RPC size is set to 1 Mbyte, the default size used for a Lustre installation. 01 #!/bin/bash 02 export LST_SESSION=3 03 lst new_session rw 04 lst add_group readers 192.168.10.3@tcp1 05 lst add_group writers 192.168.10.23@tcp1 06 lst add_batch bulk_rw 07 lst add_test --concurrency=1 --batch bulk_rw --from writers --to readers brw write check=simple size=1M
Figure 11: Script used to measure performance from Lustre client to OSS.
When testing a single client writing to a single server, the concurrency parameter in line 06 equates to the number of Lustre RPCs in flight. In order to discover the maximum data rate for a single client to a single server using only Lustre networking, we swept the concurrency from the minimum of 1 to the maximum of 32. To test the maximum throughput of the network layer for 1MB blocks across the 4.2 milliseconds of latency, we used iperf with a TCP buffer size of 1MB. To simulate concurrency we varied the number of data streams from 1 to 32. Figure 12 shows the bandwidth for LNET selftest, iperf, and the number of RPCs per second. Results for iperf show that eight parallel streams, each with a buffer size of 1 MB, are enough to saturate the 10Gb link. LNET bandwidth levels off at roughly 1 GB/s and RPCs per second at 2000/s. Unlike iperf with its single acknowledgement, Lustre over TCP requires a second acknowledgement. The first acknowledgement is for the write request RPC. The second acknowledgement is for the return value of the RPC. Because of the two acknowledgements, one can see a 2:1 relationship between RPC/sec and MB/sec in the LNET self-test data. For example, at a concurrency of 4, there are 841 RPCs/sec and 418 MB/sec. At a concurrency of 32, we see a data rate of 1032 MB/s, which is 83% of the value we see with iperf.
18
LNET Selftest Scaling over 400 km Concurrency from 1 to 32 1200 1000
2500
800 600
1500
2000
1000
400
500
200 0
RPC per second
Bandwidth in MB/sec
1400
0 1
2
4
8
16
32
Concurrency / Parallel Streams LNET Selftest
iperf
RPC
Figure 12: Script used to measure performance from Lustre client to OSS.
5. QoS tests with videoconferencing While the major focus of the research we did with the experimental testbed was on data transport, we found that we were using videoconferencing between Dresden and Freiberg on a regular basis. It seemed interesting, therefore, to try some quality of service tests over the 100 Gbps link, reserving a portion of the 100 Gbps lambda for H.323 video traffic. This contrasts with the standard approach to QoS in practice now, at least in the US. QoS is guaranteed whether by dedicating entire network links (the approach Indiana University takes for supercomputer traffic between its two main campuses), or by dedicating 10 Gbps lambdas over long haul networks such as Internet2 or National LambdaRail. We performed tests with the newest Cisco Tandberg products – a Tandberg C40 codec in Dresden, and a Tandberg C60 codec in Freiberg, both capable of full high definition (HD) resolution at a bandwidth of up to 6 Mbps. In both cases we used point-to-point communications directly between the videoconferencing systems, without gatekeepers. The tests were run over 400 km. We set the QoS for the videoconferencing calls to reserve 6 Mbps for network bandwidth for the higher resolution equipment (corresponding exactly to the maximum data rate the equipment is capable of using). Our human experience of the HD videoconferences was that they were very good even under fully loaded networks – that is, we could turn up network load to 100%and the QoS reservation for the video conference traffic worked well. In terms of measurements, Table 6 shows the results of the testing. The Tandberg systems directly measured packet loss and jitter. With no network load, the connection parameters remained consistent at a channel bandwidth of 6 Mbps, a resolution of 1080p30 (1920x1080 pixels at 30 fps) with video codec H.264 and audio codec AAC-LD at 128 kbps. The parallel presentation (H.239) was transmitted with WXGA resolution (1280x720 pixels) at 30 fps. The calls were 19
Table 6: Results of HD video testing over 400 km with 6 Gbps reservation for videoconference traffic. Network load
No load TCP-load 99% bidirectional UDP load 99% unidirectional (Freiberg - Dresden) UDP load 99% unidirectional (Dresden - Freiberg) UDP load 99% bidirectional UDP load 99% QoS active
Audio packet loss 0.0% 0.0 % 1.5 - 3 %
Video packet loss 0.0% 0.0 % 0.8 - 1.4 %
Audio jitter
Video jitter
1-4ms 0 - 4 ms 0 - 4 ms
0-1ms 0 - 1 ms 0 - 1 ms
0.5 - 4 %
1.2 - 2 %
0 - 4 ms
0 - 1 ms
1 - 3.3 % 0.0 %
1.3 - 2.3 % 0.0 %
0 - 4 ms 0 - 4 ms
0 - 1 ms 0 - 1 ms
encrypted (AES-128). As expected, the full UDP network load with no dedicated QoS mechanism showed some impairment during the call with lost packets of up to 4% with no correlation between lost audio and video packets. Packet loss did not occur with constant values, but varied between 0.5% and 4.0% when the UDP network load was at maximum. With a committed QoS-channel of 6Mbps for the conference systems, even at maximum UDP load the connection was not affected and no packet loss occurred. Decreasing the QoS-bandwidth (both committed and peak information rate) caused packet loss of more than 80% during full UDP load, until the systems-integrated recovery behavior (resolution reduction to decrease the actual bandwidth) obtained acceptable values, which always correlated to the committed QoS-bandwidth. 6. Conclusion In this paper we have described a testbed that has been designed around the first commercially available network equipment to allow a 100 Gbps network connection over a single optical lambda. We also demonstrated the value of BenchIT, a new tool being developed that allows instrumentation of network equipment and programs with the VampirTrace performance analysis tool. Thus it was possible to simultaneously examine data transfer as reported by the IOR benchmark program at the application layer and measure the total data throughput as recorded by the network switches, providing insight into the overhead induced by networking and Lustre protocols (which were, overall, quite modest). Measurements with TCP/IP data transport showed that this network equipment is capable of supporting total data transport at almost the peak theoretical capability over a 100 Gbps link, and with tuning we were able to achieve data payload transport of 99.9% of the peak theoretical data transport rate.
20
Similarly, using ‘nicely behaved’ streams of data it is possible to essentially saturate a 100 Gbps with data transport via wide area network using Lustre. We have previously demonstrated this using 1 Gbps and 10 Gbps network links. At 100 Gbps, Lustre-WAN performance remains excellent – with data payload transmission 94.4% of the peak possible using TCP/IP over a 100 Gbps network. “Everything works as it should” is an extremely reassuring if not necessarily dramatic result. These results also demonstrate a capability for Lustre itself – with a modest storage and cluster system at each end of a 100 Gbps network link, Lustre is capable of saturating such a link and using it to its fullest capabilities. Testing the effect of distance with Lustre over a wide area network we generally found results one would expect. Again, these results were not dramatic, but important and reassuring in a long distance test of the first commercially available 100 Gbps networking equipment. With small packets, and small amounts of data to ship, the effect of distance is noticeable in latency and in variability of data transport largely in a relative sense because of the impact of the burstiness relative to the data transfer. With larger amounts of data, data are transmitted quite efficiently and the impact of the burstiness is somewhat reduced relative to the overall data transmission, as one might expect. We discovered one aspect of Lustre’s behavior that is important over wide area networks. Lustre acquires file locks in serial. For local file systems this is reasonable since the cost of acquiring a lock (assuming one is available) is low within a local installation. Over a wide area network the time cost of acquiring a lock has the network latency (which rises with distance) as its lower bound. By acquiring locks serially, this cost is paid once for each individual stripe. The performance of Lustre over a wide area network might be greatly improved if Lustre were to be modified to acquire all relevant locks at one time (in parallel) for each I/O. In addition, it might be useful to have dirty data moved out in the background by an additional helper thread and not blocking the application thread. Overall, we demonstrated the practicality of 100 Gbps networking and Lustre as excellent tools for data movement. Lustre is an open source file system widely used in high performance computing centers. Its excellent performance over a wide area is thus extremely important and implies that there are many opportunities for use of Lustre and 100 Gbps to support new, very large scale distributed scientific workflows. During these tests, we were able to demonstrate the effectiveness of QoS guarantees over the 100 Gbps testbed using videoconferencing as a test application. This worked well – and for 100 Gbps on a single optical lambda it may be practical for some time, at least, to use QoS as a way to enable multiple applications to enjoy consistent performance. The topic of campus bridging has received considerable attention of late in the United States. There are several excellent examples of excellent “within campus” networking, such as the Onyx project at University of California San Diego. Projects such as the Cal-IT2 OptIPuter and Data Capacitor-WAN at IU have demonstrated new capabilities in collaboration and distributed wide area networks using 10 Gbps (and multiples thereof) networking. Given a campus with excellent local networking supporting research activities, 100 Gbps long haul networks to national facilities or a regional or national 100 Gbps would provide exciting new opportunities for distributed scientific 21
workflows and campus bridging. 100 Gbps as a regional or national network would dramatically change the options for design of regional or national cyberinfrastructure and eScience systems. The major step in capability between 10 Gbps and 100 Gbps lambdas changes the very practical concerns of “what has to be done at one high performance computing center” vs “what can be distributed” very dramatically. Based on our testing, it seems possible and practical that 100 Gbps networking would allow movement of petabyte-scale data sets from a campus to a national facility, or between national facilities. For example, ZIH at TUD has considerable interest in how such networking might aid research within Freistaat Saxony. Indiana University has considerable interest in how such network capabilities might change our cyberinfrastructure and grid facilities within the state of Indiana in the US. Nationally and internationally, the capability to move a PB in about a day over a 100 Gbps network – as opposed to about 10 days over a 10 Gbps network – has general and practical importance on the organization of cyberinfrastructure and computing and data grids. New discoveries and greater effectiveness of national and international cyberinfrastructure should be possible with such networking equipment. 7. Acknowledgements We want to thank all contributors who made this testbed possible, namely AlcatelLucent, T-Systems, HP, DataDirect Networks, and VMware, as well as anyone at the TU Bergakademie Freiberg and the TU Dresden who supported the testbed. Indiana University’s participation in this project was supported in part and enabled by a variety of NSF grants to Indiana University: 0521433 [43], which funded IU’s initial experiments with Lustre; and 0504075 [44] and 0932251 (subcontract from University of Chicago [45]), which funded expansion and use of IU’s Lustre-WAN within the TeraGrid. This work leverages IU’s leadership of the FutureGrid project (NSF0910812 [46]), which facilitates research on grid projects generally. IU’s participation in this project was facilitated and supported by a grant from the Lilly Endowment to create the Indiana University Pervasive Technology Institute [13].The time and effort of Thomas William on this project was funded via a contract with IU. The videoconferencing tests were performed by Christian Meyer of the Competence Centre for Video Conference Services (VCC). The VCC is funded by the National Research and Education Network of Germany (DFN). This project was carried out under the auspices of a Memorandum of Friendship and Collaboration between the Office of the Vice President for Information Technology at IU and ZIH at TU Dresden. The editorial assistance of Malinda Lingwall of IU is gratefully acknowledged. References [1] National e-Science Centre, http://www.nesc.ac.uk/nesc/define.html, 2010.
Defining
e-science,
[2] C. Stewart, S. Simms, B. Plale, M. Link, D. Hancock, G. Fox, What is cyberinfrastructure?, in: SIGUCCS 2010, SIGUCCS, Norfolk, VA, pp. 37–44. http://portal.acm.org/citation.cfm?doid=1878335.1878347. 22
[3] Institute of Global Environment and Society, Center for Ocean-Land-Atmosphere studies (COLA), http://www.iges.org/cola.html, 2011. [4] Illumina Inc., Genome Analyzer IIe, http://www.illumina.com/systems/genome analyzer.ilmn, 2010. [5] NASA, EOSDIS Key Science System http://esdis.eosdis.nasa.gov/eosdis/systemmetrics.html, 2010.
Metrics,
[6] NSF Advisory Committee for Cyberinfrastructure Task Force on Campus Bridging, Final Report, PDF, March 2011. http://www.nsf.gov/od/oci/taskforces/TaskForceReport CampusBridging.pdf. [7] J. Towns, R. Roskies, J. Boisseau, P. Andrews, Planning for XSEDE: the eXtreme Science and Engineering Discovery Environment, http://www.nsf.gov/awardsearch/showAward.do?AwardNumber=0941686, 2009. [8] Texas Advanced Computing Center, http://www.tacc.utexas.edu/resources/hpc/, 2011.
HPC
Systems,
[9] National Institute of Computational Sciences, http://www.nics.tennessee.edu/computing-resources/kraken, 2011.
Kraken,
[10] Technische Universit¨at Dresden, The Center for Information Services and High Performance Computing (ZIH), http://tudresden.de/die tu dresden/zentrale einrichtungen/zih, 2011. [11] Technische Universit¨at Bergakademie Freiberg, freiberg.de/, 2011.
Home page,
http://tu-
[12] Alcatel-Lucent, Home page, http://www.alcatel-lucent.com, 2011. [13] Indiana University Pervasive http://www.pti.iu.edu/, 2011.
Technology
Institute,
Home
page,
[14] T-Systems International GmbH, Home page, http://www.t-systems.de/, 2011. [15] Fraunhofer ITWM, Home page, http://www.itwm.fraunhofer.de, 2011. [16] HP, Home page, http://www.hp.com/, 2011. [17] DataDirect Networks, Home page, http://www.ddn.com, 2011. [18] VMware, Home page, http://www.vmware.com/, 2011. [19] interface:business, Home page, http://www.interface-business.de, 2011. [20] Whamcloud, Inc., Home page, http://whamcloud.com/, 2011. [21] Whamcloud, Inc., Downloads, http://www.whamcloud.com/downloads/, 2011.
23
[22] TOP500.Org, TOP500 Supercomputing Sites, http://top500.org/, 2011. [23] J. Walgenbach, S. C. Simms, J. P. Miller, K. Westneat, Enabling lustre wan for production use on the teragrid: A lightweight uid mapping scheme, http://dx.doi.org/10.1145/1838574.1838593, 2010. Paper presented at: TeraGrid’10 (Pittsburgh, PA, 2010). [24] HPCWire, Indiana University Announces Lustre over WAN, http://www.hpcwire.com/hpcwire/2008-0429/indiana university announces lustre over wan.html, 2008. [25] S. C. Simms, G. G. Pike, D. Balog, Wide area filesystem performance using Lustre on the TeraGrid, in: Proceedings of the TeraGrid 2007 Conference, TeraGrid, Madison, WI. [26] C. A. Stewart, M. Link, D. S. McCaulay, G. Rodgers, G. Turner, D. Hancock, P. Wang, F. Saied, M. Pierce, R. Aiken, M. Mueller, M. Jurenz, M. Lieber, J. Tillotson, B. Plale, Implementation, performance, and science results from a 30.7 tflops ibm bladecenter cluster, Concurrency and Computation: Practice and Experience 22 (2010) 157–174. [27] Indiana University, Team led by IU wins supercomputing bandwidth competition, http://newsinfo.iu.edu/news/page/normal/6839.html, 2007. [28] Y. Miyamoto, S. Suzuki, Advanced optical modulation and multiplexing technologies for high-capacity otn based on 100 gb/s channel and beyond, IEEE Communications Magazine 48 (2010) S65–S72. [29] G. Veith, E. Lach, K. Schuh, 100 gigabit-per-second: Ultrahigh transmission bitrate for next generation optical transport networks, Comptes Rendus Physique 9 (2008) 1002–1011. http://www.sciencedirect.com/science/article/pii/S1631070508001308. [30] Alcatel-Lucent, Next-generation Electro-Optics Technology with Coherent Detection, PDF, 2010. http://resources.idgenterprise.com/original/AST0001819 100G Next Generation Coherent Technology TechWhitePaper.pdf. [31] G. Juckeland, S. Borner, M. Kluge, S. Kolling, W. E. Nagel, S. Pfl¨uger, H. Roding, S. Seidl, T. William, R. Wloch, BenchIT – Performance measurement and comparison for scientific applications, volume 13 of Advances in Parallel Computing, North-Holland, pp. 501–508. http://www.sciencedirect.com/science/article/pii/S0927545204800649. [32] W.-c. Feng, J. Hurwitz, H. Newman, S. Ravot, R. Cottrell, O. Martin, F. Coccetti, C. Jin, X. Wei, S. Low, Optimizing 10-gigabit ethernet for networks of workstations, clusters, and grids: A case study, in: 2003 ACM/IEEE conference on Supercomputing, ACM/IEEE, Phoenix, AZ, pp. 50– 62. http://doi.ieeecomputersociety.org/10.1109/SC.2003.10030.
24
[33] H. Shan, J. Shalf, Using IOR to analyze the I/O Performance for HPC Platforms, Technical Report, Lawrence Berkeley National Laboratory, 2007. http://escholarship.org/uc/item/9111c60j. [34] IEEE Standards Association, POSIX - Austin Joint Working Group, http://standards.ieee.org/develop/wg/POSIX.html, 2008. [35] Argonne National Laboratory, The message passing interface (mpi) standard, http://www.mcs.anl.gov/research/projects/mpi/, 2011. [36] Apache Software Foundation, http://hadoop.apache.org/hdfs/, 2011.
Hadoop
distributed
file
system,
[37] HPCWire, Indiana university announces saturation of first commercial 100 gigabit link, http://www.hpcwire.com/hpcwire/2010-1115/indiana university announces saturation of first commercial 100 gigabit link.html, 2010. [38] M. M¨uller, A. Kn¨opfer, M. Jurenz, M. Lieber, H. Brunst, H. Mix, W. Nagel, Developing Scalable Applications with Vampir, VampirServer and VampirTrace, volume 38 of Parallel Computing: Architectures, Algorithms and Applications, John von Neumann Institute for Computing, J¨ulich, pp. 637–644. http://dx.doi.org/10.1007/978-3-642-11261-4 2. [39] H. Brunst, D. Hackenberg, G. Juckeland, H. Rohling, Comprehensive Performance Tracking with Vampir 7, Tools for High Performance Computing 2009, Springer Berlin Heidelberg, pp. 17–29. http://dx.doi.org/10.1007/978-3642-11261-4 2. [40] W. D. Norcott, D. Capps, Iozone filesystem benchmark, http://www.iozone.org/, 2006. [41] Linux Foundation, netem, http://www.linuxfoundation.org/collaborate/workgroups/networking/netem, 2011. [42] S. Hemminger, Network emulation with NetEm, in: linux.conf.au, Canberra, AU. http://www.linux.org.au/conf/2005/abstract2e37.html?id=163. [43] C. A. Stewart, R. Bramley, B. Plale, C. Pilachowski, S. Simms, T. Hacker, MRI: Acquisition of a High-Speed, High Capacity Storage System to Support Scientific Computing: The Data Capacitor, http://nsf.gov/awardsearch/showAward.do?AwardNumber=0521433, 2005. [44] C. A. Stewart, A. Shankar, T. Hacker, E. Wernert, M. Bruhn, D. McCaulay, B. Voss, SCI: TeraGrid Resource Partners: Indiana University, http://www.nsf.gov/awardsearch/showAward.do?AwardNumber=0504075, 2005. [45] C. Stewart, TeraGrid Extension: Bridging to XD, 2010. Award number 41994-A.
25
[46] G. Fox, J. Fortes, A. S. Grimshaw, K. Keahey, W. Smith, FutureGrid: An Experimental, High-Performance Grid Test-bed, http://nsf.gov/awardsearch/showAward.do?AwardNumber=0910812, 2009.
26
*Biographies (Text)
Michael Kluge is a researcher and software engineer at the Center for High Performance Computing (ZIH) at Technische Universität Dresden. His research focuses on the performance analysis of parallel file systems and the development of tools to support I/O centric analysis approaches. Michael received a Masters degree in Information Systems Technology in 2004 and a Ph.D. in Computer Science from the Technische Universität Dresden in 2011. He was part of the team winning the Bandwidth Challenge at SC’07.
Stephen Simms leads the High Performance Filesystems group at Indiana University, where he manages the Data Capacitor Project. He has worked in research computing for over 12 years and has been an active member of the Lustre community since 2005. At SC07, Simms led the winning bandwidth challenge effort, demonstrating multiple applications using Lustre across the wide area network. In 2008, Simms and his team deployed a production wide area Lustre filesystem for researchers interested in harnessing geographically distributed resources. Most recently, Simms was elected to the board of OpenSFS as the Lustre community representative.
Thomas William received his Dipl.-Inf. degree in computer science from the TU-Dresden in 2007 for developing an I/O-tracing library for the D-Grid jobmonitoring framework. He has over seven years of experience in the benchmarking area and is especially interested in parallel I/O benchmarks. His actual research position at the Center for Information Services and High Performance Computing (ZIH) involves the integration of parallel analysis and visualization tools.
Robert Henschel leads the High Performance Applications group of Research Technologies at Indiana University and is a member of High Performance Group (HPG) of the Standard Performance Evaluation Corporation (SPEC). His research centers around performance analysis and tuning of parallel scientific applications. He received a master’s degree in computer science from Technische Universität, Dresden, Germany.
Andy Georgi is a researcher and tutor at the faculty of computer sciences at the Technische Universität Dresden. He received his diploma in Computer Sciences in 2008. His research currently focuses on distributed computing, high-speed interconnects and cluster computing as well as aspects of teaching. Additionally he gives lectures in these topics for undergraduates.
Christian Meyer graduated at Technische Universität Dresden in 2008 with a diploma degree in media computer science majoring in “Cooperative Multimedia Applications” with a thesis focusing on collaborative online environments and video conferencing. Subsequently he has been active as research associate in the “Competence Center for Video Conferencing Services (VCC)”, a project of Germany’s National Research and Education Network DFN, located at the Center for Information Services and High Performance Computing (ZIH) of Technische Universität Dresden. Matthias S. Mueller obtained a diploma in Physics and a PhD from University Stuttgart. From 1999-2005 he worked at the High Performance Computing Center Stuttgart (HLRS), Germany. He is currently deputy director and CTO of the Centre for Information Services and High Performance Computing in Dresden, Germany. His research interests include programming methodologies and tools, computational science on high performance computers and Grid computing. He is a member of the German Physical Society (DPG) and Vice President of SPEC’s High Performance Group. Dr. Craig A. Stewart, Ph.D., is Associate Dean for Research Technologies and Executive Director of the Pervasive Technology Institute – both units that report to the Office of the Vice President for Information Technology. A biologist by training, Stewart has been involved in high performance and datadriven computing at Indiana University for many years. He has been the Principal Investigator on a variety of NSF and NIH grant awards, including the grant award that launched the Data Capacitor project. A longer biography is online at http://www.indiana.edu/ ~ovpit/bios/cstewart.html . Wolfgang Wünsch studied at the Technische Universität Dresden electrical engineering, microprocessor technology, and engineering education. Since 1993 he is Head of Department of “Networks and communication services” for planning, construction and operation as well as the further development of the data network of TU Dresden and its connection to international wide area networks. Since 2002 he is project leader of the “Competence Centre for Video Conference Services (VCC)” of the German Research Network (DFN) and since 2010 project manager of the “100Gigabit Testbed DresdenFreiberg” at the Center for Information Services and High Performance Computing (ZIH) Dresden. Wolfgang E. Nagel received his Ph.D. from RWTH Aachen in 1993. He holds a Chair for Computer Architecture at Technische Universität Dresden since 1997 and is the founding director of the Center for Information Services and High Performance Computing (ZIH). He has published more than 100 papers covering modern programming concepts and software tools to support complex compute intensive applications, analysis of innovative computer architectures, and the development of efficient algorithms and methods. Prof. Nagel is chairman of the Gauß-Allianz, and a member of the International Exascale Soft- ware Project (IESP).