Prediction of Processor Utilization for Real-Time Multimedia Stream Processing Tasks1 Henryk Krawczyk, Jerzy Proficz, Bartłomiej Daca Gdansk University of Technology, Narutowicza 11/12, 80-233 Gdansk, Poland
[email protected],
[email protected],
[email protected]
Abstract. Utilization of MPUs in a computing cluster node for multimedia stream processing is considered. Non-linear increase of processor utilization is described and a related class of algorithms for multimedia real-time processing tasks is defined. For such conditions, experiments measuring the processor utilization and output data loss were proposed and their results presented. A new formula for prediction of utilization was proposed and its verification for a representative set of tasks was performed. Keywords: processor utilization prediction, real-time, multimedia, KASKADA platform
1
Introduction
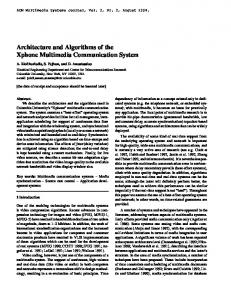
Various types of processing tasks cause different types of load: computation, memory, network etc. One of the most underestimated types is load appearing between RAM (Random Access Memory) and a processor cache memory. Fig. 1 presents an example of a typical architecture of a computation node used in a computation cluster. A multi-core processing unit (MPU) contains its own fast memory which is easily accessible, with high clock frequency, by its computation cores. On the other hand, the RAM is connected using much lower frequency as well as with a limited number of channels, what causes the possibility of performance bottleneck when some cores cannot get requested data from the RAM. In this paper we focus on real-time multimedia related tasks execution by an MPU node. Our main aim is to find a model to predict processor utilization of a given computational node for a specific set of tasks realizing algorithms processing multimedia streams. Such model was necessary to implement the KASKADA platform (Polish abbreviation of Context Analysis of Camera Data Streams for Alert Defining Applications) built and utilized within the MAYDAY EURO 2012 project realized in Academic Computer Centre (TASK) of Gdansk University of Technology [1]. 1
The work was realized as a part of MAYDAY EURO 2012 project, Operational Program Innovative Economy 2007--2013, Priority 2 „Infrastructure area R&D”.
RAM
Cache L2
Cache L1
MPUs r1
2.3GHz
2.3GHz
r2 r3
667MHz
r4
r5 2.3GHz
2.3GHz
r6 r7 r8
Fig. 1. A typical architecture of a computation node.
1.1
Motivation
Multimedia processing is an essential part of the KASKADA platform, a soft realtime system dedicated for development and execution of the stream analysis algorithms, implemented as computation tasks and exposed to the user applications through web services. The main mechanisms and architecture of the platform including its main software and hardware components were described in [2, 3]. The platform places only one stream type per node, where the stream type is defined by the same frequency and bandwidth of the processed streams. In such a case, i.e. for streams with the same frequency, the theoretical utilization bound is 100%, even for the hard real-time constraints, where any data loss is unacceptable [4]. Moreover the total processor utilization for a node with a set of tasks executed concurrently is expected to be the sum of their processor utilizations, measured for each of them when running on the same node exclusively. Thus the task allocation on the particular nodes in the whole cluster is assumed to be performed according to a specific heuristic solving the bin packing problem [5], based on the Best-Fit-Descending algorithm, to deal with variable sizes of the executed tasks and finite number of available computational nodes [6]. Initial utilization and output data loss measurements showed a non-linear increase of processor utilization for increasing task number. Moreover, for high node’s processors utilization the amount of output data differed significantly. For such a case we found a lot of data stream elements missing, and the data loss depended on the stream type, task algorithm complexity and tasks number. This behavior seems to be caused by higher RAM-to-cache data exchange, when more tasks are executed concurrently. The solution for the above problem should fulfill the following assumptions:
it concerns a specific algorithm class, covering our main interests including typical multimedia stream processing, it reflects the given environment – use of the computation cluster environment, with a typical hardware (MPUs) and operating system (Linux), only a low effort for initial algorithm implementation tests can be accepted, a priori information about a newly introduced processing algorithm should be as minimal as possible, it takes under consideration the currently used stream types: HD, PAL and AUDIO as well as should be appropriate for streamless algorithms. 1.2
Related works
The processor utilization is one of the key features in real-time systems’ analysis. There are myriads of publications dealing with its upper bound, e.g. [7, 4], related to scheduler heuristics and parallel processing constraints [8, 9]. However, all of them consider task utilization being simply additive without taking into account the memory bandwidth influence, which is not the case as we could notice non-linearity in its increase. On the other hand, analysis of memory (RAM) falling behind the processors (including its cache memory) with the faster and faster clock speeds causes the occurrence of the so-called ‘memory wall’ [10]. It can be especially laborious for tasks processing massive streams of data, e.g. uncompressed multimedia content. The idea of performance modeling and prediction including memory bandwidth is proposed in [11]. The procedure consists of the following steps: 1) benchmarking the machine, 2) collecting application characteristics, 3) system tuning and 4) application improvement. The specific set of tools was developed to support the steps, however the procedure needed to be executed manually. In [12] a genetic algorithm extending the above approach was proposed. It enables automatic memory bandwidth modeling, which enables the prediction of the performance of an HPC application. The idea of the algorithm is to teach the bandwidth as a function of cache hit rates with the MultiMAPS benchmark as the fitness test. An interesting model combining memory bandwidth and computational power of a processor was proposed by Williams et al. in [13]. They introduced additional application performance metric called “operational intensity”, which indicates the number of floating point operations per one byte read from RAM memory (in FLOPS/byte). Thus, for the benchmarked application and the given MPU, the maximum used computational power can be predicted. Alas, the above models are only useful for memory traffic prediction in the case of executing one application per one or more nodes. Hence we need to provide our own approach dealing with multiple independent tasks executed concurrently on the same node.
1.3
Contribution
Our contributions described in this article are summarized below: a definition of the multimedia stream processing algorithm class (section 2.1), an evaluation of the Intel Xeon E5345 processor for execution of sets of tasks realizing the algorithms belonging to the described class (section 3), a formula for prediction of processor utilization for the computational node by the tasks realizing algorithms of the defined class, depending solely on the specific hardware and stream type, but not on a specific algorithm (section 4.1). The next section describes the considered algorithm class, providing its definition and proposing implementation details. The third section presents the evaluation experiments including a description of the test procedure and environment, benchmark algorithms and the results. The fourth section provides our estimation of processor utilization with the proposed formula, correction function and its empirical verification. The last section provides final remarks containing the conclusions and future works.
2 2.1
The class of multimedia processing algorithms The definition
In our considerations we assume a specific algorithm class. All tasks processing the streams are going to work according to the control-flow diagram presented in Fig. 2. In general an algorithm works in a loop which consists of the following steps: reception of an input data element – a chunk of data, e.g. a video frame or a bunch of audio samples, is received, unmarshaled and placed in the RAM memory, these actions require intensive RAM-to-cache communication, processing of the element – only this step depends on the specific algorithm, we assume that the computations are performed here, sending the processed element – the processed element is marshaled and sent to its destination, i.e. the next task in the pipeline or a streaming server providing the results to the user. The above loop is preceded and followed by standard steps, executed only once during the processing lifetime: initialization of communication, when the connections to the input and output data streams are established and appropriate resources are allocated, finalization of communication, when the connections to the input and output data streams are closed, and related resources are released. Our assumption is that a typical task for a specific stream type has a constant part of communication between processor, RAM and cache memory (RAM-to-cache), see Fig. 3. For this concern the typical algorithm should avoid memory copying and memory allocation for large objects, because it can significantly affect the node’s processors utilization.
Start Depending on the concrete algorithm, no RAM-to-cache operations should be executed in this step.
Init of input and output streams
elements of the input stream
Receive a source data element
Process the element
elements of the output stream
Send the processed element
Finalize the algorithm?
No
Yes Close the input and output streams
Stop
Fig. 2. A control flow diagram of the multimedia stream processing algorithm class.
2.2
The implementation
Algorithms of the described class are developed and executed in the multimedia processing system called the KASKADA platform. The platform is a middleware solution facilitating heavy multimedia processing in a supercomputer environment. It wraps the tasks implementing the algorithms into the webservices, supporting SOAP and ActiveMQ protocols [2]. MPU
Input stream elements
RAM
Output stream elements
Processing
Fig. 3. Stream elements flow in the computational node.
The described class is very broad and can be used for many types of multimedia analysis and processing, e.g. face recognition, background mask, crowd measurements, etc. However all these algorithms are built according to the same template and perform similar tasks. Moreover, the algorithms managed by the
platform need to behave according to certain rules in order to keep stable environment for other executed computational tasks. KASKADA framework is such a template. It is a C++ library with the classes and methods to support multimedia algorithms. Its main functionality covers audio/video stream decoding and encoding, C++ object serialization and inter-algorithm delivery, multimedia streams handling, dynamic tasks launching and basic life-cycle management support.
3 3.1
Evaluation experiments Benchmarks algorithms, procedure and environment
We can perceive a single node as a computer containing two Intel Xeon E5345 processors with four processing cores each (P=8), 8GB of operational memory, an InfiniBand 20Gb/s network interface, and a small 165GB hard disk. The node works under a Debian Linux ver. 2.6.22.19 operating system. The typical processing for the KASKADA platform copes with multimedia streams analysis and modification. The set of tasks, implementing the algorithms of the specified class (see sec. 2.1), used for the evaluations including the following executables: relayer – an implementation of an empty algorithm, forwarding the incoming input stream to the output, without any processing; clock – an implementation of a simple algorithm receiving a video stream, tagging it with the current time and passing the results as the output stream; face detector – an implementation of an algorithm recognizing faces in the incoming video stream every n-th frame and drawing a frame around the detected object, the marked images are transmitted as the output stream; implemented using the Viola-Jones object detection framework [14]; contours detection – an implementation of an algorithm detecting contours on a video frame and drawing it on the image; implemented using Canny contour detection algorithm [15]; video merger – an implementation of an algorithm merging two low resolution video streams into one, scaling its size and forwarding it to the output. The above algorithms were implemented with support of the OpenCV library, which is the de facto standard for image analysis and modification [16]. Table 1 presents combinations of the above algorithms with the available data streams. For the given node only algorithms with low complexity can be used for video HD streams, otherwise the data loss is too high to be accepted by the user. PAL testing video stream’s resolution was 704x576px and its frame rate – 20fps. Stream denoted by HD has resolution 1920x1080px and 30fps frame rate. During the experiments we decided to record the following metrics: processor utilization – reflecting performance of the node, the high utilization level means weaker performance of the analyzed algorithm,
output data loss – related to reliability, low loss of data elements in comparison to the ones generated by the algorithm means better reliability. Table 1. The considered task configurations. Task Configuration
Computation Complexity
Relayer Clock Face detection every 32nd frame Face detection every 16th frame Face detection every 4th frame Contours detection Video merger
None Low Medium Medium High Medium Medium
Tested video stream type PAL + + + + + + +
HD + + -
In Linux, the average utilization can be easily measured using system standard tools like top or ps. The output data loss depends on the specific task algorithm and is determined by counting the number of the output data stream elements. The other measurements cover such factors like network load and memory usage.
start
new task configuration [have more tasks]
stop
[no more tasks]
[no data loss]
n := n+1
measurements
Fig. 4. The measurement procedure.
We arbitrarily assume the output data loss to be acceptable as long as it is 1% or lower. Therefore our measuring procedure, presented in Fig. 4, iterates through the increasing stream number n=1, 2… until the data loss is above the threshold, when the next task configuration is executed, or the whole procedure ends. Table 1 shows the task configurations prepared for the scalability tests. Note that at any given moment, only one task configuration is tested against multiple data streams. The infrastructure used for the speedup measurements is presented in Fig. 5. The source streams archived in the mass storage are read by the decoding nodes, unpacked and transferred to the tested node, where the tasks are executed according to the assumed configuration (Table 1) and the measurements are performed. Afterwards, the processed streams are forwarded to the encoding nodes, packed and stored. Finally, the archived streams are checked for data loss.
decoding nodes measurements
tested node
encoding nodes
source streams
processed streams data loss check
Fig. 5. The considered cluster infrastructure for single node evaluation.
3.2
The experimental results
The results of the experiments are summarized in Table 2. In accordance with the assumed configurations (Table 1), 7 configurations processing PAL streams and 2 configurations processing HD streams were tested. The HD configurations could be executed only exclusively on the node, i.e. more than 1 HD task on 1 node causes unacceptable (over 1%) output data loss. For PAL configurations, there is a possibility to execute more tasks on a single node, however the increase of the measured utilization is disproportional to the number of the deployed tasks, e.g. a Relayer task utilizes 0.68% of the node MPUs, working exclusively on the node and the same task utilizes 2.38% of the node MPUs with other tasks working concurrently. Table 2. The results of the experiments. ɣ – utilization of the node for 1 task exclusively, nmax – the maximum task number on the node with low data loss (≤1%), ɣmax – utilization of the node for maximal number of tasks, ɣmax/nmax – utilization per 1 task for the maximal number of tasks. Task Configuration Relayer (PAL) Clock (PAL) Face detection every 32nd frame (PAL) Face detection every 16th frame (PAL) Face detection every 4th frame (PAL) Video merger (PAL) Contours detection (PAL) Relayer (HD) Clock (HD)
ɣ
nmax
ɣmax
ɣmax/nmax
0.68% 1.87%
20 14
47.55% 48.19%
2.38% 3.44%
7.55%
10
89.59%
8.96%
8.77%
8
81.00%
10.13%
28.65%
3
92.86%
30.95%
4.15%
9
68.99%
7.67%
5.05%
11
99.22%
9.02%
9.48% 14.87%
1 1
9.48% 14.87%
9.48% 14.87%
The PAL results are presented in a chart form in Fig. 6. It is characteristic that the non-linearity is less visible for more complex algorithms, where the computations are
more intensive. This observation leads us to the possible estimation formula for node utilization prediction.
100%
processor utilization on node
80% Relayer
60%
Clock
40%
Edge detection Face detection every 16th frame
20% 0% 0
5
10
15
20
25
task number
Fig. 6. The visualization of the experiments results for tasks processing PAL streams.
4 4.1
Estimation for utilization The formula of the estimated utilization
Let’s assume that a set of tasks executed on a computation node c of a homogenous cluster C is denoted by T, an i-th element (task) of this set is described as follow: ti=(ai, SIi, SOi, ɣi)
(1)
where ai is the task algorithm, SIi is the set of input streams, SOi is the set of output streams and ɣi is the load which the ti causes on the computation node, being executed exclusively. Having a constant RAM-to-cache part of an algorithm, we argue that the increase of the node MPUs utilization is different for every additional stream processing task started at the node, even if it utilizes the same algorithm and data. Moreover, the increase depends on the number of concurrently processed streams at the node, i.e. the utilization is estimated according to the following equation: (
)
(∑
)∑
(2)
where the ηh is so-called correction function, representing a deviation from the linear utilization increase. The experimental results show the increase of the node utilization by a task in case it is executed concurrently with other tasks. However, this observation is visible for
PAL configurations only. All tasks processing HD stream could be executed only exclusively on a node. Any attempt to start even only 2 tasks of the simplest algorithm caused unacceptable level of output data loss (>1%). The correction function can be determined using the equation (3) – transformed formula (2): ( )
(
)
(3)
where ηpal is the correction function, ɣ(c, Tn) is the measured utilization for a given cluster node c and a set of n tasks: Tn={t1=t, t2=t, … tn=t} and t=(a, {si}, {so}, ɣ), where a is the measured algorithm, having a PAL input stream si and PAL output stream so, and ɣ is the load which t causes on the computation node c, being executed exclusively. According to the formula(2), we can use the measured utilization of an arbitrary chosen task configuration, however we can notice the higher influence of external factors like the node operating system or network traffic in the case of lower measures. Thus for low task numbers we decided to use more complex algorithms: face detection every 32nd and 16th frame, and for higher task numbers: relayer and clock. Fig. 7. presents the correction function chart. It shows that up to 6 processed streams, the utilization increase is almost linear (~1.0), but afterwards it grows in a much faster pace. 4,00
ηpal(n)
3,50 3,00 2,50 2,00 1,50 1,00 0,50 0,00 0
5
10
15
20
n
Fig. 7. The correction function chart.
4.2
Verification of the estimation formula
To confirm the determined function we used the three measured algorithms: face detection every 4th frame, video streams merging and contours detection in the video stream. The results of the verification are presented in Fig. 8. We can observe that the predicted utilization is close to the real one, measured in the experiments, and the calculated square of Pearson correlation coefficient (R2) values are over 0.95. The best results were achieved for lower tasks numbers (12 and less for video merger and 10 and less for contours detector). Face detector’s maximum number of tasks was
predicted correctly, in the video merger algorithm case tasks number was underestimated by 1 and number of contours detection tasks was overestimated by 1.
5
Final remarks
We proposed a new method for prediction of node MPUs utilization for a specific class of algorithms. The presented experiment results show that the method is correct for the tested hardware and the given implementation. It was used for allocation purposes within a cluster environment – the KASKADA platform. 100%processors utilization on node 80%
measured load estimated load
60% 40% 20%
R2 = 0,956465
0% 0 100%
1
2
3
4 number of streams
processors utilization on node
80% 60%
measured load estimated load
40% 20% 0%
R2 = 0,995086 0
5
10
15
20
number of streams
100% processors utilization on node 80% 60%
measured load estimated load
40% 20% 0%
R2 = 0,96819 0
1
2
3
4
5
6
7
8
9
10 11 12
number of streams
Fig. 8. Node utilization generated by tasks: face detection every 16 th frame, video merger, contours detection( respectively).
The future works are going to be focused on the verification of the method in more advanced hardware/system environment and more efficient, optimized implementation of the framework for implementing algorithms. Furthermore, we plan to introduce direct hardware monitoring for memory bandwidth, enabling direct control of the memory traffic between MPUs and RAM.
References 1. 2. 3. 4. 5. 6. 7. 8. 9. 10. 11. 12. 13. 14. 15. 16.
Academic Computer Centre in Gdansk – TASK, http://www.task.gda.pl Krawczyk H., Knopa R., Proficz J.: Basic management strategies on KASKADA platform. EUROCON (2011) Krawczyk H., Proficz J.: Real-Time Multimedia Stream Data Processing. In: Supercomputer Environment, Interactive Multimedia, InTech, pp. 289--312 (2012) Deji Chen, Mok A. K., Tei-Wei Kuo: Utilization bound revisited. In: IEEE Transactions on Computers, vol. 52(3), pp. 351--361 (2003) Garey M. R., Johnson D. S.: Computers and Intractability: A Guide to the Theory of NP-Completeness. In: Series of Books in the Mathematical Sciences, W. H. Freeman (1979) Krawczyk H., Proficz J.: The task graph assignment for KASKADA platform. Proceedings of the International Conference on Software and Data Technologies, ICSOFT (2010) Liu C. L., Layland J. W.: Scheduling Algorithms for Multiprogramming in a Hard Real-Time Environment. In: Journal of the Association for Computing Machinery, vol. 20(1), pp. 46--61 (1973) Lopez J. M., Diaz J. L., Garcia D. F.: Utilization bounds for EDF Scheduling on Real-Time Multiprocessor Systems. In: Real-Time Systems, vol. 28(1), pp. 39--68 (2004) Qi X., Zhu D., Aydin H.: Cluster scheduling for real-time systems: utilization bounds and run-time overhead. In: Real-Time Systems, vol. 47(3), pp. 253--284 (2011) Wulf Wm. A., McKee Sally A.: Hitting the Memory Wall: Implications of the Obvious. In: ACM SIGARCH Computer Architecture News, vol. 23(1), pp. 20--24 (1995) Snavely A., Carrington L., Wolter N., Labarta J., Badia R., Purkayastha A.: A Framework for Application Performance Modeling and Prediction. Baltimore MD (2002) Tikir M., Carrington L., Strohmaier E., Snavely A.: A Genetic Algorithms Approach to Modeling the Performance of Memory-bound Computations. Proceedings of SC07, Reno, NV (2007) Williams S., Waterman A., Patterson D.: Roofilne: an insightful visual performance model for multicore architectures. In: Communications of the ACM, vol. 52(4), pp. 65--76 (2009) Viola P., Jones M.: Robust Real-time Object Detection. International Journal of Computer Vision (2001) Canny J.: A Computational Approach To Edge Detection. In: IEEE Trans. Pattern Analysis and Machine Intelligence, vol. 8(6), pp. 679--698 (1986) Pulli K., Baksheev A., Kornyakov K., Eruhimov V.: Real-time computer vision with OpenCV. In: Communications of the ACM, vol. 55(6), pp. 61--69 (2012)