Journal of Agricultural Science; Vol. 11, No. 2; 2019 ISSN 1916-9752 E-ISSN 1916-9760 Published by Canadian Center of Science and Education
Performance Assessment of a Variable-Rate Fertilizer Applicator Ruixiu Sui1 1
United States Department of Agriculture, Agricultural Research Service, Crop Production Systems Research Unit, Stoneville, Mississippi, USA Correspondence: Ruixiu Sui, United States Department of Agriculture, Agricultural Research Service, Crop Production Systems Research Unit, Stoneville, Mississippi, USA. Tel: 1-662-686-5382. E-mail:
[email protected] Received: September 10, 2018 doi:10.5539/jas.v11n2p25
Accepted: November 17, 2018
Online Published: January 15, 2019
URL: https://doi.org/10.5539/jas.v11n2p25
Abstract The objective of this study was to test the performance of a Field-IQ sprayer control system which was interfaced with a John Deere liquid fertilizer applicator. The sprayer control system includes Case IH FM-1000 display integrated with DGPS, Field-IQ spray control with full harness, flowmeter and auto-range valve, and the pump. Tap water was used to simulate the UAN 32% nitrogen fertilizer solution in the test. A total of 120 samples from 8 rows of the applicator in 5 application rates (34, 67, 101, 135, and 168 kg/ha) were collected, and the data were analyzed for application uniformity and application rate accuracy of the system. Results showed the greatest variation from the application rate baseline among the rows was 10.1% and occurred at a swath-end row with the lowest application rate of 34 kg/ha. The rows in the middle section of the swath had the lower variation than the rows at the two swath-ends. The application uniformity increased as the application rate increased. The absolute error of application rate ranged from 1.3% to 6.5% with an average of 3.76%. There was no significant difference between the selected application rate and actual application rate (p > 0.8686). Keywords: variable rate application, liquid fertilizer applicator, control system, precision agriculture 1. Introduction Precision agriculture is the use of detailed information within agricultural fields to optimize production inputs on a spatially variable basis, rather than to apply uniform applications across the entire field. It allows producers to apply appropriate amounts of production inputs on each location in the field. This can not only maximize farm profit, but also minimize environmental impact. Variable rate technology (VRT) plays an important role in precision agriculture. It involves the use of site-specific information in applying a desired rate of an agricultural input such as fertilizer at a specific site within a field. This practice demands accurate, reliable, and high-resolution VRT equipment to physically apply the materials in agricultural production. Use of nitrogen (N) fertilizer is one of the greatest cost inputs in crop production (Anonymous, 2018). Crop responses to N often varies spatially and temporally within a field (Vetch et al., 1995; Raun & Johnson, 1999). Management practice of variable rate application (VRA) of N, which applies N site-specifically based on the crop needs, could generate economic benefit for producers and create positive environmental impacts (Yang et al., 2000; Koch et al., 2004; Saleem et al., 2013a; 2013b). A fertilizer applicator usually equipped with a VRA controller and relevant software, and a GPS receiver. The GPS receiver determines the location of the applicator in the field. Based on the spatial information from the GPS and the data from the prescription map, the VRA controller generates electrical signal to control a mechanical actuator to apply fertilizer at a desired rate to that specific location in the field. For example, VRA liquid fertilizer applicators use servo valves, flow meters, and speed sensors to directly control the flow of the liquid fertilizer to achieve a desired application rate. As the applicator moves across the field, the VRA controller is constantly updated with the applicator location information provided by the GPS receiver and desired application rate at the location, and then adjusts the flow rate of the liquid fertilizer to match the desired rate by controlling the servo valve opening based on the inputs from the speed sensor and flow meter and the swath width of the applicator (Yang, 2000; Grisso et al., 2011).
25
jas.ccsenet.org
Journal of A Agricultural Sciience
Vol. 11, No. 2; 2019
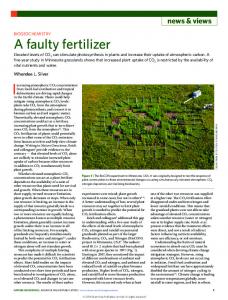
While VRT RT spray system ms have been ccommercially available, som me concerns abbout system peerformance rem main, such as noon-uniformity among nozzles and lack oof accuracy in application rrate. Schuellerr and Wang (1 1994) discussed some issues inn spatially-variiable control oof fertilizer appplication. Theyy concluded thhat the dynamiics of the spatially-variable appplicator affected its perfoormance and command feeedforward conntrol improved d the performannce of the appllicators. Fultonn et al. (2001) assessed the aaccuracy of a vvariable-rate ffertilizer applic cator. They usedd a matrix of coollection pans to gather the m material spreadd by a spinner spreader truckk and characterized the applicaation variabilitty of the spreadder. They founnd that there w was spread variaability with the spinner sprea aders, and the cooefficient of thee variations w were above 20% % for the averaage transverse spread patternns for both the 56.0 and 168.1 kg/ha uniforrm tests. Angllund and Ayeers (2003) testted the perforrmance of a gground spraye er for applying cchemicals at constant c and variable applicaation rates. Thhey observed tthat the controol system prov vided accurate aapplication ratee within ±2.255% of the dessired rate. Yanng (2000) asseessed the perfformance and field applicationn accuracy of a VRT side ddressing liquidd fertilizer appplicator. He repported that thee mean application errors for UAN 32% sollution and liquuid ammonium m phosphate 10-34-0 liquid fertilizers werre, respectively y, 2.5 and 5.2% iin one field tesst and 2.8 and 5.8% in the otther. The objective of this sttudy is to chaaracterize row--to-row uniforrmity and application rate aaccuracy of a VRT liquid fertiilizer applicatoor. 2. Materiaal and Method d 2.1 Variabble-Rate Fertiliizer Applicatorr A Field-IQ Q sprayer contrrol system (Caase IH, Racinee, Wisconsin) w was selected inn this study. T The system inclludes the Case IIH FM-1000 display d integraated with DGP PS, Field-IQ sspray control w with full harneess, flowmeterr and auto rangee valve, and thhe pump. The ssystem was intterfaced with tthe distribution plumbing prresent on the liquid fertilizer aapplicator. Thiss applicator deelivers liquid fe fertilizer below w the soil with coulter-mountted knife (Figu ure 1). Swath widdth of the appliicator is 7.72 m in 8 rows wiith a row spaciing of 96.5 cm m (38 in). The FM-11000 display, which consissts of both sooftware and hhardware, is aan advanced, full-featured field managemeent system with w an integraated GPS/GLO ONASS receiiver for preciision farming applications. The software rruns on a 30 cm c touch-senssitive, color LC CD screen. Thhe FM-1000 ddisplay is com mpatible with many m products fo for automated steering, s includding AutoPilott, EZ-Pilot, EZ Z-Steer, Field IIQ, True Guidee, True Trackerr.
Figure 11. Field-IQ sprrayer control syystem installedd on a liquid feertilizer appliccator with the F FM-1000 displlay insiide the cabin D Analysis 2.2 Test Prrocedure and Data After instaallation of the spray control system, the floows at each roow was measurred to evaluatee if the system m was correctly ddelivering thee liquid fertilizzer at the flow w rate set in the FM-10000 display. To accomplish th his, a simulated groundspeed of o 11.3 km/h (77 mph) was seet as the test sppeed. Applicatiion rates of 344, 67, 101, 135, and 168 kg/ha (30, 60, 90, 120, 1 and 150 llb/ac) were ussed in the test.. Each applicaation rate was randomly repe eated three time. To easily collect the effluennt samples, thee tube to the coulter-mounted knife was diisconnected at each
26
jas.ccsenet.org
Journal of A Agricultural Sciience
Vol. 11, No. 2; 2019
row, and a container waas used to catch the effluennt from the tubbe (Figure 2). In every rounnd of sampling, an applicator was set at a raandomly selectted applicationn rate, activateed and allowedd to come to steeady-state for three minutes. T Then the effluuent for each knife (row) w was collected ffor 60 secondds as one effluuent sample. Eight E samples w were obtained for f 8 rows in oone round of sampling. Withh 5 applicationn rates and threee replications, 120 total sampples were takenn in this studyy. The effluentt samples weree weighed usiing a HD-150 scale (My We eight, Phoenix, A AZ), and their volumes weree calculated ussing their weigghts and the efffluent density using the equ uation below: V Volume =
Weigght Densiity
(1)
mine the flow rrate Figure 2.. The effluent ffrom the knifee tube was colleected to determ In this stuudy, tap water was used as thhe effluent to simulate the lliquid fertilizerr UAN 32% S Solution. The UAN U 32% Soluttion was a nitrrogen fertilizerr solution com mposed of ureaa and ammoniuum nitrate. It w was widely used in U.S. One lliter of UAN 32% 3 Solution ccontains 424 g of nitrogen (N N). The swathh width, test sppeed, and samppling time werre used to calcculate the appllication area dduring the samp pling time. Effluuent volume and a N content of the UAN 332% Solution was used to ddetermine the total amount of N applied duuring the samplling time. Thenn the measuredd application rrate was obtainned by dividingg the total N by the applicationn area and com mpared to the application raate which was set in the FM1000 display ffor application n rate accuracy oof the control system. The fllow rate at row w was calculatted for determ mination of appplication uniforrmity along the eentire swath. 3. Results and Discussion Figure 3 shhowed the resuults of the unifformity tests foor all applicatiion rates. Eachh application raate was tested three times to yield three repllications. Amoounts of efflueent in the threee replications w were averagedd for each row w, and the mean oof these valuess in the 8 rows was used as baseline to coompute the devviations shownn in Figure 3. They were exprressed as perccent error relaative to the m mean of all row ws for a giveen application rate. The gre eatest variation from the application rate bbaseline amonng the rows was 10.1% aand occurred at row-1 with h the applicationn rate of 34 kgg/ha. In generral, the rows inn the middle ssection of the swath (row 3,, 4, 5) had a lower variation thhan the rows at a the two endss.
27
jas.ccsenet.org
Journal of A Agricultural Sciience
Vol. 11, No. 2; 2019
Figuure 3. Absolutee flow rate varriation of each row at all application rates e is a Figure 4 sshowed the chhange of the abbsolute variatiion with the appplication ratee. It was obserrved that there trend that the variation of flow rate ddecreases as thhe application rate increasess. Greater application uniforrmity could be aachieved using higher applicaation rate. The sum oof the effluent amounts of 8 rrows was calculated at a givven applicationn rate, and the total effluent value v was used tto determine thhe actual appllication rate. F Figure 5 illustrated the measuured applicatioon rates along with the applicaation rates seleected in the FM M-1000 displaay. Minimum aabsolute error of the applicattion rate is 1.3 3% at the rate off 34 kg/ha whiile the maximuum absolute errror of 6.5% occcurred at the rates of 67 kgg/ha and 168 kg/ha. k The averagge absolute errror of applicaation rate was 3.76%. Exceppt at 135 kg/haa, the actual appplication rate es are lower thann the selected rates r (Table 1).. These could ppossibly be cauused by the fraaction loss of tthe effluent. The ideal flow rate and actual mean fllow rate at an application raate selected weere given in Taable 1. An AN NOVA analysis off the flow rates was perform med using SAS software (SAS S Institute Inc.., Cary, NC). T The result indic cated that there iis no significannt difference bbetween the ideeal rates and thhe actual rates (p > 0.8686).
Figure 44. Results indiccated the variattion of flow raate across the sswath width off the applicatorr decreased as the increase oof application rate
28
jas.ccsenet.org
Journal of A Agricultural Sciience
Vol. 11, No. 2; 2019
Figure 5. C Comparison off the set appliccation rate in thhe FM1000 dissplay to the acctual applicatioon rate measured in the test Table 1. A Accuracy of appplication rate oof the spray control system Selected A Appl. Rate (kg/ha)
Ideal Row Flow w Rate (l/min)
Actuaal Row Flow Ratee (l/min n)
Actual Appl. Rate (kg/ha)
App plication Rate Er rror (%))
34
1.44
1.42
33.2
-1.33
67
2.87
2.69
62.9
-6.55
101
4.31
4.21
98.6
-2.22
135
5.75
5.88
137.7
2.3
168
7.18
6.71
157.2
-6.55
4. Summaary A Liquid fertilizer appplicator equippped with a Fiield-IQ sprayeer control sysstem was testted for application uniformityy and accuracyy of applicatioon rate. The aapplicator hadd eight rows w with a swath w width of 7.7 m. m A coulter-moounted knife was w used to deliver liquid ffertilizer at eaach row. The aapplication ratte was change ed by adjusting tthe effluent floow rate at eacch row. Duringg the test, tap water was useed as the effluuent to simulate the UAN 32% % nitrogen ferttilizer solutionn. Effluent sam mples for each row were colllected at appliication rate 34 4, 67, 101, 135, aand 168 kg/haa, respectively. The samples w were weighed, and their weiight values weere analyzed to o find the applicaation uniformitty and the appplication rate acccuracy. Resullts showed thaat the rows in m middle of the swath s had a loweer flow rate vaariation than thhe rows at the two swath-endds. The application uniformiity increased as a the applicationn rate increaseed. The absoluute error of appplication rate ranged from 11.3% to 6.5% with an averag ge of 3.76%. Thhere was no siggnificant differrence between the selected appplication ratees and actual appplication rates. The uniforrmity and acccuracy of the V VRT equipmennt used in preecision agricullture should be considered when w prescriptioons are writtenn, or managem ment zones arre developed. It would not make much ssense to write high resolution prescriptions for precision m management w when the VRT equipment is incapable of aaccommodating the same levell of accuracy. The variable rrate applicator tested in this study has beenn used in the rresearch of varriable rate N appplication for several s years. In general, tthis control syystem could pprovide the appplication accu uracy required inn our research. Disclaimeer Mention oof a trade namee, proprietary pproduct, or specific equipmeent does not coonstitute a guaarantee or warranty by the U. S S. Departmentt of Agriculturee and does nott imply approvval of the produuct to the excluusion of otherss that may be avvailable. Referencees Anglund, E E. A., & Ayers, P. D. (2003)). Field evaluaation of responnse time for a vvariable rate (ppressure-based d and injecttion) liquid cheemical applicaator. Appl Eng A Agric, 19(3), 2273-282. https://doi.org/10.113031/2013.13659 29
jas.ccsenet.org
Journal of Agricultural Science
Vol. 11, No. 2; 2019
Anonymous. (2018). Guidelines for estimating crop production cost - 2018. Retrieved October 22, 2018, from https://www.gov.mb.ca/agriculture/farm-management/financial-management/pubs/cop-crop-production.pdf Fulton, J. P., Shearer, S. A., Chabra, G., & Higgins, S. F. (2001). Performance assessment and model development of a variable-rate spinner-disc fertilizer application. Trans ASABE, 44(5), 1071-1081. https://doi.org/10.13031/2013.6429 Koch, B., Khosla, R., Frasier, W. M., Westfall, D. G., & Inman, D. (2004). Economic feasibility of variable-rate nitrogen application utilizing site-specific management zones. Agron J., 96, 1572-1580. https://doi.org/ 10.2134/agronj2004.1572 Raun, W. R., & Johnson, G. V. (1999). Improving nitrogen use efficiency for cereal production. Agronomy Journal, 91, 357-363. https://doi.org/10.2134/agronj1999.00021962009100030001x Saleem, S. R., Zaman, Q. U., Schumann, A. W., Madani, A., Chang, Y. K., & Farooque, A. A. (2013a). Impact of variable rate fertilization on nutrient losses in surface runoff for wild blueberry fields. Appl Eng in Agric, 30(2), 179-185. Saleem, S. R., Zaman, Q. U., Schumann, A. W., Madani, A., Farooque, A., & Percival, D. C. (2013b). Impact of variable rate fertilization on subsurface water contamination in wild blueberry cropping system. Appl Eng Agric, 29(2), 225-232. https://doi.org/10.13031/2013.42653 Schueller, J. K., & Wang, M. (1994). Spatially-variable fertilizer and pesticide application with GPS and DGPS. Comput Electron Agr, 11, 69-83. https://doi.org/10.1016/0168-1699(94)90053-1 Vetch, J. A., Malzer, G. L., Robert, P. C., & Huggins, D. R. (1995). Nitrogen specific management by soil condition: Managing fertilizer Nitrogen in corn. In P. C. Robert, R. H. Rust, & W. E. Larson (Eds.), Site specific management for agricultural systems. Madison WI: ASA/CSSA/SSSA. Yang, C. (2000). A variable rate applicator for controlling rates of two liquid fertilizers. Appl Eng Agric, 17(3), 409-417. Yang, C., Everitt, J. H., & Bradford, J. M. (2000). Comparison of uniform and variable rate nitrogen and phosphorus fertilizer applications for grain sorghum. Trans ASABE, 44(2), 201-209. Copyrights Copyright for this article is retained by the author(s), with first publication rights granted to the journal. This is an open-access article distributed under the terms and conditions of the Creative Commons Attribution license (http://creativecommons.org/licenses/by/4.0/).
30