The efficiency and flexibility of using cloud computing for PBD of bridges is emphasized. ..... nonlinear time history analysis using parallel and cloud computing.
10NCEE
Tenth U.S. National Conference on Earthquake Engineering Frontiers of Earthquake Engineering July 21-25, 2014 Anchorage, Alaska
PERFORMANCE-BASED SEISMIC DESIGN OF BRIDGES USING HIGH PERFORMANCE COMPUTING TOOLS A. Bebamzadeh1, A. Rahmani2, M. Taiebat3, C. E. Ventura4, and W.D.L. Finn5 ABSTRACT This paper shows how the Performance-based Design (PBD) of bridges is facilitated by taking advantage of recent developments in parallel and cloud computing. In order to have a realistic assessment of the performance of a bridge subjected to severe ground shaking, sophisticated three-dimensional nonlinear dynamic structural and geotechnical analyses need to be performed, that account not only for the structural characteristics, but also the ground conditions, the type of earthquake motions and the soil-structure-interaction. The simulation of the nonlinear dynamic response of a bridge to various levels of earthquakes is a very challenging and tedious process, which requires significant computational capabilities. A viable and cost-effective option to overcome computational limitations in high intensive PBD of bridges and soil-structure interactions, is to adopt cloud and parallel computing techniques in the analysis. Elasticity of cloud services provides engineers a platform to add and remove pay-as-you-go compute resources to meet the size and time requirements commensurate with the size and type of the bridge model being analyzed. This paper shows how the significant reduction in the time required to process a suite of ground motions for PBD, and the flexibility of cloud computing in assigning tasks to different processor, allow bridge engineers to perform various types of sophisticated nonlinear analyses in parallel. A case study to illustrate how the incremental dynamic analysis of a three-dimensional bridge with soil-structure interaction using parallel computing in clouds is presented and discussed. The efficiency and flexibility of using cloud computing for PBD of bridges is emphasized.
1
Postdoctoral Fellow, Dept. of Civil Engineering, University of British Columbia, Vancouver, BC V6T 1Z4 Graduate Student Researcher, Dept. of Civil Engineering, University of British Columbia, Vancouver, BC V6T 1Z4 3 Assistant Professor, Dept. of Civil Engineering, University of British Columbia, Vancouver, BC V6T 1Z4 4 Professor, Dept. of Civil Engineering, University of British Columbia, Vancouver, BC V6T 1Z4 5 Professors Emeriti, Dept. of Civil Engineering, University of British Columbia, Vancouver, BC V6T 1Z4 2
Bebamzadeh A, Rahmani A, Taiebat M, Ventura CE, and WDL Finn. Performance-based seismic design of bridges using high performance computing tools. Proceedings of the 10th National Conference in Earthquake Engineering, Earthquake Engineering Research Institute, Anchorage, AK, 2014.
10NCEE
Tenth U.S. National Conference on Earthquake Engineering Frontiers of Earthquake Engineering July 21-25, 2014 Anchorage, Alaska
Performance-based Seismic Design of Bridges Using High Performance Computing Tools A. Bebamzadeh1, A. Rahmani2, M. Taiebat3, C. E. Ventura4, and W.D.L. Finn5
ABSTRACT This paper shows how the Performance-based Design (PBD) of bridges is facilitated by taking advantage of recent developments in parallel and cloud computing. In order to have a realistic assessment of the performance of a bridge subjected to severe ground shaking, sophisticated threedimensional nonlinear dynamic structural and geotechnical analyses need to be performed, that account not only for the structural characteristics, but also the ground conditions, the type of earthquake motions and the soil-structure-interaction. The simulation of the nonlinear dynamic response of a bridge to various levels of earthquakes is a very challenging and tedious process, which requires significant computational capabilities. A viable and cost-effective option to overcome computational limitations in high intensive PBD of bridges and soil-structure interactions, is to adopt cloud and parallel computing techniques in the analysis. Elasticity of cloud services provides engineers a platform to add and remove pay-as-you-go compute resources to meet the size and time requirements commensurate with the size and type of the bridge model being analyzed. This paper shows how the significant reduction in the time required to process a suite of ground motions for PBD, and the flexibility of cloud computing in assigning tasks to different processor, allow bridge engineers to perform various types of sophisticated nonlinear analyses in parallel. A case study to illustrate how the nonlinear dynamic analysis of a threedimensional bridge with soil-structure interaction using parallel computing in clouds is presented and discussed. The efficiency and flexibility of using cloud computing for PBD of bridges is emphasized.
Introduction Advances in performance-based design (PBD) methodologies and capacity design principles allow engineers a more direct, non-prescriptive, and rational approach to analysis and design of bridges and other structures. PBD requires a detailed investigation of how a bridge will likely perform during different types of earthquakes. The information obtained from this detailed investigation conducted as part of the PBD process helps engineers better understand the behavior of bridges to establish rational performance criteria for design. 1
Postdoctoral Fellow, Dept. of Civil Engineering, University of British Columbia, Vancouver, BC V6T 1Z4 Graduate Student Researcher, Dept. of Civil Engineering, University of British Columbia, Vancouver, BC V6T 1Z4 3 Assistant Professor, Dept. of Civil Engineering, University of British Columbia, Vancouver, BC V6T 1Z4 4 Professor, Dept. of Civil Engineering, University of British Columbia, Vancouver, BC V6T 1Z4 5 Professors Emeriti, Dept. of Civil Engineering, University of British Columbia, Vancouver, BC V6T 1Z4 2
Bebamzadeh A, Rahmani A, Taiebat M, Ventura CE, and WDL Finn. Performance-based seismic design of bridges using high performance computing tools. Proceedings of the 10th National Conference in Earthquake Engineering, Earthquake Engineering Research Institute, Anchorage, AK, 2014.
The California Department of Transportation (Caltrans) was the first state department of transportation to adopt performance-based design criteria. Caltrans [1] performance-based feature for design of bridges requires: 1. No-collapse during the Design Seismic Hazards (DSH). DSH is a 1000 year event with deterministic limits for ordinary bridges and 1000-2000 year event for important bridges. 2. Well-defined inelastic behavior where nonlinear actions and members are clearly defined and all other members are designed to be stronger than the elements designed to experience nonlinear behavior (Capacity Design Approach). The Oregon Department of Transportation (ODOT) developed the similar performance-based design approach with the addition of a serviceability check for a 500 year event. This additional check is required to maintain the serviceability of bridges in the event of a Cascadia Subduction Zone event. It is widely recognized that under a significant seismic event, the performance of bridges is strongly influenced by the interaction of the superstructure and the surrounding soil. In this event, the proper modeling assumptions made for nonlinear soil-structure-interaction is essential for the better prediction of the nonlinear dynamic response of the bridge. A well-developed three-dimensional (3D) full bridge model including the superstructure, foundation soils, pile foundations, and embankments provide the best tool to estimate the response at the various seismic demands, such as those specified above. However, large-scale simulations and data processing tasks that are needed to support the design can take an unreasonably long time to complete or require a lot of computer memory. Due to these limitations, in current practice, simplified models such as nonlinear springs are often used for soil-structure-interaction yet are challenging to define. One can expedite the large-scale simulations of bridges by taking advantage of High Performance Computing (HPC) resources, such as multicore computers, GPUs, computer clusters, and grid and cloud computing services. This paper illustrates how the nonlinear dynamic analysis of a full 3D bridge model is facilitated using HPC tools. The efficiency and flexibility of using parallel and cloud computing for PBD of bridges is presented and discussed. High Performance Computing Tools In modern engineering, HPC has become an essential tool for timely analysis and interpretation of large-scale physical simulations. HPC allows the aggregation of computer resources to address the computational requirements for complex simulations and extensive design variation analyses. Parallel programming plays a vital role in the development of HPC architecture. Recently parallel processing has become available in different structural and geochemical engineering software including OpenSees, SAP2000, ABAQUS, ANSYS, and FLAC [2-6].
Traditionally, HPC resources have been provided by multicore computers, clusters, and supercomputers. These services have large upfront cost and are usually difficult to maintain and operate. Additionally, users must wait in long queues to access shared clusters. By taking advantage of “cloud services”, engineers can expedite their HPC workloads. Cloud services provide a new model for HPC infrastructure comprising web-based access to a shared pool of configurable processing resources, storage resources, as well as applications [7]. Cloud services are elastic and scalable to accommodate the utilization needs of the user and are sold on demand with minimal interaction with the service provider [8]. Fig. 1a shows some of the key components of a cloud's infrastructure. Depending on the application cloud architecture may be relatively simple or extremely complex. As a minimum, a cloud should include a cloud manager and one or more compute-nodes. All requests for cloud resources will be made from a cloud web service to the cloud manager. Each compute-node comprises one or more clusters. The individual clusters may also control one or more nodes (Fig. 1b). Each node runs the virtualization technology and handles the actual processing on virtual machines (or virtual PCs).
(a)
(b)
Figure 1. (a) Cloud and (b) Cluster architectures. An example of a model of cloud services is NEEShub (http://nees.org). NEEShub is a platform for research, collaboration and education in earthquake engineering. NEEShub provides cloud based computing to earthquake researchers by giving them the capability of remotely running sophisticated applications as OpenSees [2]. OpenSees is an open source software that has been developed for simulating the seismic response of structural and geotechnical systems [2]. OpenSees is also available in two parallel
applications developed by McKenna and Fenves [9]. OpenSees parallel applications can be executed on clusters, grids, or clouds to provide a high performance computing platform useful for large models or extensive design variation analyses. Inclusion of sophisticated nonlinear structural and geotechnical models in OpenSees, in addition to parallel processing capabilities, provides engineers a robust platform for complex simulation such as soil-structure-interaction and bridge performance based design. Implementation of HPC Computing for PBD
Seismic PBD is an iterative process that requires sophisticated models to validate the performance of structure under a specific seismic demand. HPC tools benefiting from parallel processing and elastic cloud resources allow the designer to simultaneously execute detailed designs. The authors have implemented a methodology to take full advantage of highperformance parallel computing using the cloud architecture described above. The methodology has been implemented for various structural and geotechnical programs and used for the seismic analysis of buildings and bridges. For the case of buildings, a simple to use graphical interface has been developed to integrate the computer model with the input ground motions, and to load this information into the cloud manager shown in Fig. 1. At the present time the authors are using the compute-nodes of the Amazon EC2 Cloud Center [10]. Amazon EC2 is an infrastructure as a service which allows users to rent virtual computer calls an "instance" on which to run their own computer applications. The following case study illustrates the use of the parallel computing capabilities of OpenSees for the nonlinear time history analysis of a full 3D bridge model for a set of ground motions. The purpose of this example is not necessarily to examine the seismic performance of the bridge, but to illustrate the efficiency and flexibility of using cloud and parallel computing for PBD of bridges. Meloland Road Overpass Meloland Road Overpass (MRO) has been selected to demonstrate the methodology for nonlinear time history analysis using parallel and cloud computing. The MRO is a two-span integral abutment bridge constructed in 1971 and instrumented by the California Strong Motion Instrumentation Program (CSMIP) in 1978 with 26 sensors. Figure 2 shows the structural characteristics. The bridge deck has a length of 64.0 m, width of 10.0 m and depth of 1.7 m (Fig.2a). The reinforced concrete pier at the center of the deck is 5.0 m in height above a square concrete pile cap supported by 25 timber piles. Concrete box girder connected monolithically to the abutments with no deck joints and bearings as shown in Fig. 2. The abutments are supported by seven vertical timber piles. The site geology is classified as deep soft alluvium with Vs30 of 192 m/s [11]. The embankment soil material is composed of one layer of medium clay overlying five layers of clays and silty sands. The soil layering properties were reported by Maragakis et al. [12] and Kwon and Elnashai [13].
(a)
(b)
Figure 2. Description of Meloland Road Overpass, (a) overview, and (b) soil layers.
Finite Element Continuum Modeling In this study, a 3D model of the MRO developed by Rahmani et al. [14] in OpenSees is used. The model was originally developed to investigate the response of full bridge system including foundation soils, pile foundations, embankments, supporting columns, and the bridge structure using a 3D continuum nonlinear analysis. As shown in Fig. 3, all components of the bridge including the 5×5 and the 7×1 pile groups, the pier, the deck, the back walls, the wing walls, and the surrounding soil are modeled. The model has been modified to perform parallel non-linear analysis using the OpenSeesSP and OpenSeesMP platforms.
(a) Figure 3.
(b)
Finite element model of the MRO (a) full system, and (b) bridge structure [14].
The soil domain and the pile cap are modeled using solid eight-node brick elements. Four-node shell elements are used to model the back walls, wing walls, and bridge deck. The continuum model includes a total of 41,177 nodes, 3996 beam-column elements, 1931 shell elements, and 31,844 solid elements representing a soil domain of 99.0 m long (in direction x), 50.0 m wide (in direction y), and 20.0 m deep (in direction z). Fiber section beam-column elements are used to model the bridge pier and the piles. The connection of the pier to the pile cap and the deck are
modeled as rigid. A similar assumption is made for the connection of piles to the pile cap. The abutment walls and the deck are also rigidly connected in the model due to the integral type abutments of MRO. To connect the pile column elements to the surrounding solid soil brick elements, eight rigid beam-column elements are used to connect the pile and soil nodes horizontally at each elevation as shown in Fig. 3. Advanced nonlinear hysteretic models are used for constitutive modeling of the foundation soil. In particular, pressure dependent multi-yield [15] and pressure independent multi-yield [16] constitutive models are adopted for simulating sandy and clayey layers, respectively. The central pier is modeled using nonlinear constitutive models for confined and unconfined concrete as well as steel reinforcement. Because of capacity-protected design, elastic behavior is assigned to the timber piles, the concrete pile cap, the deck, and the abutment walls. The analysis of the bridge system is carried out in three phases. Phases one and two include static nonlinear analyses to obtain the initial states of stress and strain in the soil due to the weight of the soil and subsequently the weight of the bridge. In the last phase, the dynamic nonlinear analysis is performed to obtain the time histories of soil and structure responses when subjected to a seismic loading. Input Ground Motions Rahmani et al. [14] validated the period and response of the model with respect to those obtained from the bridge site during the 1979 Imperial Valley and 2010 El Mayor-Cucapah earthquakes. The predominant period of the continuum model including the structure and surrounding soil is 0.35 seconds, which is in good agreement with previous studies by Wilson and Tan [17] and Kwon and Elnashai [13]. Table 1.
Selected ground motions and scaling factors to design spectrum for the MRO. No. 1 2 3 4 5 6 7 8 9
Earthquake Name Loma Prieta Cape Mendocino Northridge-01 Kocaeli, Turkey Duzce, Turkey Cape Mendocino Kocaeli, Turkey
Imperial Valley El Mayor-Cucapah
Recording Station Saratoga - Aloha Petrolia Rinaldi Receiving Sta Izmit Duzce Cape Mendocino Yarimca Meloland Sta Meloland Sta
Scale Factor 2.5 1.8 1.2 3.6 1.5 1.2 2.9 3.0 4.6
The bridge model is subjected to nine actual earthquake events as listed in Table 1 including seven near fault records and two records at the bridge site. The input ground motions are linearly matched to the design spectrum recommended by Caltrans [1]. Caltrans ARS Online provides the DSH for the vicinity of the bridge which is based on the 5% in 50 years probabilistic event with deterministic limits. The seismic hazard de-aggregation using U.S. Geological Survey for the predominant period and soil condition of the bridge shows the contribution of near fault ground
motions in the design spectrum. The geo-mean of each ground motions is linearly scaled to the design spectrum in the period range of 0.2 to 0.5 seconds. Nonlinear Time History Analysis Using High Performance Computing Tools All non-linear analyses were performed using the memory cluster instances of the Amazon EC2 Cloud Center. Instances of this type provide proportionally high memory and CPU resources with 16 cores, and are well suited for memory-intensive analytics and HPC. Fig. 4 compares the CPU run time of the non-linear dynamic analysis of the bridge for the Imperial Valley ground motion record using parallel commuting with 1, 4, 8, 10, and 16 processors. The run time is reduced about five times using eight processors. However, there is no significant reduction in run time observed when using more than eight processors. This may be due to the complexity of the finite element model of the bridge and the order of parallel computation in the model.
Figure 4. Analysis execution time of MRO bridge model under the 1979 Imperial Valley earthquake using different number of processors. Fig. 5 shows the cost and execution time of the analyses for the set of nine ground motions using different numbers of processors. Nine ground motions can be executed simultaneously in parallel; therefore the execution time is limited by the longest ground motion. Due to this, the execution time for one ground motion (Fig. 4) remains the same as shown in Fig. 5 for a suit of nine ground motions. By using two Amazon EC2 units and assigning four processors for each ground motion, the cost is reduced by 40%. No significant cost reduction is observed by using three Amazon EC2 and running each ground motion with eight processors. However, by using five EC2 and assigning 16 processors for each ground motion, the total cost is increased due to the diminishing returns of analysis speedup.
Cloud cost and analysis execution time of MRO bridge model for a suit of nine ground motions using different number of processors.
100
Longitudinal
80
Transverse
60 40 20 0 0
0.5
1
Drift of pier (%)
1.5
2
Probability of exceedance (%)
Probability of exceedance (%)
Figure 5.
100
Longitudinal
80
Transverse
60 40 20 0 0
0.5
100
Longitudinal 80
Transverse
60
Plastic moment Mp=15.0(MN.m)
20 0 0
5
10
15
20
Maximum bending moment(MN.m)
(c)
1.5
2
(b)
25
Probability of exceedance (%)
Probability of exceedance (%)
(a)
40
1
Rocking of pile cap (%)
100
Longitudinal
80
Transverse
60 40 20 0 0
0.5
1
1.5
Drift of right abutment (%)
(d)
Figure 6. Probability of exceedance of (a) the drift of pier, (b) the rocking of the pile cap, (c) the moment induced at the pier base, and (d) the right abutment drift in both longitudinal and transverse directions for set of nine ground motions.
2
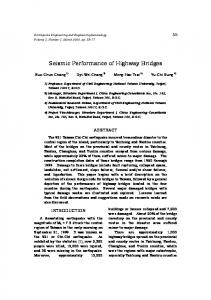
Figs. 6 and 7 are the representative results of nonlinear time history analysis of MRO for the set of selected nine ground motions. Figs. 6(a) and (b) show the probability of exceedance of the pier drift and the pile cap rocking in both longitudinal and transverse directions. The mean of pier drift is about 1% in both directions and the mean of the pile cap rocking is about 0.8%. This indicates that the mean pier flexural rotation is about 0.2% implying that the pier remains elastic. This is also confirmed by Fig. 6(c) showing that the mean of maximum bending moment in the pier is 10 MN.m and the probability of exceeding the yielding moment of pier is negligible. Fig 6(d) shows the abutment drift exceedance probability in both directions. The mean of the abutment drift in the longitudinal direction is about 0.8%, while it is 0.1% in the transverse direction. The small abutment drift values in the transverse direction are attributed to the large stiffness of the backwall and the wing walls.
-2
-2
-4
-4
-6
-6
-8
-8
Depth (m)
Depth (m)
Fig. 7 shows the bending moment envelopes along the pile foundations underlying the pier both in the longitudinal and transverse directions. It is observed that the maximum bending moments reach 35 kN.m in both directions. This small bending moment is due to the large translational and rotational stiffnesses of the embedded pile cap.
-10 -12
-10 -12
-14
-14
-16
-16
-18 0
5
10
15
20
25
30
35
Max. bending moment (kN.m)
(a) Figure 7.
40
-18 0
5
10
15
20
25
30
35
40
Max. bending moment (kN.m)
(b)
Bending moment envelopes for pile foundation underneath pier in the (a) longitudinal and (b) transvers directions.
Although the bridge structure remained mainly elastic during the selected nine ground motions, it was observed that the soil behavior in the vicinity of the bridge structure was highly nonlinear. The yielding and nonlinearity of the backwall soil resulted in large plastic deformations and large hysteretic loops, especially in the transverse direction.
Conclusions The example presented above clearly illustrates the advantages of using parallel computing for the dynamic nonlinear analysis of large scale soil-structure interaction problems such as those encountered in bridge engineering. The significant reduction in the time required to process a suite of ground motions, and the flexibility of cloud computing in assigning tasks to different processors, allow engineers to perform various types of analyses in parallel. Acknowledgements Support to conduct this study is provided by the Natural Sciences and Engineering Research Council of Canada (NSERC). The authors express their thanks to Dr. Farzad Naeim for providing support and encouragement to explore the use of cloud computing in structural engineering. References 1.
Caltrans. Seismic Design Criteria. California Department of Transportation; version 1.7, 2013.
2.
McKenna F and Fenves G. The OpenSees command language manual, Version 1.2. Pacific Earthquake Engineering Research Center, University of California, Berkeley, CA, http://opensees.berkeley.edu, 2001.
3.
Computers and Structures, Inc. (CSI). SAP2000: ver. 15. 2011.
4.
ABAQUS, Standard User’s Manual, Hibbit, Karlsson & Sorensen Inc., Rhode Island. ver. 6.13, 2013.
5.
ANSYS Incorporated, Programmer’s Manual for ANSYS, ver. 14.5, 2013.
6.
Itasca Consulting Group. FLAC-Fast Lagrangian Analysis of Continua, ver. 7.0 User’s Guide. Minneapolis, Minnesota, 2013.
7.
Haber, Lynn (2010), “The Building Blocks of Private Cloud,” SearchCloud Computing.com.
8.
Egwutuoha, I.P., Schragl, D., and Calvo, R., (2013), “A Brief Review of Cloud Computing, Challenges and Potential Solutions,” Parallel & Cloud Computing, Vol 2, Iss 1, January, p.7.
9.
McKenna F. and Fenves, G.L. (2007), Using the OpenSees Interpreter on Parallel Computers, http://opensees.berkeley.edu.
10. Amazon Web Service (AWS), http://aws.amazon.com/, accessed November 2013. 11. Center for Engineering Strong Motion Data, http://www.strongmotioncenter.org, accessed in October 2013. 12. Maragakis EA, Douglas BM and Abdel-Ghaffar SM. (1994), An equivalent linear finite element approach for the estimation of pile foundation stiffnesses. Earthquake engineering and structural dynamics, 23(10):1115– 1124. 13. Kwon OS and Elnashai AS. (2008), Seismic analysis of Meloland Road Overcrossing using multi- platform simulation software including SSI. Journal of Structural Engineering, ASCE, 134(4):651–660. 14. Rahmani, A. Taiebat, M. and Finn, W.D.L. (2014). "Nonlinear dynamic analysis of Meloland Road Overpass using three-dimensional continuum modeling approach." Soil Dynamics and Earthquake Engineering, 57, 121– 132. 15. Yang, Z. Elgamal, A. and Parra E. (2003), “Computational model for cyclic mobility and associated shear deformation”, Journal of Geotechnical and Geoenvironmental Engineering. 129(12), 1119–1127. 16. Gu Q. Conte JP, Yang Z, and Elgamal A (2011), “Consistent tangent moduli for multi-yield-surface J2 plasticity model”, Computational Mechanics, 48, 97–120. 17. Wilson JC and Tan BS. (1990), Bridge abutments: assessing their influence on earthquake response of Meloland Road Overpass. Journal of Engineering Mechanics, ASCE, 116(8):1838–1856.