The current issue and full text archive of this journal is available at www.emeraldinsight.com/0968-4883.htm
QAE 18,2
Performance-based service quality model: an empirical study on Japanese universities
126
Parves Sultan Central Queensland University, Rockhampton, Australia and
Ho Wong School of Commerce and Marketing, Central Queensland University, Rockhampton, Australia Abstract Purpose – This paper aims to develop and empirically test the performance-based higher education service quality model. Design/methodology/approach – The study develops 67-item instrument for measuring performance-based service quality with a particular focus on the higher education sector. Scale reliability is confirmed using the Cronbach’s alpha. The principle component analysis followed by a Varimax method is used to extract the factor loadings. Findings – The results are satisfactory in terms of factor analysis, reliability and validity tests. Based on the overall loaded items, the eight dimensions are named. They are dependability, effectiveness, capability, efficiency, competencies, assurance, unusual situation management, and semester and syllabus. Research limitations/implications – Although the empirical results are significant, a comparative study can identify relative strengths of this model. Practical implications – This study underlines some critical dimensions and related attributes on which the higher institutions should concentrate their efforts to improve quality. Originality/value – This study is worth doing because it takes samples from international students studying at Japanese universities. This study also attempts to develop a comprehensive approach for scale development in measuring service quality for higher education institutes. Keywords Japan, Universities, Higher education, Customer services quality Paper type Research paper
Introduction The notions of quality in higher education are originated from business practices (Srikanthan, 1999). Quality management in higher education has two core functions, service and education. In higher education, services are related to the general activities, for example, enrolment activities and amenities, for example, cafeterias and recreation. The teaching and learning services or education services are related to teaching, research and community services (see Srikanthan and Dalrymple (2002, 2003, 2005) for
Quality Assurance in Education Vol. 18 No. 2, 2010 pp. 126-143 q Emerald Group Publishing Limited 0968-4883 DOI 10.1108/09684881011035349
The authors are thankful primarily to the editor(s) and reviewers for their comments in preparing this study. The authors also extend gratitude to the respondents of this study, the Ritsumeikan Centre for Asia Pacific Studies for funding this research project and the Japan International Cooperation Agency for adequate support during stay at Japan. The authors are also thankful to Professor Dr Richard Berwick and Professor Dr Dipendra Sinha of the Ritsumeikan Asia Pacific University, Japan for their unanimous support.
more details). Therefore, the two core functions of higher education institutes, general service and education service, are the distinct differentiation strategies. As a result of commercial competition imposed by economic forces resulting from the development of global education markets and the reduction of government funds (Abdullah, 2006), higher education institutes are diverted from their core purposes. The reduction of government funding has led higher education institutes to seek other financial sources. One of the basic sources is the increased tuition fees, followed by a cut in the number and amount of scholarships and tuition fees waiver. The other sources include a reduction in the developmental budgets and attracting national and international students with aggressive promotional strategies. These issues have led higher education institutions to adapt marketing approaches to measure and improve quality of services. Studies find that the qualities and behaviour of academic staff have a significant impact on the students’ perceptions of high quality education (Guolla, 1999; Hill et al., 2003). Lecturers should possess sufficient communication and teaching skills and be able to choose the most suitable teaching method from a variety of teaching tools. Lecturers should be knowledgeable, enthusiastic, approachable, and friendly. They should put more emphasis on the vocational aspects of their studies than the academic aspects (Hill et al., 2003). Similarly, Administrative staff should be efficient and prompt in delivering support services, and providing adequate information. They should be proactive rather than reactive in delivering services (Sultan and Tarafder, 2007b). Therefore, students, lecturers and administrative staff are the key players in the higher education domain. They determine the quality scales based on the values of the society as a whole (see Bemowski, 1991; Ginsberg, 1991; Lawson, 1992 for more details). These perspectives call attention to the management processes within the institutions as an alternative to the traditional areas of academic standards, accreditation and performance indicators of teaching and research (Abdullah, 2006). Although a handful of studies empirically examine various service quality models in higher education institutions in various country contexts (e.g. Joseph and Joseph, 1997 (New Zealand); LeBlanc and Nguyen, 1997 (Canada); Li and Kaye, 1998 (the UK); Kwan and Ng, 1999 (Hong Kong and China); Alves, 2000 (Portugal); Athiyaman, 2000 (Australia); Capelleras and Veciana, 2004 (Spain)), no study has empirically examined the service quality in Japanese universities. The present study empirically examines the quality experience as perceived by the international students of the Japanese universities, and subsequently develops a performance-based higher education service quality model (PHEd model). The following sections discuss a review of relevant literature, research method, findings, conclusion and limitations. Literature review Quality in general, and service quality in particular, are accepted as being complex and multidimensional (Galloway and Ho, 1996). The service quality scale, the SERVQUAL (a glossary of items used in this article can be found in the Appendix), which is based on the difference between the expectation, and performance, was first developed by Parasuraman et al. (1988). The exploratory research of Parasuraman et al. (1985) finds ten dimensions to measure the service quality and develops a conceptual model for service quality. These dimensions are reliability, responsiveness, competence, access, courtesy, communication, credibility, security, understanding/knowing the customer, and tangibles. In a subsequent study, Parasuraman et al. (1988) developed 22 item instruments, the SERVQUAL, for assessing customer perceptions of service quality in
Performancebased service quality model 127
QAE 18,2
128
service and retailing organisations. The idea behind disconfirmation is that service quality depends not only on the absolute level of performance that is experienced, but also on the performance relative to the expected performance (i.e. expectation-minus-perception). Although the SERVQUAL construct is well established, a number of studies have criticised the approach with empirical evidences. For example, one of the notable studies suggests that the expectations-minus-performance (Q ¼ E – P) is an inappropriate basis for use in the measurement of service quality (Cronin and Taylor, 1992). This study states that expectations can have unique effect on consumers’ perceptions of service quality, and consumers’ satisfaction has a stronger influence on purchase intentions than service quality. In this regard, the SERVQUAL approach is inadequate to conceptualise and to operationalise the service quality measurement. Despite that there are conceptual and operational differences between service quality and satisfaction; existing literatures create confusion about the relationship between service quality and satisfaction. Whereas, service quality, as defined by Cronin and Taylor (1992), is a form of attitude and a long run overall evaluation; satisfaction is a transaction-specific measure. Therefore, Cronin and Taylor (1992) develop 22-item performance-only scale, the SERVPERF, and exclude any consideration of expectation items of the SERVQUAL scale. First, Cronin and Taylor (1992) examine the dimensionality of the service quality scale by means of a confirmatory factor analysis (CFA). The reason for using the CFA is that whereas exploratory factor analysis (EFA) makes no assumption about item-scale associations, the CFA explicitly tests the proposition that items cluster in specific subscales. Its rigorous testing procedures include a suite of fit estimates, ranging from statistics through various types of model fit that permit a more rigorous scrutiny of outcomes than is afforded via EFA (Grimbeek and Nisbet, 2006). Moreover, in contrast to EFA, where all loadings are free to vary, CFA allows for the explicit constraint of certain loadings to be zero. The comparative results show that the performance-only scale gives a better chi-square statistic and better goodness-of-fit indices than the SERVQUAL scale. Thus, Cronin and Taylor (1994) state that the disconfirmation-based SERVQUAL scale is measuring neither service quality nor consumer satisfaction. In contrast to the studies of Cronin and Taylor (1992, 1994), Cuthbert (1996) states that despite criticisms by a number of authors, the service quality paradigm, Q ¼ E – P, seems to be the most practical model for the measurement of service quality. The study states that the model, Q ¼ E – P, might be an appropriate model since the service experience of students is not clearly defined in the literature. The service experience of students is much more complex than that of banks, restaurants or telephone users. This is because within the educational context there may be better information flow and less weakness of relationships between staff and students. Literature states that the ten dimensional SERVQUAL approach is primarily more attractive and seems to fit better than the five dimensional SERVQUAL scale (Cuthbert, 1996). Literature also criticises the five-dimensional SERVQUAL scale and its inclusion of “expectation” as a key variable to measure service quality (Carman, 1990; Cronin and Taylor, 1992, 1994; Parasuraman et al., 1991a, b; Babakus and Boller, 1992; Abdullah, 2005, 2006). Following the scale developed by Cronin and Taylor (1992, 1994), Abdullah (2005, 2006) proposes the Higher Education Performance-only (HEdPERF) construct. This construct attempts to capture the determinants of service quality within the higher education sector and empirically examines the HEdPERF scale against two
alternatives namely the SERVPERF and the merged HEdPERF-SERVPERF scales. The primary objective is to assess the relative strengths and weaknesses of each instrument in order to determine which instrument has the superior measurement capability in terms of unidimensionality, reliability, validity and explained variance of service quality. The results of the HEdPERF scale show apparent superiority over the SERVPERF and the HEdPERF-SERVPERF scales. Although the HEdPERF scale contributes significantly in literatures, the scale can further be strengthened by ensuring content and face validity of some of the items. It is easily apprehensible that there are pros and cons in every model and an only-performance-based model can better explain the perceived service quality in terms of reliability and predictability. Perceived service quality (Q) has been viewed as a form of attitude related to satisfaction (S). Therefore, perceived service quality (Q) ¼ attitudes at time t (At). An attitude is the function of expectation (Et2 1) and perception (performance of the service after experience, Pt), where E is the expectation and P is the perception at time t, and t 2 1 refers to the lag period. Thus, Et2 1 refers to pre-experience perception (i.e. expectation). Service marketers use a number of marketing stimuli, including, aggressive promotional activities, pricing, visual components and others, and influence consumers to form a set of expectations regarding a specific service. Consumers are often misled by these drives; thus, they adjust between their expectations and perceptions. The gap between expectation and perception widens if the perceived performance (or perceived service quality as experienced by the consumers) falls short, i.e. expectation (E) . performance (P). This is particularly known as the negative disconfirmation, which leads to dissatisfaction. The positive disconfirmation (E , P) and confirmation (E ¼ P), on the other end, leads to satisfaction, respectively. In the extant literature, satisfaction is conceptualized as transaction-specific satisfaction and cumulative satisfaction (Boulding et al., 1993; Jones and Suh, 2000; Yi and La, 2004). Transaction-specific satisfaction is a customer’s evaluation of his or her experience and reactions to a particular service encounter (Cronin and Taylor, 1992; Boshoff and Gray, 2004), and cumulative satisfaction refers to a customer’s overall evaluation of the consumption experience to date (Johnson et al., 1995). These studies imply that expectations do not play any role in both transaction-specific and cumulative satisfactions. Therefore, Gro¨nroos argues that “measuring expectations is not a sound way of proceeding anyway, because experiences are in fact perceptions of reality, and inherent in these perceptions are the prior expectations. Consequently if first, one way or the other, expectations are measured and then experiences are measured, then expectations are measured twice” (Gro¨nroos, 1993, p. 56). Since expectations can be biased and are often misleading, eliminating expectation from the attitude function we get At ¼ f{P t } ¼ Qt . Therefore, an attitude towards a service refers to experience of using a service (i.e. performance of service attributes), which forms the perceived service quality and that it leads to satisfaction (or dissatisfaction). This study conceptualizes service quality as a form of attitude representing a long run overall evaluation (Cronin and Taylor, 1994; Taylor and Cronin, 1994). Research method Performance-based attitudinal items are generated from review of literature (Abdullah, 2005, 2006; Cronin and Taylor, 1992, 1994; Parasuraman et al., 1985, 1988). Of them, 13 items are adapted from the HEdPERF, which is also consistent with the SERVPERF
Performancebased service quality model 129
QAE 18,2
130
and the SERVQUAL scales, and 54 items are developed from a pilot survey of 64 international students, focus group interview and experts’ opinion. Therefore, a total of 67-items are developed for collecting data. Respondents are asked each question from “you” or “I” point of view in order to involve them more enthusiastically and to get the answers as to what they have experienced, in particular, following the suggestions of Engerrand (1975) and Rodman (2001). The structured questionnaires are designed in English language. Although the questionnaire is lengthy for this study, it conforms to similar research works (e.g. Cronin and Taylor, 1992; Teas, 1993a; Lassar et al., 2000; Mehta et al., 2000; Robledo, 2001; and Abdullah, 2005, 2006) that attempted to compare various instruments for measuring service quality. Data are collected from undergraduate, graduate and post-graduate international students on a seven-point Likert type scale, where 1 is set for strongly agree and 7 is set for strongly disagree. The sample of this study includes international students, who use English either as their first or second language. The extant literatures segmented student population in terms of undergraduate and postgraduate students, respectively, and draw their inferences (Angell et al., 2008; Douglas et al., 2008). Being a segment of the student population, studying international students’ perception of higher education service quality of the Japanese universities is contributing to the literature. Personal interview technique, post mail and electronic mail are used for collecting data from 11 Japanese universities. Among the 1,200 questionnaires 910 are distributed through post mail each with a cover letter and pre-postage envelope to the international students’ offices of the respective universities, and 90 questionnaires are sent through e-mail attachments each with a cover letter only, and for 200 questionnaires the personal interview technique is used during September-October 2006. The post mail survey is conducted in the Fukuoka University, Kyushu Institute of Technology and Kyushu University using convenience and simple random sampling techniques, while the e-mail survey is conducted in the Oita University, Ritsumeikan Asia Pacific University and Ritsumeikan University using snowball sampling technique, and a personal survey is conducted at the University of Electro-communication, Waseda University, Hiroshima University, Yamaguchi University and Kobe University using convenience and purposive sampling techniques. Adequate precautions are taken to avoid receiving more than one completed questionnaire from any of the respondents. These include selection of various universities at different places for different modes of data collection, a confirmation that they had not completed a similar survey within a certain period of time either through e-mail, post mail or interview, and students’ demographic information. Prior to data collection, necessary approvals for research proposal and domestic travel are obtained from the Ritsumeikan Centre for Asia Pacific Studies, Japan. Three channels of distribution of questionnaires are used to avoid huge costs of excessive travel and to avoid fatigue, and to get more responses within short period. Since the data are collected during September and October 2006, this is one of the important reasons for low rate of response as semesters start in this period in Japanese universities. Although the response rate is 30 per cent, it is consistent with the similar studies (for example, Abdullah, 2005, 2006; Sultan and Tarafder, 2007a, b; Chowdhury and Sultan, 2005) that attempted to estimate models. A total of 362 usable responses (i.e. 0.306 per cent of the population) are taken into account for a population size of nearly 117,927 international students ( Japan Student Services Organization, JASSO, as of May 2006) for this study. Of them, 217 students are international and studying in the undergraduate programs, 56 students are
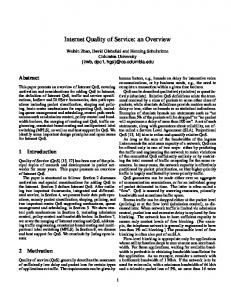
international and studying in the graduate programs and 89 are international postgraduate students. According to their gender, 249 are male respondents and 113 are female respondents. Although the sample size is small in comparison to the population, it is in line with the studies of Abdullah (2005, 2006). The sample size is also in line with the generalised scientific guideline for sample size decisions as proposed by Krejcie and Morgan (1970). Moreover, the sample size considered for this study is five times more than the number of variables (Hatcher, 1994). Therefore, the sample size taken into consideration for this study is also consistent. The share of response including interview technique, post mail, and e-mail to total usable responses are 52, 30 and 18 per cent, respectively. First, we calculate the descriptive statistics. The descriptive statistics can give a better overview on the collected data (see Table I). Second, the scale reliability is confirmed using the Cronbach’s alpha (a). The Cronbach’s alpha measures how well a set of items (or variables) measures a single unidimensionality (i.e. fit to the one-factor model) of a latent construct. The Cronbach’s alpha generally increases when the correlations between the items increase. Third, the exploratory factor analysis is used in order to determine the key variables and variances explained by the extracted factors using the SPSS version 12. One of the aims of using the exploratory factor analysis is to explain a matrix of correlations with as few factors as is possible. The factor loadings are the correlations of variables with the factors. The squared factor loading of variables indicate the percentage of variance of that variable explained by the factor. Thus, the sum of the average squared loadings on all factors indicates the proportion of variance in the matrix explained by the factors (Kline, 1994, p. 37). Fourth, we perform the tests of unidimensionality and model fit indices using AMOS 5. The test for unidimensionality is a highly mandatory condition for construct validity and reliability checking, which is referred to the existence of a single construct or trait underlying a set of measures (Hattie, 1985, Anderson and Gerbing, 1991). Therefore, we use chi-square (x 2 ), root mean square error of approximation (RMSEA), comparative fit index (CFI) and goodness of fit index (GFI) as the indicators of the unidimensionality test. While the reliability test shows the internal consistency of the scale, the validity test shows the extent to which a measure or a set of measures correctly represents the concept of the study. In this study, we ensure the content or the face validity through expert opinion and pre-testing the questionnaire. Thus, we remove vague and double-barrelled questions, and ask only those questions that are pertinent to the objectives of this study and that have been experienced by the respondents, in particular. Results and discussion The results of the descriptive statistics and factor analysis The proposed measure for the performance-based service quality in higher education is a 67-item instrument. The inter-item coefficients of correlation are significant (i.e. coefficient of correlation, r . 0:30, and significant at the 5 per cent level) for most of the variables, which indicate a clear indication for the suitability of the factor analysis (Abdullah, 2005). The principal component analysis followed by varimax rotation method is used in exploratory factor analysis. The results show that communalities in variables are between 0.710 and 0.945. The communality is the amount of variance a variable shares with other variables. The variable’s communality for each variable is also assessed to ensure acceptable levels of explanation, which represents the amount
Performancebased service quality model 131
3.90 4.35 3.91 4.32
0.340 0.348 0.363
3.65 2.75 3.22 3.35 4.22 4.56
0.726 0.432 0.773 0.549 0.671 0.556
0.385
4.36
3.99
0.484
3.56
0.869
0.816 0.691 0.804 0.323 0.890 0.925 0.800
0.741
0.314
4.57
0.656 0.813
4.02
0.670 0.414
4.17 4.66
0.698 0.358 0.374 0.658 0.447
2 4 4 2
3
3 1 2 3 4 5
4
3
5
5
3 5
1 4 2
2.17 1.82 1.18 2.16
1.78
1.54 1.64 1.72 1.58 1.73 1.94
1.51
1.73
1.57
1.81
1.63 1.47
1.65 1.70 2.23
(continued)
0.839
Descriptive statistics Mean Mode SD Reliability test 2.75 4.60 4.19
SS 8
0.668 0.552 0.866 0.325 0.707 0.515
Effi. Com. Assu. USM 4 5 6 7
2. My administrative records are kept correctly 3. My professors evaluate me correctly 10. Fifteen classes for each course are satisfactory to me for learning 12. The course designed by the faculty is effective for us 14. We receive attention from the teachers other than studies 17. My teachers are competent for their academic backgrounds 18. My teachers are competent for having teaching experience 19. My teachers are competent for having research experience 20. My teachers are competent for having administrative experience 25. The research unit of my university is strong 29. Our class time is convenient and well suited 32. Courtesy of employees of my university is good 33. Courtesy of teachers of my university is good 34. My teachers are well prepared in the class room 35. Academic and administrative environments of my university are friendly 36. Admission department effectively informed me about the programs 37. We are well informed regarding any change, if any 38. Brochures of my university has convinced me much 39. Web site of my university has convinced me much 40. University personnel informed me about this university
Cap. 3
Dep. 1
Table I. Descriptive statistics, factor loadings, and reliability test results Eff. 2
132
Item description No. Items
Factor loadings for each of the dimensions
QAE 18,2
5.47 4.35
0.577 0.804
2.29 3.03
0.794
2.62
0.612 0.577
0.421 0.365
2.34 1.89 1.87 2.12 3.58
3.41
0.641 0.436
0.306 0.802 0.606 0.497 0.606 0.445 0.402 0.479 0.330 0.305 0.535 0.616
3.90
0.805
0.374
4.46
0.877
0.342
5.13
0.735
0.374
5.07
3
1
2
3 1 1 1 5
2
3
4
7
4
6
6
7 5 6
1.12
1.51
1.39
1.12 1.30 1.34 1.82 1.61
1.80
1.85
1.83
1.79
1.67
1.68
1.72
2.11 1.84 1.69
0.811 (continued)
0.781
Descriptive statistics Mean Mode SD Reliability test
0.727
SS 8 5.37 4.44 5.18
Effi. Com. Assu. USM 4 5 6 7
0.547 0.787 0.678
Cap. 3
41. Enrolled students informed me about this university 44. I have selected this university because of its goodwill 45. I have selected this university because it gives employment opportunity 46. I have selected this university as it gives world class education 47. I have selected this university as it has qualified teachers 48. I have selected this university as it has better infrastructure 49. I have selected this university as I am pleased with the contact personnel 52. Country image of Japan motivated me to take admission 61. The scenic beauty of my university motivated me much 66. I believe that the service I receive is equal to the fees I pay 1. My academic performances are kept correctly 5. Our examinations are held at the right time 6. Our results are published at the right time 30. Our university is placed at a suitable location 43. I am satisfied compared with the tuition fees that I pay 51. Advertisements motivated me to take admission in this university 58. My university takes proper steps for specific requirements of the students 7. My university gives proper education
Eff. 2
Dep. 1
Item description No. Items
Factor loadings for each of the dimensions
Performancebased service quality model 133
Table I.
Table I. Eff. 2
Cap. 3
Effi. Com. Assu. USM 4 5 6 7
13. Teachers give me adequate time to understand the 0.712 subject 15. University staff are helpful to provide services to us 0.339 0.630 16. Teachers can make the subjects understandable to 0.727 me 23. Our university staff are competent in their job area 0.456 0.485 0.313 0.431 24. We receive prompt service from the staff 0.483 0.633 0.396 26. At least one small field study in a semester is given 0.577 to me by my teachers 31. Transportation costs to reach at the university is 0.689 acceptable to me 50. I have selected this university as I have acquaintance 0.516 here 53. My university has necessary measures to fight 0.323 0.546 0.512 against disaster 55. I think that co-staying in student residence building 0.382 0.632 is secure for male and female 60. I am encouraged to spread the name of the university 0.376 0.355 65. My university has credit transfer facilities, which 0.579 0.317 build positive image 22. I believe that teachers with academic and research 0.390 0.417 experience can enrich academic environment 63. My university has multimedia in classrooms, which 0.363 0.332 motivated me much 64. My university also emphasize on the extra curricular 0.321 0.525 0.384 activities 4. Our quarter starts at the right time 0.403 0.559 21. I believe that teachers with administrative 0.315 0.374 0.397 experience can enrich academic environment
Dep. 1
SS 8 4 4 4 2 1 4 4 3 4 2 3 4 3 3 2 1 4
3.53 3.70 3.09 2.52 2.06 3.98 3.75 3.14 3.68 2.59 3.56 2.91 2.31 2.25 2.38 1.86 3.19
1.11 1.15
0.91
1.11
1.10
1.07 1.47
1.66
1.07
1.62
1.99
1.09 1.66 1.33
1.37 1.60
1.34
(continued)
0.892
0.823
Descriptive statistics Mean Mode SD Reliability test
134
Item description No. Items
Factor loadings for each of the dimensions
QAE 18,2
Dep. 1
27. I get satisfactory answer even if I use electronic media 28. Services from the university is not delayed for us 62. My university has furnished class room 67. I think that financial benefits for the students should be increased 42. I always get help from the authority, if I ask 0.471 57. The security measures taken by my university are adequate 59. The authority of my university gives individualized attention 54. Our university give training to survive from disaster 56. Our university take necessary actions for any 0.325 conflict among students 8. Four months vacation in a year is useful for me 9. Our authority should think of three instead of two semesters in a year 11. Our course syllabus for 15 classes are satisfactory
Item description No. Items
Eff. 2
2.9 4.87 4.28
0.437 0.535 0.646
4.85 3.65
4.37
0.655 0.542 0.591
3.01 3.55
0.572 0.376 0.434
0.425
2.29 2.74 3.16
0.455 0.408 0.376
3.11
4
4 7
6 4
5
2 4
2 4 4
5
0.896
1.53 1.94 1.25
0.783
0.910
1.34 1.07
1.30
1.14 1.00
1.24 1.37 1.20
1.70
Descriptive statistics Mean Mode SD Reliability test
0.410 0.301
SS 8
0.424
Effi. Com. Assu. USM 4 5 6 7
0.303
Cap. 3
Factor loadings for each of the dimensions
Performancebased service quality model 135
QAE 18,2
136
of variance accounted for by the factor solution. The results show that the eight factors can explain 86.98 per cent of the total variance. The scree plot also confirms the similar findings. The scree test is used to identify the optimum number of factors that can be extracted before the amount of unique variance begins to dominate the common variance structure (Cattell, 1966). These eight factors are subsequently rotated using a varimax procedure. Table I shows the results of the descriptive statistics, the factor loadings under each dimension and the reliability test (the Cronbach’s alpha). Based on the overall loaded items, the eight dimensions/factors are named, for example, dependability (Depen), effectiveness (Effec), capability (Capab), efficiency (Effi), competencies (Compet), assurance (Assu), unusual situation management (USM), and semester – syllabus (SS). Dependability (Depen) refers to those experiences of the students that they believe that the service quality results will be the same, if the services are performed repeatedly over the course of time. There are 30-items that are loaded on this dimension. These items are: item numbers 2, 3, 10, 12, 14, 17-20, 25, 29, 32-41, 44-49, 52, 61 and 66. The dimension, dependability, can explain 32.62 per cent of the total variance. However, the descriptive statistics state that international students studying at Japanese universities are concerned about some of the general university services, including the design of the course; number of classes for each of the courses; lecturers’ academic, research, teaching, and administrative experience and background; lecturers’ evaluation; attention from the faculty other than studies; willingness of staff to provide services; friendly academic and administrative environment; brochures, web site, words-of-mouth and goodwill of the university; employability of the university; and world class education. Effectiveness (Effec) refers to those experiences of the students that they believe that the services of the university are accurate and purposeful. This dimension can explain 16.7 per cent of the total variance. There are eight items/factors that are loaded on this dimension. These items are: item number 1, 5, 6, 30, 43, 51 and 58. The descriptive statistics state that international students have agreed, in general, to all of the items loaded on this dimension. However, they are neutral to the item number 43. Capability (Capab) is the quality of being capable to perform services. It requires legal, intellectual, physical and infrastructure abilities to perform services. There are 13 items/factors that are loaded on this dimension. This dimension can explain 14 per cent of the total variance. The items that are loaded on this dimension are: item numbers 7, 13, 15, 16, 23, 24, 26, 31, 50, 53, 55, 60 and 65. The descriptive statistics state that international students are concerned about the evaluation procedures of professors, consulting hours given by the professors, attention from the faculty other than study, willingness of staff to provide services, competencies of the faculty in making the study understandable, and costs of transportation. Efficiency (Effi) refers to those experiences of the students that they believe that the services of the university are effective without wasting time or efforts or expenses. There are three items that are loaded on this dimension and this dimension can explain 7 per cent of the total variance. The items that are loaded on this dimension include item numbers 22 and 63-64. The mean and mode values state that in most of the instances, the students have agreed, in general, to the items. Competencies (Compet) refer to the qualities or abilities of the relevant service providers to perform satisfactory services. This dimension can explain 6 per cent of the total variance and six items are loaded on this dimension. These items are 4, 21, 27, 28, 62 and 67. The descriptive statistics state that the international students are neutral to
the lecturers’ research and administrative experience, respectively. They are also reluctant to comment about the university’s research strengths. One of the reasons stated by the students is that the authority does not publish or communicate properly about the research strengths and the research backgrounds of the lecturers. In addition, the international students are also neutral to some of the factors, including, getting feedback from the staff when using electronic media like e-mail, phone, fax etc.; security measures taken by the university; tuition fees waiver; and increasing the number of scholarships. These signify, that the staff needs to be more responsive, through electronic media. A prompt response can assure a student that the staff is aware of the student’s query. The policy structure should be supportive towards internationalisation. Assurance (Assu) refers to those service qualities that build confidence among service recipients. This dimension can explain 3.84 per cent of the total variance and it includes three items. The items are 42, 57 and 59. The descriptive statistics state that the international students have agreed that they get help from the authority. However, on an average, the students, in general, do not agree that they receive individualised attention. They are also neutral to the item that states that the security measures are adequate for the university. Unusual situation management (USM) refers to the abilities of the university to resolve any grievance, movement or conflict among students, and between students and local community. It also refers to the abilities of the university to take the necessary measures before and during any disaster or natural calamities (e.g. fire, flood, and earthquake). Items 54 and 56 are loaded on this dimension. This dimension can explain 3.91 per cent of the total variance. The descriptive statistics state that the international students have disagreed, in general, to the item number 54, while they are neutral to the item number 56. This explains that the Japanese universities should arrange necessary training programs, periodically, to survive disasters and should take prompt actions against any conflict or grievance. Semester and Syllabus (SS) refer to designing an integrated course and syllabus for a program focusing on the global requirements. This dimension can explain 2.91 per cent of the total variance and includes items 8, 9 and 11. The descriptive statistics state that international students are apprehensive, in general, of items 9 and 11. However, they have agreed, in general, to item 8 that state that four months’ vacation in a year is useful for them. The results of the reliability analysis As a guideline, the Cronbach’s alpha of 0.70 and above is considered to be the criteria for demonstrating internal consistency of new scales and established scales, respectively (Nunnally, 1988). The reliability analyses reveals that the Cronbach’s alpha coefficients for factors are between 0.781 and 0.910 (see Table I), suggesting that there is a reasonable degree of internal consistencies. The results of the unidimensionality test and model fit A measurement model is specified in order to perform the unidimensionality test and confirmatory factor analysis is run by means of Structural Equation Modelling (SEM) technique within AMOS 5 framework. The observed variables are the eight dimensions extracted through exploratory factor analysis namely dependability (Depen), effectiveness (Effec), capability (Capab), efficiency (Effi), competencies (Compet),
Performancebased service quality model 137
QAE 18,2
138
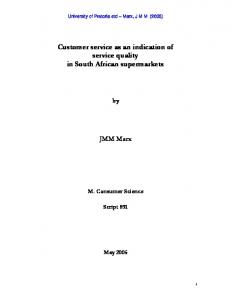
assurance (Assu), unusual situation management (USM), and semester and syllabus (SS). The latent variable is the perceived service quality. The factor loadings of þ 3 or greater under each dimension/variable are separated, and their average scores represent each of the observed variables, respectively. Table II shows the measures of model fit. The overall fit of the model to the data is evaluated in various ways. However, it is generally acknowledged that most models are useful approximations (i.e. p , 0:05) that do not fit perfectly in the population (e.g. Ali and Shamsuddoha, 2007; Dawes and Massey, 2006). In other words, the null hypothesis of perfect fit is not plausible to begin with and will in the end be accepted only if the sample is not allowed to get too big. Browne and Mels (1992) state that the null hypothesis of perfect fit is implausible, and it does not help much to know whether or not the statistical test has been able to detect that it is false. Specifically, an exact fit of a model is indicated when the p-value for chi-square (x 2 ) is above 0.05. While the overall x 2 for our measurement model is significant ( p-value is 0.021), it is well established that this statistic is sensitive to large sample sizes and complex models (e.g. Hair et al., 1998). Although chi-square is sensitive to sample size and tends to be significant in large samples, a relative likelihood ratio between a chi-square and its degrees of freedom is used as another measure of goodness of fit. Eisen et al. (1999) suggest that a relative likelihood ratio of five or less is considered an acceptable fit. Our model shows that the relative likelihood ratio is, x 2/df ¼ 3.85, which is well within the acceptable range. The root mean square error of approximation (RMSEA), which is the measure of the discrepancy per degree of freedom, generally considered as one of the most informative fit indices (Brown and Cudeck, 1993; Diamantopoulos and Siguaw, 2000). The RMSEA value for the default model is 0.076, an evidence of fair fit to the data. Therefore, the results show that the model fits fairly and represents a reasonably close approximation to the population. Comparative-fit-index (CFI) of this model is 0.996, which is close to 1 and resembles a very good fit (Bentler, 1990). Likewise, goodness-of-fit index (GFI) for the same model is 0.995, which is also close to 1 and that it indicates a very good-fit. Overall, these fit statistics are considered acceptable enough to establish the validity of this measurement model. Conclusion and implication The literature has left gaps in researching perception of international students with regard to service quality of Japanese universities. This study has attempted to fill this gap, and subsequently developed a model, PHEd-Performance-based Higher Education Model. This study is worth doing for several reasons. First, it takes samples from the international students at Japanese universities, which is unique. Second, this study
Measures of fit 2
Table II. Unidimensionality test results
Chi-square ðx Þ ¼ 7:7 Relative likelihood ratio The RMSEA The CFI The GFI
The proposed model (PHEd model) p-value , 0.05 x 2/df ¼ 3.85 0.076 0.996 0.995
develops a comprehensive scale focusing on the distinguished characteristics of the higher education institutions. Third, the questionnaires are designed from the respondents’ perspective only, in order to get the answers about what they have really experienced. Fourth, this study develops a performance-based higher education service quality model (PHEd model). The results of the empirical examination of this model are satisfactory. This study finds that academics are the core of the value-based higher education sector. Universities should emphasise hiring competent lecturers/professors. Academic program design, syllabus formulation and content design should follow the international standards. Staff should be proactive in providing services. The results also state that advertisements and word-of-mouth motivate students to seek admission, particularly, for international students. This study develops the PHEd model consisting of eight dimensions and 67 items. This comprehensive model is particularly developed for the higher education institutes. The higher education institutions should concentrate their efforts on the relevant attributes. Focusing on other attributes, for example, promotional activities, may consume much of the efforts and resources. Eventually, this may lead to a poorly ranked university. Therefore, the higher education managers should prioritise the dimensions and factors, and concentrate their efforts in order to further improve the quality of services. Limitations and further research First, this study has collected data from international students studying at various Japanese universities who use English either as first or second language. Second, the study uses email, post mail and personal interview to collect data. Although using three routes of data collection may provide increased number of responses, this procedure is laborious and requires a careful attention in preparing questionnaire and conducting survey in order to avoid double completion. Although this study has conducted survey using same questionnaires in three routes of data collection modes, future studies should find if there is any difference if data is collected from three different sources using the same questionnaires. Future studies should also put particular attention in selecting the extent of the Likert type scale; and the samples, especially between the fee paying and non-fee paying students, international and domestic students, and the students who study in various programs at various levels. Although the empirical results for the PHEd model are significant and seem to play a greater role in performance-based service quality measurement for the higher education institutions, a comparative study among PHEd, HEdPERF and SERVPERF can produce relative strengths of these models. The scale of this study particularly focuses on various aspects of service delivery. Future study should focus on other aspects relevant to student recruitment and retention. Moreover, social norms might be relevant to modelling higher education choice, satisfaction and behavioural intentions. As this study has attempted to find service quality attributes and its modelling, future studies should develop a comprehensive model and its predictive validity addressing social norms, service quality, satisfaction and behavioural intentions. References Abdullah, F. (2005), “HEdPERF versus SERVPERF: the quest for ideal measuring instrument of service quality in higher education sector”, Quality Assurance in Education, Vol. 13 No. 4, pp. 305-28.
Performancebased service quality model 139
QAE 18,2
140
Abdullah, F. (2006), “Measuring service quality in higher education: HEdPERF versus SERVPERF”, Marketing Intelligence and Planning, Vol. 24 No. 1, pp. 31-47. Ali, M.Y. and Shamsuddoha, A.K. (2007), “Export promotion programs as antecedents of internationalization of developing country firms: a theoretical model and empirical assessment”, Journal of Global Business Advancement, Vol. 1 No. 1, pp. 20-36. Alves, H. (2000), “As Dimensiones Qualidades no Servic¸io Educac¸ao: a Percepcao Dos Alunos da Universidades da Beira Interior”, Revista Portuguesa de Gestao, Vol. 15 No. 4, pp. 78-89. Anderson, J.C. and Gerbing, D.W. (1991), “Predicting the performance of measures in a confirmatory factor analysis with a pretest assessment of their substantive validities”, Journal of Applied Psychology, Vol. 76 No. 5, pp. 732-40. Angell, R.J., Heffernan, T.W. and Megicks, P. (2008), “Service quality in postgraduate education”, Quality Assurance in Education, Vol. 16 No. 3, pp. 236-54. Athiyaman, A. (2000), “Perceived service quality in higher education sector: an empirical analysis”, Proceedings of the ANZMAC 2000, Visionary Marketing for the Twenty-first Century: Facing the Challenge, 28, 29, 30 November and 1 December, pp. 50-5. Babakus, E. and Boller, G.W. (1992), “An empirical assessment of the SERVQUAL scale”, Journal of Business Research, Vol. 24 No. 3, pp. 253-68. Bemowski, K. (1991), “Restoring the pillars of higher education”, Quality Progress, October, pp. 37-42. Bentler, P.M. (1990), “Comparative fit indexes in structural models”, Psychological Bulletin, Vol. 107, pp. 238-46. Boshoff, C. and Gray, B. (2004), “The relationships between service quality, customer satisfaction and buying intentions in the private hospital industry”, South African Journal of Business Management, Vol. 35 No. 4, pp. 27-37. Boulding, W., Kalra, A., Staeling, R. and Zeithaml, V.A. (1993), “A dynamic process model of service quality: from expectation to behavioural intentions”, Journal of Marketing Research, Vol. 30 No. 1, pp. 7-27. Brown, M.W. and Cudeck, R. (1993), “Alternative ways of assessing model fit”, in Bollen, K.A. and Long, J.S. (Eds), Testing Structural Equation Models, Sage, Newbury Park, CA. Browne, M.W. and Mels, G. (1992), RAMONA User’s Guide, The Ohio State University, Columbus, OH. Capelleras, J. and Veciana, J. (2004), “Calidad de Servicio en la Ensen˜anza Universitaria: Desarrollo y Validacio´n de una Escala de Medida”, Revista Europea de Direccio´n y Economı´a de la Empresa, Vol. 13 No. 4, pp. 55-72. Carman, J.M. (1990), “Consumer perceptions of service quality: an assessment of the SERVQUAL dimensions”, Journal of Retailing, Vol. 66, pp. 33-55. Cattell, R.N. (1966), “The scree test for the number of factors”, Multivariate Behavioural Research, Vol. 1, pp. 245-76. Chowdhury, M.H.K. and Sultan, M.P. (2005), “Determinants of perceived service quality – an empirical study”, Journal of Business Administration, Vol. 31 Nos 1-2, pp. 179-88. Cronin, J.J. Jr and Taylor, S.A. (1992), “Measuring service quality: a re-examination and extension”, Journal of Marketing, Vol. 56 No. 3, pp. 55-68. Cronin, J.J. Jr and Taylor, S.A. (1994), “SERVPERF versus SERVQUAL: reconciling performance-based and performance-minus-expectations measurement of service quality”, Journal of Marketing, Vol. 58 No. 1, pp. 125-31.
Cuthbert, P.F. (1996), “Managing service quality in HE: is SERVQUAL the answer (part I-II)”, Managing Service Quality, Vol. 6 No. 2, pp. 11-16. Dawes, P.L. and Massey, G.R. (2006), “A study of relationship effectiveness between marketing and sales managers in business markets”, Journal of Business and Industrial Marketing, Vol. 21 No. 6, pp. 346-60. Diamantopoulos, A. and Siguaw, J.A. (2000), Introducing LISREL, Sage, London. Douglas, J., McClelland, R. and Davies, J. (2008), “The development of a conceptual model of student satisfaction with their experience in higher education”, Quality Assurance in Education, Vol. 16 No. 1, pp. 19-35. Eisen, S.V., Wilcox, M. and Leff, H.S. (1999), “Assessing behavioural health outcomes in outpatient programs: reliability and validity of the BASIS-32”, Journal of Behavioural Health Sciences & Research, Vol. 26 No. 4, pp. 5-17. Engerrand, D.D. (1975), “Teaching the ‘you’ viewpoint”, Business Communication Quarterly, Vol. 38 No. 1, pp. 26-7. Galloway, L. and Ho, S. (1996), “A model of service quality for training”, Training for Quality, Vol. 4 No. 1, pp. 20-6. Ginsberg, M.B. (1991), Understanding Educational Reforms in Global Context: Economy, Ideology and the State, Garland, New York, NY. Grimbeek, P. and Nisbet, S. (2006), “Surveying primary teachers about compulsory numeracy testing: combining factor analysis with Rasch analysis”, Mathematics Education Research Journal, Vol. 18 No. 2, pp. 27-39. Gro¨nroos, C. (1993), “Toward a third phase in service quality research: challenges and future directions”, in Swartz, T.A., Bowen, D.E. and Brown, S.W. (Eds), Advances in Services Marketing and Management, Vol. 2, JAI Press, Greenwich, CT, pp. 49-64. Guolla, M. (1999), “Assessing the teaching quality to student satisfaction relationship: applied customer satisfaction research in the classroom”, Journal of Marketing Theory and Practice, Vol. 7 No. 3, pp. 87-97. Hair, J.F., Anderson, R.E. and Tatham, R.L. (1998), Multivariate Data Analysis, 5th ed., Prentice-Hall, Englewood Cliffs, NJ. Hatcher, L. (1994), A Step-by-step Approach to Using the SAS System for Factor Analysis and Structural Equation Modelling, SAS Institute, Cary, NC. Hattie, J. (1985), “Methodology review: assessing uni-dimensionality of tests and items”, Applied Psychological Measurement, Vol. 9 No. 2, pp. 139-64. Hill, Y., Lomas, L. and MacGregor, J. (2003), “Students’ perception of quality in higher education”, Quality Assurance in Education, Vol. 11 No. 1, pp. 15-20. Johnson, M., Anderson, E. and Fornell, C. (1995), “Rational and adaptive performance expectations in a customer satisfaction framework”, The Journal of Consumer Research, Vol. 21 No. 4, pp. 695-707. Jones, M.A. and Suh, J. (2000), “Transaction-specific satisfaction and overall satisfaction: an empirical analysis”, Journal of Services Marketing, Vol. 14 No. 2, pp. 147-59. Joseph, M. and Joseph, B. (1997), “Service quality in education: a student perspective”, Quality in Assurance in Education, Vol. 5 No. 1, pp. 15-21. Kline, P. (1994), An Easy Guide to Factor Analysis, Routledge, Taylor and Francis, Abingdon. Krejcie, R. and Morgan, D. (1970), “Determining sample size for research activities”, Educational and Psychological Measurement, Vol. 30, pp. 607-10.
Performancebased service quality model 141
QAE 18,2
142
Kwan, P.Y.K. and Ng, P.W.K. (1999), “Quality indicators in higher education-comparing Hong Kong and China’s students”, Managerial Auditing Journal, Vol. 14 No. 1, pp. 20-7. Lassar, W.M., Manolis, C. and Winsor, R.D. (2000), “Service quality perspective and satisfaction in private banking”, Journal of Services Marketing, Vol. 14 No. 3, pp. 244-71. Lawson, S.B. (1992), “Why restructure? An international survey of the roots of reform”, Journal of Education Policy, Vol. 7, pp. 139-54. LeBlanc, G. and Nguyen, N. (1997), “Searching for excellence in business education: an exploratory study of customer impressions of service quality”, International Journal of Educational Management, Vol. 11 No. 2, pp. 72-9. Li, R. and Kaye, M. (1998), “A case study for comparing two service quality measurement approaches in the context of teaching in higher education”, Quality in Higher Education, Vol. 4 No. 2, pp. 103-13. Mehta, S.C., Lalwani, A.K. and Han, S.L. (2000), “Service quality in retailing: relative efficiency of alternative measurement scales for different product-service environments”, International Journal of Retail & Distribution Management, Vol. 28 No. 2, pp. 62-72. Nunnally, J.C. (1988), Psychometric Theory, McGraw-Hill, Englewood Cliffs, NJ. Parasuraman, A., Zeithaml, V.A. and Berry, L.L. (1985), “A conceptual model of service quality and its implications for future research”, Journal of Marketing, Vol. 49 No. 4, pp. 41-50. Parasuraman, A., Zeithaml, V.A. and Berry, L.L. (1988), “SERVQUAL: a multiple-item scale for measuring consumer perceptions of service quality”, Journal of Retailing, Vol. 64 No. 1, pp. 12-40. Parasuraman, A., Zeithaml, V.A. and Berry, L.L. (1991a), “Refinement and reassessment of the SERVQUAL scale”, Journal of Retailing, Vol. 67 No. 4, pp. 420-50. Parasuraman, A., Berry, L.L. and Zeithaml, V.A. (1991b), “More on improving service quality measurement”, Journal of Retailing, Vol. 69 No. 1, pp. 140-7. Robledo, M.A. (2001), “Measuring and managing service quality: integrating customer expectations”, Managing Service Quality, Vol. 11 No. 1, pp. 22-31. Rodman, L. (2001), “You-attitude: a linguistic perspective”, Business Communication Quarterly, Vol. 64 No. 4, pp. 9-25. Srikanthan, G. (1999), “Universities and quality – a worldview”, paper presented at the 11th International Conference on Assessing Quality in Higher Education, Manchester. Srikanthan, G. and Dalrymple, J.F. (2002), “Developing a holistic model for quality in higher education”, Quality in Higher Education, Vol. 8 No. 3, pp. 215-24. Srikanthan, G. and Dalrymple, J.F. (2003), “Developing alternative perspectives for quality in higher education”, The International Journal of Educational Management, Vol. 17 Nos 2-3, pp. 126-36. Srikanthan, G. and Dalrymple, J.F. (2005), “Implementation of a holistic model for quality in higher education”, Quality in Higher Education, Vol. 11 No. 1, pp. 69-81. Sultan, M.P. and Tarafder, T. (2007a), “Critical factors in service quality measurement for private universities: the case of Bangladesh”, Ritsumeikan Journal of Asia Pacific Studies, Vol. 22, pp. 75-98. Sultan, M.P. and Tarafder, T. (2007b), “A model for quality assessment in higher education: implications for ODL universities”, Malaysian Journal of Distance Education, Vol. 9 No. 2, pp. 125-42. Taylor, S. and Cronin, J. (1994), “An empirical assessment of the SERVPERF sale”, Journal of Marketing Theory and Practice, Vol. 2 No. 2, pp. 52-69.
Teas, R.K. (1993a), “Expectations, performance evaluation, and consumers’ perceptions of quality”, Journal of Marketing, Vol. 57 No. 4, pp. 18-34. Yi, Y. and La, S. (2004), “What influences the relationship between customer satisfaction and repurchase intention? Investigating the effect of adjusted expectations and customer loyalty”, Psychology and Marketing, Vol. 21 No. 5, pp. 351-73.
Performancebased service quality model
Further reading Finn, D.W. and Lamb, C.W. (1991), “An evaluation of the SERVQUAL scale in a retailing setting”, in Holman, R. and Solomon, M.R. (Eds), Advances in Consumer Research, Association for Consumer Research, Provo, UT, pp. 483-90. La, V.Q., Patterson, P.G. and Styles, C.W. (2005), “Determinants of export performance across service types: a conceptual model”, Journal of Services Marketing, Vol. 19 No. 6, pp. 379-91. Teas, R.K. (1993b), “Consumer expectations and the measurement of perceived service quality”, Journal of Professional Services Marketing, Vol. 8 No. 2, pp. 33-54.
143
Appendix. Glossary HEdPERF
Higher Education Performance only.
PHEd
Performance-based Higher Education.
SERVPERF
Service Quality (Performance-only measure).
SERVQUAL
Service Quality (Expectation-Perception measure).
Corresponding author Parves Sultan can be contacted at:
[email protected]
To purchase reprints of this article please e-mail:
[email protected] Or visit our web site for further details: www.emeraldinsight.com/reprints