Available Online
J. Sci. Res. 6 (3), 531-541 (2014)
Publications
JOURNAL OF SCIENTIFIC RESEARCH www.banglajol.info/index.php/JSR
Performance Characteristics of UV and Visible Spectrophotometry Methods for Quantitative Determination of Norfloxacin in Tablets L. Chierentin1*and H. R. N. Salgado1 1
School of Pharmaceutical Sciences, São Paulo State University, Araraquara, São Paulo, Brazil Received 19 March 2014, accepted in revised form 31 May 2014 Abstract This work has proposed the development and validation of ultraviolet (UV) and visible (Vis) spectrophotometric methods for the determination of norfloxacin in the tablets. The proposed methods were applied to pharmaceutical formulation and percent amount of drug estimated (96.08% for UV method and 102.65% for Vis method) and was found in good agreement with the label claim. Using the UV method norfloxacin showed an absorption maximum at 277 nm, in 0.1 M hydrochloridric acid medium, whereas for the Vis spectrophotometric method it reacts with chloranilic acid reagent, forming a purple solution with an absorption maximum at 520 nm. The calibrations curves were linear over the working range of 2.0-7.0 μg.mL-1 for the UV method and 90.0-120.0 μg/mL for the Vis method. The linear regression equation for UV method was y = 0.1303x+0.0026 (r2=0.9999) and for Vis method y = 0.0037x-0.0069 (r2 = 0.9948), they proved to be linear. The methods were completely validated according to the International Conference Harmonization (ICH) guidelines, showing good accuracy, precision, selectivity, linearity and robustness. Therefore the both methods were found to be simple, rapid, sensitive, and easily contributing to the quality control of norfloxacin tablets while being interchangeable. Keywords: Norfloxacin; Spectrophotometric methods; Validation; Method Development. © 2014 JSR Publications. ISSN: 2070-0237 (Print); 2070-0245 (Online). All rights reserved. doi: http://dx.doi.org/10.3329/jsr.v6i3.18381 J. Sci. Res. 6 (3), 531-541 (2014)
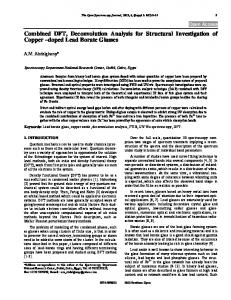
1. Introduction Norfloxacin (NOR) is a broad-spectrum 6-fluoroquinolone with activity on most Grampositive and Gram-negative microorganisms, including Pseudomonas aeruginosa, βlactamase positive, Neisseria gonorrhoeae, gentamicin and aminoglicosides resistant. Norfloxacin was the first quinolone antibacterial with a fluorine atom substituted at the C6 position and a piperazine at the C-7 [1-3]. Chemically, it is 1-ethyl-6-fluoro-1,4dihydro-4-oxo-7-(1-piperazinyl)-3-quinoline carboxylic acid (NOR) (Fig. 1) [4,5]. The primary target of norfloxacin are the bacterial enzymes DNA gyrase or topoisomerase II [6-7]. Norfloxacin is available as: tablets (400 mg) and eye drops to treat conjunctivitis. In most countries, all formulations require a prescription [8]. *
Corresponding author:
[email protected]
532
Performance Characteristics of UV
Several methods have been reported for the determination of norfloxacin in pharmaceutical formulations, biological fluids, raw materials and groundwater. Although many methods including high performance liquid chromatography (HPLC) [9-15], capillary electrophoresis (CE) [16,17], derivative UV spectrophotometry [18,19], and charge transfer complex formation [20-23] have been reported in the literature, the characteristic of UV and visible (Vis) spectrophotometry are unexplored. In some studies, especially in charge transfer complex formation involving chloranilic acid (CL) as a πacceptors might be desirable because the reaction often provides reasonably high sensitivity, a wide dynamic range and stable coloured species [23]. This study reports a comparative development and validation of UV and visible spectrophotometry method for routine analysis and quality control and also a mixture of inactive excipients. The UV method is simplified by dissolving norfloxacin in hydrochloric acid (HCl) 0.1 M and the visible method is based upon direct charge-transfer complex formation of norfloxacin with the chloranilic acid. The aim of this study was to develop and validate of UV and Vis spectrometric methods for the determination of NOR in tablets. The methods are simple, rapid, sensitive and easy to apply. Furthermore, these do not need the costly instrumentation which is required for published capillary electrophoresis and HPLC methods.
Fig. 1. Structure of Norfloxacin (CAS: 70458-96-7).
2. Experimental 2.1. Chemicals and reagents All reagents used were of analytical reagent grade. Acetonitrile and methanol (Merck, Germany). Sodium hydroxide (NaOH) and HCl were obtained from Synth (São Paulo, Brazil). Norfloxacin standard (purity 100%) and pharmaceutical product norfloxacin tablet with a label claim of 400 mg drug was obtained from União Química (Pouso Alegre, Brazil). All solutions were prepared with high quality water obtained from a Milli-Q system (Millipore, Miliford, MA, USA). 2.2. Apparatus The visible method was performed on a UV-Vis recording Spectrophotometer UV-min 1240 (Shimadzu, Kyoto, Japan) and the UV method was performed on a UV-Vis 1800
L. Chierentin and H. R. N. Salgado, J. Sci. Res. 6 (3), 531-541 (2014)
533
double beam spectrophotometer controlled by UV Probe software which was also used to transform the UV spectra obtained (Shimadzu, Kyoto, Japan), using 1.0 cm quartz cells. 2.3. Methods 2.3.1. Preparation of placebo formulation solution A simulated formulation was obtained using the excipients: lactose (42.37%), talc (6.77%), magnesium stearate (3.38%), microcrystalline cellulose (25.42%), povidone (16.94%) and, croscarmelose sodium (5.08%) without norfloxacin [24]. Stock solutions containing 21.91 mg of placebo formulation were dissolved in 25 mL amber volumetric flask with 5 mL of methanol for the visible method and with 0.1 M HCl solution for the UV method, by 30 minutes sonication; the final volume was completed with the same solvent according to each method. 2.3.2. Preparation of standard and sample solution 2.3.2.1. UV method A stock standard solution containing 500 µg mL-1 of NOR was prepared by accurately weighing 12.5 mg of the NOR reference substance into a 25 mL volumetric flask and diluting to volume with 0.1 M HCl solution. This solution was prepared daily. Working standard solutions were prepared immediately before use by suitable dilution of the corresponding stock solution to appropriate concentration levels using purified water. Twenty tablets of (Norfloxacin 400 mg) were used. The tablets were weighed and crushed to a fine powder to obtain a homogeneous mixture. The mass equivalent of 21.91 mg of NOR was weighed into a 25 mL amber volumetrick flask, and 0.1 M HCl solution was added to fill volume. The solution was filtered by 0.2 µm filter to remove solid particles, if any. Appropriate dilutions were made using the purified water. 2.3.2.1 Visible method Chloranilic acid (CL) solution A stock solution of 0.1% of CL was prepared by dissolving 50.0 mg of CL in 50 mL of acetonitrile. The solution was sonicated for 30 minutes, the final volume was then completed with the same solvent. The standard stock solution of NOR: was prepared by transferring 12.5 mg into 25 mL volumetric flask; about 20 mL methanol was added and sonicated for 30 min. The volumetric flask was heated up to 60 °C for about 3 minutes. The flask was filled up to the necessary volume with the same solvent to obtain a final concentration of 500 µg mL-1. Sample solution: Powder equivalent to 21.91 mg of NOR tablets was accurately measured and transferred into 25 mL volumetric flask and sonicated for 30 minutes; the
534
Performance Characteristics of UV
volume was filled up and mixed well. The volumetric flask was heated up to 60 °C for about 3 minutes. The solution was filtered through a 0.2 µm filter to remove particulate matter, if any. The filtered solutions were properly diluted for analysis. 2.3.3. Analytical Conditions 2.3.3.1. UV method The spectrophotometric measure was performed using water as a blank solution. Aliquots of reference substance and sample solutions were transferred into a 10 mL amber volumetric flask and then filled up to the desired volume with water. The absorbance was measured at 277 nm. 2.3.3.2. Visible method Aliquots of reference substance and sample solutions were transferred into 5 mL amber volumetric flasks, followed by an addition of 1 mL CL solution. The flasks were filled up to volume with acetonitrile. The absorbance was measured at 520 nm against a reagent blank prepared simultaneously. 2.3.4. Method validation The methods were validated according to the International Conference on Harmonization (ICH) guidelines for validations of analytical methods [25, 26]. Specificity The specificity was evaluated by comparing the absorbance spectra of samples containing possible interfering substances (excipient products used in tablets production) and samples containing norfloxacin. Linearity The calibrations curves were obtained at six different concentrations of NOR solution for the UV method (2.0 – 7.0 µg mL-1), as well as, six different concentrations for the visible method (95 – 120 µg mL-1). The linearity was evaluated by the least square regression method with triplicate determinations at each concentration level. Precision The intraday and interday precision study was carried out to check the reproducibility of the results. Concentrations of 4.0 µg mL-1 and 110 µg mL-1 of NOR (n=6) was analyzed to ascertain the relative standard deviations (RSD) for the UV and Visible spectroscopic methods, respectively.
L. Chierentin and H. R. N. Salgado, J. Sci. Res. 6 (3), 531-541 (2014)
535
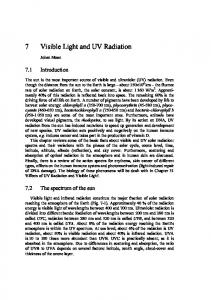
Accuracy To check the accuracy of the proposed methods, recovery studies were carried out at 80, 100, and 120% of the test concentration. The recovery study was performed three times at each level by applying the proposed method to the analysis of known amounts of the reference substance added to the sample solution. The amount of NOR present in the sample was calculated using %R.S.D. In the ultraviolet method, the sample solution contained 2.0 µg mL-1 of NOR, to obtain solutions at concentrations of 3.2; 4.0 and 4.8 µg mL-1. In the visible method, solutions at concentrations of 80; 100 and 120 µg mL -1 were obtained by addition of known amounts of the reference substance to the sample solution containing 70 µg mL-1 of NOR. Robustness The robustness of the method was evaluated by observing the influence of small variations of experimental variables. The robustness of the UV method was evaluated by changing the detection wavelength. The robustness of the visible method was evaluated by changing the amount volume of CL solution added (0.8 – 1.2 mL) and the detection wavelength. The RSDs were determined for each condition. Limit of Detection and Limit of Quantification The LOD and LOQ of NOR in the proposed methods were determined by using calibrations standards. LOD and LOQ were calculated as 3 and 10 σ/S, respectively, where S is the slope of the calibration curve and σ is the standard deviation of the yintercept of the regression equation. 3. Results and Discussion 3.1. Ultraviolet method The proposed UV method allows a rapid and economical quantification of NOR using a 0.1 M HCl. Moreover, the spectrophotometric methods involve simple instrumentation compared with other instrumental techniques. The absorption spectra of NOR in an aqueous solution (final dilution) is shown in Fig. 2. The λmax was found to be at 277 nm. This wavelength was used for all measurements. According to Fig. 2, it can be seen that the excipients use does not interfere in the analysis of NOR, indicating good specificity of the method. The calibration curve was constructed in the range of expected concentrations (2.0 7.0 g mL-1). Beer’s law is obeyed in this concentration range. The value of the determination coefficient was calculated (r2 = 0.9999, y = 0.1303 x + 0.0026, where, x is concentration and y is the absorbance value) indicated the linearity of the analytical curve for the UV method (Table 1).
536
Performance Characteristics of UV
Fig. 2. Ultraviolet absorption spectra of (a) NOR reference substance, (b) NOR pharmaceutical product and, (c) placebo formulation at λmax. = 277 nm.
The LOD and LOQ were found to be 0.67 and 2.03 μg mL -1, respectively (Table 1). According to ANOVA linear regression is possible without deviation from linearity. The experimental values obtained for the determination of NOR in samples, indicated a satisfactory inter-day variability (R.S.D. of 0.68%, with amount 96.04%) and intermediate precision (R.S.D. 0.84%, with amount 99.48%) (Table 2). Table. 1. Analytical parameters for determination of NOR using the proposed methods. UV Spectrophotometry
Visible Spectrophotometry
Analytical wavelength (nm)
277
520
Linearity range (µg mL-1)
2.0 – 7.0
90 – 120
Regression equation (A=aC+B)
y = 0.1303x + 0.0026
y = 0.0037x – 0.0069
Slope (a)
0.1303
0.0037
Intercept (b)
0.0026
0.0069
LOQ (µg mL-1)
2.03
66.82
-1
LOD (µg mL )
0.67
22.05
Determination coefficient (r2)
0.9999
0.9948
L. Chierentin and H. R. N. Salgado, J. Sci. Res. 6 (3), 531-541 (2014)
537
Table. 2. Inter-day and between analysts precision data of UV and Visible methods for NOR. Method
Sample
Inter-Day (RSDa) (%)
Between Analysts (RSDa) (%)
UV Spectrophotometry
1
0.68
0.61
2
0.84
0.60
Visible Spectrophotometry
1
1.19
0.62
2
1.42
1.12
a
Relative standard deviation.
A good accuracy of the method was verified with a mean recovery of 98.33% (Table 3). Variations in the wavelength for the robustness evaluation showed R.S.D. 0.41% (Table 4). Table. 3. Accuracy of UV and Visible methods for NOR in pharmaceutical products. Method
Added (µg mL-1)
Recovered (µg mL-1)
Recoverya (%)
UV Spectrophotometry
3.2
3.18
97.18
4.0
4.00
99.50
4.8
4.76
98.30
Visible Spectrophotometry
10.0
10.04
100.46
30.0
30.84
102.80
50.0
50.43
100.87
a
Mean of three replicates
Table. 4. Robustness evaluation of UV and Visible spectrophotometric methods for NOR in pharmaceutical products. Method
Variable
Investigated range
Norfloxacina (%)
RSDb,a (%)
UV Spectrophotometry
Wavelenght (nm)
275
96.90
1.95
Visible Spectrophotometry
Wavelenght (nm)
Volume of CL solution (mL)
a
b
Mean of three replicates; Relative standard deviation.
277
96.49
279
100.00
522
103.12
520
102.68
518
102.91
1.2
102.59
1.0
102.82
0.8
102.58
0.21
0.13
538
Performance Characteristics of UV
3.2. Visible method Proper wavelength selection of the methods depends upon the nature of the sample and its solubility. Acetonitrile was found to be the best solvent for the CL method, other solvents like ethanol or methanol were unsuitable due to limited solubility for NOR. Acetone was unsuitable, as CL has limited solubility in it. Also, Chloroform was unsuitable as the complex formed showed limited solubility in it. The visible spectrophotometric method is based on the reaction with NOR as a πelectron donor with CL as π-acceptor, resulting in a highly colored complex. Using CL, the purple color immediately reaches its maximum intensity at room temperature and remains stable up to 30 min. No change in color intensity was detected upon heating until 55 °C for 3 min. Heating for a longer time leads to a decrease in intensity 1,0 mL of CL solution was found to be sufficient for production of maximum absorbance. The wavelength of 520 nm was chosen due to the adequate molar absorptivity of NOR in this region and to minimizes possible interference from other compounds and solvents in the samples. The analytical curve constructed for NOR was found to be linear in the 90 - 120 µg -1 mL range. The value of the calculated determination coefficient (r2 = 0.9948, y = 0.0037 x - 0.0069) indicated the linearity of the analytical curve for the visible method. The precision, evaluated as the repeatability of the method, was studied by calculating the R.S.D. for six determinations of the 110 µg mL-1 solution, performed on the same day and under the same experimental conditions. The R.S.D. was 1.42%. The LOD and LOQ calculated were 22.05 and 66.82 µg mL-1, respectively (Table 1). The precision, evaluated as the repeatability of the method, was studied by calculating the RSD for six determinations of 110 (µg mL-1), performed on the same day and under same experimental conditions. The intermediate precision was assessed by analyzing two samples of the pharmaceutical formulation on three different days (inter-day). The mean values obtained were 102.65 and 102.71% with RSD 1.19 and 1.42%, respectively. The between analysts precisions were determined by calculating the mean values and the RSD for the analysis of two samples of the pharmaceutical formulation by two analysts. The mean values were found to be 102.17 and 102.43% with R.S.D. 0.62 and 1.12%, respectively (Table 2). The accuracy was assessed from three replicate determinations of three different solutions containing 10, 30 and, 50 µg mL-1. The absolute mean values obtained for NOR are shown in the Table 3 with a mean value 101.37%, demonstrating that the method is accurate within the desired range. The results and the experimental range of the selected variables evaluated in the robustness assessment are given in Table 4. No interference was observed in the determination of NOR in the presence of the common excipients of the tablets, according to the placebo solution showed previously, indicating good specificity (Fig. 3).
L. Chierentin and H. R. N. Salgado, J. Sci. Res. 6 (3), 531-541 (2014)
539
Fig. 3. Visible absorption of (a) NOR reference substance, (b) NOR pharmaceutical product and, (c) placebo formulation at λmax. = 520 nm.
3.3. Application to pharmaceuticals Both methods were applied successfully to the analysis NOR in tablets. The quantitative results using UV and visible methods are shown in Table 5. There was no statiscally significant difference between the mean values, although the visible method showed a slightly higher % R.S.D. value compared with to the UV method. Furthermore, the amount of NOR calculated by both methods was within the range between 90 and 110%, recommended by USP (Table 5). The procedures therefore are suitable for the determination of NOR in pharmaceuticals with adequate accuracy and precision. Table. 5. Determination of norfloxacin in pharmaceutical products by the UV and Visible spectrophotometric methods. Label claim
Experimental amount
Norfloxacin
Norfloxacina
Method
Sample
mg per tablet
mg
Recovery (%)
RSD (%)b
UV Spectrophotometry
1
400
384.32
96.08
0.61
2
400
386.76
96.69
0.23
Visible Spectrophotometry
1
400
410.60
102.65
1.42
2
400
410.84
102.71
1.09
a
b
Mean of three replicates; Relative standard deviation
4. Conclusion Analytical laboratories require accurate results, faster and more economically than ever before. This is especially true for traditional methods like spectrophotometric assay. In comparison with chromatography techniques those methods also proved to be rapid, accurate, and reproducible. Howerver, the principal advantage of the proposed methods is
540
Performance Characteristics of UV
their suitability for the routine quality control of norfloxacin alone and in tablets, without fear of interference caused by the excipients excepted to be present in tablets. In comparison with the existing photometric methods, the proposed methods, especially UV are simple, faster, cheaper and much more sensitive and accurate. In addition both methods are interchangeable. Acknowledgement The authors are thankful to União Química Pharmaceuticals (Pouso Alegre-Brazil) for providing secondary standard and sample of norfloxacin and also to FAPESP (Fundação de Amparo à Pesquisa do Estado de São Paulo, project 2010/13335-2, and PADDC-FCF, FUNDUNESP (São Paulo-Brazil) for the financial support. Author(s)’ Statement(s) Competing Interests The author(s) declare(s) no conflict of interest. References 1. R. N. Goyal, A. R. Rana, and H. Chasta, Bioelectrochemistry 83, 46 (2012). doi.org/10.1016/j.bioelechem.2011.08.006 2. Espinosa-Mansilla, M. Peña, D. G. Gómes, and F. Salinas, J. Chromatogr. B. 822, 185 (2005). doi.org/10.1016/j.jchromb.2005.05.045 3. R. N. Rao, and V. Nagaraju. J. Pharm. Biomed. Anal. 34, 1049 (2004). doi.org/10.1016/j.jpba.2003.11.009 4. J. L. Vílchez, O. Ballesteros, J. Taoufiki, G. Sánchez-Palencia, and A. Navalón. Anal. Chim. ACTA. 444, 279 (2001). doi.org/10.1016/S0003-2670(01)01238-7 5. M. Córdoba-Díaz, M. Córdoba-Borrego, and D. Córdoba-Díaz. J. Pharm. Biomed. Anal. 18, 865 (1998). 6. K. A. Musa, and L. A. Eriksson. J. Phys. Chem. A. 113, 10803 (2009). doi.org/10.1021/jp904671s 7. H. Lode, G. Hoffken, M. Boeckk, N. Deppermann, K. Borner, and P. Koeppe. J. Antimicrob. Chemother. 26, 41 (1990). 8. B. Meinl, J.M. Hyatt, A. Forrest, S. Chodosh, and J.J. Schentag. Int. J. Antimicrob. Agents. 16, 273 (2000). 9. The British Pharmacopoeia (Her Majesty´s Stationery Office, London, 2010) pp. 671-673. 10. The United States Pharmacopeia. 34th Edition, The National Formulary, 29th Edition, 2011, The Official Compendia of Standards (The Pharmaceutical Press, London, UK, 2009) pp. 44-48. 11. V.F. Samanidou, C.E. Demetriou and I.N. Papadoyannis. Anal. Bioanal. Chem. 375, 623 (2003). 12. N. M. Kassab, A. K. Singh, E. R. Kedor-Hackmam, and M. I. Santoro, Braz. J. Pharm. Sci. 41, 507 (2005). doi.org/10.1590/S1516-9332200500014 13. B. Miseljic, G. Popovic, D. Agbaba, S. Markovic, B. Simonovske and l. Vovk. J. AOAC Int. 91, 332 (2008). 14. L. Chierentin and H. R. N. Salgado, J. Chromat. Separation. Techniq. 4, 171 (2013). doi.org/10.4172/2157-7064.1000171 15. A. S. Maia, A. R. Ribeiro, C. L. Amorim, J. C. Barreiro, Q. B. Cass, P. M. L. Castro, and M. E. Tiritan, J. Chromatogr A, 1333, 87 (2014).
L. Chierentin and H. R. N. Salgado, J. Sci. Res. 6 (3), 531-541 (2014)
541
16. Y. M. Liu, J. T. Cao, W. Tian, and Y. L. Zheng, Electrophoresis. 29, 3207 (2008). doi.org/10.1002/elps.200800048. 17. X.D. Shao, H.Y. Liu, X.F. Gao, W.Q. Chen and Z.H. Song. Chem. Pap. 61, 353 (2007). 18. C.S. Sastry, K.R. Rao and D.S. Prasad. Talanta. 42, 311 (1995). 19. P.E. Froehlich and E.E.S. Schapoval. Rev. Ciênc. Farm. 12, 167 (1990a). 20. P.E. Froehlich, E.E.S. Schapoval and S. Bortolan. Rev. Ciênc. Farm. 12, 171 (1990b). 21. P.E. Froehlich and E.E.S. Schapoval. Rev. Ciênc. Farm. 12, 177 (1990c). 22. S. L. Dong, J. H. Hee, K. W. B. P. Kun, K. C. Jung, and H. K. Jae, J. Pharm. Biomed. Anal. 12, 157 (1994). doi.org/10.1016/0731-7085(94)90025-6 23. K. Kuldeep, K. Ashwini, K. M. Ashok, S. Baldev, and A. L. J. Rao, Critical Rev. Anal. Chem. 38, (2008). doi.org/10.1080/10408340701804400 24. R.C. Rowe, P.J. Sheskey and M.E. Quinn. 6th ed. (Handbook of Pharmaceutical excipients. London: Chicago Pharmaceutical Press, 2009) p. 918. 25. International Conference on Harmonization (ICH). ICH Harmonized Tripartide Guideline. Topic Q2(R1). Validation of Analytical Procedures: Text and Methodology. Geneva, Swtzerland 2005. 26. S. B. Amir, M. A. Hossain, and M. A. Mazid, J. Sci. Res. 6 (1), 133 (2014). http://dx.doi.org/10.3329/jsr.v6i1.14879