potential of such applications built on Android platforms by using a combination of .... a 1.6 GHz Intel® Atom⢠processor running CentOS 4.1. Linux kernel 2.6.
Performance Characterization and Optimization of Mobile Augmented Reality on Handheld Platforms Sadagopan Srinivasan, Zhen Fang, Ravi Iyer, Steven Zhang, Mike Espig, Don Newell, Daniel Cermak, Yi Wu, Igor Kozintsev, Horst Haussecker Intel Corporation
Abstract — The introduction of low power general purpose processors (like the Intel® Atom™ processor) expands the capability of handheld and mobile internet devices (MIDs) to include compelling visual computing applications. One rapidly emerging visual computing usage model is known as mobile augmented reality (MAR). In the MAR usage model, the user is able to point the handheld camera to an object (like a wine bottle) or a set of objects (like an outdoor scene of buildings or monuments) and the device automatically recognizes and displays information regarding the object(s). Achieving this on the handheld requires significant compute processing resulting in a response time in the order of several seconds. In this paper, we analyze a MAR workload and identify the primary hotspot functions that incur a large fraction of the overall response time. We also present a detailed architectural characterization of the hotspot functions in terms of CPI, MPI, etc. We then implement and analyze the benefits of several software optimizations: (a) vectorization, (b) multi-threading, (c) cache conflict avoidance and (d) miscellaneous code optimizations that reduce the number of computations. We show that a 3X performance improvement in execution time can be achieved by implementing these optimizations. Overall, we believe our analysis provides a detailed understanding of the processing for a new domain of visual computing workloads (i.e. MAR) running on low power handheld compute platforms.
1. Introduction Smart phones and mobile internet devices (MIDs) have gained widespread popularity by placing compute power and novel applications conveniently in the hands of end users. The Apple iPhone serves as a good example of this usage trend and success. With the recent introduction of the Intel’s low-power general purpose Atom™ processor family, future MIDs will enjoy a larger base of general-purpose applications that will run at much higher performance and power-efficiency. Emerging visual computing applications such as image/facial recognition, computational photography and motion tracking are quickly entering the mobile domain while nascent usage cases including virtual worlds and extreme 3D gaming are just around the corner. One usage model that has gained significant interest to end-users and handheld providers is Mobile Augmented Reality (MAR). An instance of the MAR usage model is best described with an example as follows. Consider a tourist walking the streets of a foreign city and scanning the surroundings using the camera in their smart phone (or MID). The smart phone should recognize
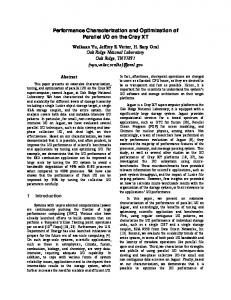
the objects (and/or buildings) in the camera image and provide contextual data overlaid on the object in the display. For example, if you are walking in the streets of India (city of Jaipur) and point your MID camera at an interesting building (shown in Figure 1(a)), the MID should display historical information about the building. Similarly, walking inside such a building and pointing the camera towards a unique object should provide the user with contextual information about it (example shown in Figure 1(b)).
Hawa Mahal, 1799 (Palace of Winds) “wikipedia-info”
Hawa Mahal, 1799 (Palace of Winds) “MID-Info-link”
(a) A building in a foreign city
Hawa Mahal, 1799 (Palace of Winds) “wikipedia-info”
Terracotta bull (2000 B.C. artifact) “MID-Info-link”
(b) A sculpture Figure 1. Mobile Augmented Reality (Example Illustrations) Instances of MAR usage models and applications are already emerging today. For example, Wikitude [[1]] shows the potential of such applications built on Android platforms by using a combination of location, webcam and Qype content to achieve augmented reality. There are several other efforts also already investigating MAR applications [[2]][3][4]. These examples clearly highlight the future potential of augmented reality in general.
Data locally available on MID
SURF Pic from camera
Interest Point Detection
Descriptor Generation
Match Against Database Files
Each circle is a detected IP described with a numeric vector.
Match & Content
White lines denote pairs of matching points.
Figure 2. MAR System Flow More specifically, it highlights the need to understand the performance characteristics of MAR workloads on low-power handheld devices. In this paper, we address this by analyzing the compute and memory requirements of a MAR workload on an Intel® Atom™ platform. In this paper, we take a reference software implementation [8] of a MAR application and characterize its various phases. We take the above MAR usage case, analyze the compute requirements, identify the key hotspot functions and propose software optimizations. To the best of our knowledge, this is the first work with detailed performance analysis of MAR workloads on low power handheld platforms with generalpurpose cores (i.e. Intel® Atom™). The main contributions of this paper are: 1. Detailed compute and cache characterization of an instance of an emerging MAR workload. 2. Analysis of the key hotspot functions of MAR in terms of their scaling characteristics. 3. Analysis of performance optimizations such as vectorization, multi-threading, integerization, and cache conflict reduction on the platform. The rest of this paper is organized as follows. We first describe the image recognition algorithm that form the basis of the usage case and provide a detailed overview of the Speeded Up Robust Features (SURF) algorithm and the match algorithm used in the MAR application. Section 3 describes the profiling results of the base MAR application on an Intel® Atom™ processorbased platform and analyzes the key hotspot functions. Section 4 describes a set of software optimizations that we implemented and show their associated performance benefits. We discuss the related work in section 5, and conclude in section 6 by outlining the direction for future work on this topic.
2. MAR Application Overview In the MAR usage scenario, we start with a query image from the camera. The intent is to compare this query image against a set of pre-existing images in a database for a potential match. While our focus is on still images in this work, our goal is to achieve real-time execution for a video based MAR. The stillimage MAR application essentially does the following: (a) acquire/capture the image, (b) recognize objects by computing interest points in the image, (c) match to a pre-established set of images in a database and (d) display relevant meta-data overlaid on the object in the screen. Our initial analysis shows that the first and last step (image capture and information overlay) are negligible in execution time and therefore we focus primarily on the image recognition and match processing which is further decomposed into three basic steps as illustrated in Figure 2: (a) Interest-point detection: identify interest points in the query image (b) Descriptor generation: create descriptor vectors for these interest points (c) Match: compare descriptor vectors of the query image against descriptor vectors in the database There are several algorithms that have been proposed to detect interest points and generate descriptors. The most popular algorithms amongst these are variants of SIFT (Scale-Invariant Feature Transform) [5] and SURF (Speeded up Robust Features) [6]. In this paper, we chose the SURF algorithm for our MAR application because it is known to be fast and has sufficient accuracy for the usage model of interest. In addition, previous researchers have also used SURF successfully for mobile phones for MAR [7]. Figure 2 shows an illustration of the use of SURF for detecting interest points and matching against other images in a database. Below we provide a brief
explanation of the SURF algorithm (although we refer the reader to [6][9] for a more detailed description). Interest point detection: SURF uses an interest point detector based on Hessian matrix. Integral image is computed from the input image and speeds up the calculation of any rectangular area. Integral image for a given point (x,y) in image I can be described as follows: I
∑
( x, y ) =
i≤ x j≤ y
∑ ∑ I (i , j ) i=0 j =0
The Hessian computation for a point Х = (x, y) in the image at a scale of σ is shown below. ⎡ L xx ( X , σ ) L xy ( X , σ ) ⎤ H ( X ,σ ) = ⎢ ⎥ ⎣ L xy ( X , σ ) L yy ( X , σ ) ⎦ where the Lxx, Lxy and Lyy are second-order Gaussian derivatives. In SURF, the second-order Gaussian derivates are approximated based on box filters and are denoted as Dxx, Dxy and Dyy instead. The Hessian determinant is computed from these terms as follows: 2 det( H approx ) = D xx D yy − 0 . 9 D xy The Hessian matrix is computed for different filter sizes, where the filter size represents the region around which the matrix determinant is computed, with various scale factors. The process is repeated for various octaves. After calculating the Hessian matrix at different scale factors (different octaves and filter sizes), the interest points are chosen by computing the local maxima (in a 3x3x3 neighborhood) in scale and image space (i.e. Hessian determinant value of a point is compared against all the neighboring values in the current and neighboring scales).
Descriptor Generation: Once the interest points are computed, the next step is to tag the interest point with descriptor vectors. Descriptor vector computes the Haar wavelets, which is the coarse grain pixel contrast of a rectangular region, around a given interest point. Typically 64 or 128 descriptor vectors are used to represent one interest point. In this work we use only on 64 element descriptor. The first step in computing descriptor vector is to determine a reproducible orientation that is identified based on a circular region surrounding the interest point. To assign the orientation, Haar wavelet responses (in x and y direction) are computed in a circular neighborhood of 6s (where s is the scale factor at which the interest point was identified). The dominant orientation is estimated by calculating the sum of all responses within a sliding orientation window (covering an angle of π/3). The longest vector (a sum of horizontal and vertical responses) is chosen as the dominant orientation. After computing the dominant orientation, the descriptor vector is computed as follows. A square region of size 20s (where s is the scale factor at which the interest point was identified) is chosen around the interest point and oriented along the dominant orientation. The region is split up into smaller 4x4 square sub-regions and Haar wavelet responses (dx in the x and dy in the y direction) are calculated within
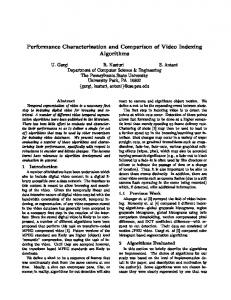
each of the sub-regions at 5x5 regularly spaced sample points. The wavelet responses are summed up in each region and the following four dimensional vectors per 4x4 region forms the descriptor vector: V = (∑ d x , ∑ d y , ∑ d x , ∑ d y ) Such a 64 element descriptor vector is used to describe each interest point in any given image and is used as the basis for the matching step below. We also add the sign of a Laplacian, which is the trace of the Hessian matrix, to the descriptor vector to speed up the matching process. For interest point detection and description, we used the OpenCV implementation [8] of SURF since it already contains sufficient optimizations as compared to other open source code [9]. The match algorithm is independent of the algorithm used for interest point detection and description. In this paper we employ a brute force match algorithm as described below. Matching : In order to match two images (query and database), we use a brute force match algorithm that exhaustively compares a pair of interest point descriptor vectors from each image based on the Euclidean (a.k.a. L2) Database descriptors
Query descriptors
# of interest points
Match
64 elements
64 elements
Figure 3. Brute Force Match Process Figure 3 illustrates how a query image’s interest point descriptors from the camera are matched against a candidate image from the database. Each 64-element descriptor represents an interest point detected in the image. The key function is a simple loop visualized in Figure 3. assuming 64 elements per descriptor. For each descriptor of the query image, Euclidean distance is calculated from all descriptors of a database image. Record the minimum and second minimum values of these distances. A match for a query descriptor is found in the database image if min < 0.6 * second min. Database images are then ranked based on how many matches they have for the query image, and the highest ranked candidate is selected as the winner. It should be noted that several other match algorithms are available, such as ANNmatch [10], but our initial analysis is based on the use of brute force match implementation. A detailed analysis of match algorithms is considered as future work.
In this section, we first analyze the base software implementation (OpenCVSurf + brute force match) running on the Intel® Atom™ processor-based platform for various image resolutions, different image recognition parameters (blob threshold) and different number of database images to match against. Our base image was that of a building with 1280x960 resolution (1.1 Megapixels). This image was downscaled to lower resolutions (1024x768, 800x600, 640x480) to maintain image consistency across resolutions and study the impact of resolution on performance. 3.1 Platform Configuration We started by analyzing the base software implementation on a 1.6 GHz Intel® Atom™ processor running CentOS 4.1 Linux kernel 2.6. The CPU had hyper-threading enabled supporting 2 hardware threads. The core has 24KB L1 data cache and 32KB instruction cache. The platform had 512KB unified L2 cache with 8-way associativity. The front-side bus was running at 400 MHz and was connected to 1GB of DDR2-533 DRAM.
execution time (~20% for 640x480 and ~10% for 1 Mpixel resolution when matching against 10 images). The smallest component of execution time is the descriptor generation. In the next subsection, we will look at the characteristics of each of these components in more detail. As we shall see, in addition to image resolution and database image, the execution time also depends heavily on the number of interest points generated. 100000 img= 640x480 Time (ms) in log scale
3. MAR Application Performance
10000
img=1280x960
1000 100 10 1 0
3.2 Execution Time Breakdown
As shown in the figure, the execution time depends on two parameters: i) image resolution and ii) number of database images in the following way: (i) For small images (640x480 = VGA image), the execution time ranges from approximately 400 ms for matching one image to 3 seconds for matching 20 images. (ii) For larger image resolution (1280x960 = 1.1 Megapixel image), the execution time ranges from approximately 1.5 seconds (for matching one image) to 36 seconds to match 50 images. Overall, it should be noted that these execution times (from several hundreds of milliseconds to several seconds) are quite large even when considering a still image. Furthermore, since future usage models are considering recognition of moving images (panning across an outdoor scene for instance), it is highly desirable for the processing to be in the order of tens of milliseconds as opposed to seconds. The breakdown of execution time (shown in Figure 4(b) for 10 and 20 database images) shows that match time consumes the largest fraction and increases with the number of database image (about 85% to match against 50 images). The interest point detection phase consumes the next major component of
50
(a) Overall execution time 10000 Total time (ms), in log scale
Figure 4(a) shows the overall MAR execution time (in LOG scale) as a function of two image resolutions (640x480 and 1280x960) and 4(b) shows the execution time (in LOG scale) break down for various number of database images to match (1, 10, 20 and 50). We only use a small number of database images to match against, because location information (such as GPS) localizes the search region when a user points the handheld to an outdoor location.
1 10 20 Number of database images
match descriptor gen
1000
IP detection
100
10
1 0
1 10 20 Number of DB images to match against
50
(b) Execution time breakdown for 640x480 resolution Figure 4. MAR Execution time 3.2.1 Scaling Behavior In order to understand the behavior of the different MAR execution components, we now investigate the execution time of each phase (interest point detection, descriptor generation and match) and analyze its scaling as a function of the parameters it depends on. We start with interest point detection. As described in Section 2, when detecting interest points, each pixel in the image is used to compute the integral image, then the Hessian matrix followed by local maxima. As a result the interest point detection is dependent on the number of image pixels. Figure 5(a) shows the execution time of interest point detection as a function of image resolution (i.e. number of pixels per image). We observed that the interest point detection time increased from 183ms for 640x480 resolution to 786ms for a 1280x960 image. The only anomalous execution time is for an image
resolution of 1024x768. For all others, the execution time follows linearly with the number of pixels. For instance, the number of pixels increases by a factor of 1.56X when moving from 640x480 to 800x600 resolution, and the execution time increases from 183ms to 287ms (1.57X). In the software optimizations section (section 4.2), we will explain the 1024x768 resolution execution time overhead that is introduced in the cache hierarchy and how we address it in software.
Time (ms)
Interest Point Detection 900 800 700 600 500 400 300 200 100 0 640x480
800x600
1024x768
1280x960
Image resolution
(a) Interest Point Detection = f(image resolution)
Finally, the match portion of the execution time is dependent on the number of database images to match against and correspondingly to the number of interest points to be compared across images. This is because matching is done for each query image interest point against all database images interest points. In Figure 5(c), we fixed the blob threshold to vary the number of interest points. We matched a query image with various number of data base images that had similar number of interest points. In our experiments, the query image had 533 and 800 interest points. The figure shows that execution time depends entirely on the number of matches when other parameters are fixed. The match time scales linearly from 55.5ms for one image to 555ms for 10 images, and is independent of the query image matching the database image. The execution time also increases from 55.5ms to 83ms for matching one image as the number of interest points increases from 533 to 800. IP detection Descriptor Gen Match
3.5
700 600 500 400 300 200 100 0
3 2.5 2 CPI
Time (ms)
Descriptor Generation
interest points are detected and therefore the execution time for descriptor generation increases. The descriptor generation time increases from 200ms for 820 interest points to 648ms for 2905 interest points (i.e. 3.24X increase in execution time for 3.54X increase in number of interest points).
1.5
820
1207
1879
2905
Number of Interest Points
1 0.5
(b) Descriptor Generation = f(interest points)
0 640x480
800x600
1280x960
(a) MAR components Clocks per Instruction
5000 IP=533
4000
IP=800
3000 2000
L1D MPI
Total time (ms)
1024x768
Image Resolution
Match
1000 0 1
10
20
50
# of DB images
(c) Match time = f(#images to match, interest points)
Figure 5. Execution Time Scaling of MAR Components The next phase in the execution is descriptor generation. As we explained in Section 2, descriptor generation is dependent on the number of interest points as each one is tagged with 64 descriptor elements. This is demonstrated in Figure 5(b). The number of interest points detected is controlled by the blob threshold parameter in the software, which denotes the minimum pixel intensity required for an interest point. The execution time shown is for various number of interest points for 640x480 image. As the blob threshold is reduced, more
0.18 0.16 0.14 0.12 0.1 0.08 0.06 0.04 0.02 0
IP detection Descriptor Gen Match
640x480
800x600
1024x768
1280x960
Image Resolution
(b) L1 Data Misses per Instruction
Figure 6. Architectural Characteristics of MAR Components Figure 6 shows the CPI and L1D MPI behavior for the different execution phases of the MAR workload. These statistics were collected from the platform hardware counters using Vtune utility [11]. The L2 MPI because is negligible for all the functions. As shown in the Figure, match processing has the highest CPI and L1 MPI. The only exception to this is the
180
Match
Bandwidth (MB/Sec)
160
Descriptor
140
IP detection
120
0.7 Normalized Execution time
interest point detection at 1024x768 resolution which was previously shown to have an unexpected execution time. This occurs due to a high number of L1 cache conflicts which we will describe and address in the next section. We can also observe that the CPI is high for all the functions (ranging from 1.7 to 2.7).
IP detection
0.6
Descriptor
0.5
Match
0.4 0.3 0.2 0.1 0 640x480
100
1280x960
Image Resolution
80
Figure 8. Normalized execution time with frequency scaling
60 40 20 0 640x480
800x600
1024x768
1280x960
Image Resolution
Figure 7. Memory Bandwidth of MAR Components Figure 7 shows the memory bandwidth of various MAR components for different resolutions measured using Vtune [11]. The total bandwidth of the application never exceeds 170 MB/Sec. The IP detection bandwidth varies from 75MB/Sec for the lowest resolution to about 95MB/Sec for 1MPixel. The dataset size increases with resolution and so does the computation. Hence the small variation in bandwidth for different resolutions as the computation vs. communication overhead dominance changes for a given resolution. The bandwidth for descriptor generation varies from about 30MB/Sec to 70MB/Sec. The bandwidth is low for the smallest resolution due to fewer number of interest points, and is lowest at 1MPixel due to computation time dominating the communication time. Match has very few memory accesses as its working set size can easily fit in L2 as shown in the next section. On the whole, the application is not memory bound and all the components are computationally bound. We further validated the computation intensive nature of the algorithm by varying the CPU frequency. We scaled down the frequency from 1.6GHz to 1GHz and measured the execution time. Figure 8 shows the normalized execution time (1.6GHz normalized to 1GHz) for the various MAR components for two image resolutions (640x480 and 1280x960). We observed that the execution time for all phases reduced by about 40% (directly proportional to reduction in frequency). 3.2.2 MAR Cache Behavior In this section we will show the L1 (data) and L2 cache behavior, in terms of misses per instruction, of the workload using CMPsim, a pin based cache simulator [18]. We varied the L1 cache from 32KB to 512KB with 8-way associativity and L2 cache from 512KB to 2MB with 8-way associativity.
Figure 9. L2 MPI for two image resolutions Figure 9 shows the L2 misses per instruction (MPI) for the various L2 cache sizes (with 32KB L1D) for two different resolutions. Interest point detection has the highest L2 MPI with about 3 misses for every 1000 instructions. MPI reduces by only 20% as the cache size is increased from 512KB to 2MB indicating a streaming nature for interest point detection phase. Interest point detection brings in new image pixels, identifies interest point and brings in the next data set. Match has the lowest MPI for both resolutions and corroborates the results shown earlier in Figure 8 using Vtune. MPI for descriptor generation is in between match and interest point detection and it is about 3 misses every 10,000 instructions. This is due to the fact that descriptor generation operates on the data brought in during the interest point detection phase. Figure 10 shows the L1D MPI for various cache configurations. The cache response is significantly different from the L2 MPI for various phases. L1D MPI reduces by about 50% for interest point detection as the cache size is increased from 32KB to 64KB but then remains steady for larger caches reiterating the streaming nature. Interestingly, L1D MPI is maximal for matching phase of the algorithm at 32KB and reduces significantly as the cache size is increased. The working set size for match is around 128KB. The match algorithm traverses through 64 descriptors for each interest point, which is 256B for each interest point, and does the computation as show in Figure 4. For 500 interest points, this
is about 125KB (500*256B). Hence descriptor generation working set fits in a 128KB cache.
Figure 10. L1D MPI for 640x480 image 4. MAR Software Optimizations Implemented We applied a number of software optimizations for the various MAR phases and implemented them to improve performance. 4.1 Optimizations to Interest Point Detection
(ii) Basic Compute Optimization: After examining the CPI of interest point detection and the associated code, we identified and applied basic compute optimizations as follows: (a) The Hessian matrix was computed with Gaussian weights for each lobe. Since the lobes are in a ratio of 1:2:1, we reduced the computation by applying the weights in the end. (b) We also modified the computation of second order Gaussian derivative. These optimizations improved the interest point detection (across all image resolutions) by about 18% as the number of move, add and floating point multiplication operations were reduced. The results are shown in Figure 12. Interest Point Detection
Time (ms)
We applied the following three optimizations to interest point detection: (a) data padding to reduce conflict misses in L1D, specifically targeted towards 1024x768 image resolution, (b) compute optimizations in the code and (c) threading to take advantage of 2-way multithreading available in the Intel® Atom™ processor.
are the ones touched in an innermost loop. The 16x10 rectangle (marked by solid lines) is the working set. Without losing generality, let’s assume that the solid lines are the aligned 64-byte boundaries. The Intel® Atom™ core’s L1 data cache is 24 KB with 6-way associativity. In such a cache, memory accesses with strides equal to an integer multiplication of 24K/6= 4096 bytes will all map to the same cache set and will evict each other when the associative ways are not sufficiently big. In our example, the 10 blocks of data maps to the same cache set which can only hold 6 blocks at a time. To address this problem, we increased the array size in the column dimension by 16 (this aligns the image in cache as the storage increases by 16*4=64bytes). For 1024x768 image, this effectively pads the array to a size of 1040x768. By doing so, the accesses automatically get skewed and no longer map to the same cache set. As shown in Figure 12, this optimization reduces the interest point detection time for 1024x768 resolution from ~800ms to 500ms.
900
Unoptimized
800 700
Cache Optimized
600 500 400 300
Cache+Compute Optimized Cache+Compute+Threading optimized
200 100 0
640x480
800x600 1024x768 Image Resolution
1280x960
Figure 12. Interest Point Detection Optimizations
Figure 11. Cache access pattern for IP detection (i) Cache Optimization: As observed in Figure 7(b), the increase in L1 MPI for 1024x768 resolution causes a significant increase in the execution time for interest point detection. This occurs due to address conflicts in the L1 cache. The image data structure is arranged contiguously (i.e. linearly in memory) with 1024 columns and 768 rows of 4-byte elements (integers). Figure 11 shows a typical “snapshot” of the data accesses in Hessian matrix computation during IP detection. Each square represents a pixel, and the grey pixels
(iii) Multi-threading: The multithreading support on the Intel® Atom™ processor allows multi-threaded programs to mitigate the performance impact of in-order execution. We experimented with multithreading to study the performance benefits for MAR processing. To take advantage of multithreading (2 hardware threads) available in Intel® Atom™, we threaded the interest point detection via POSIX and OpenMP. Both approaches yielded similar results. We threaded the interest point detection across the octave layers, descriptor generation across interest points, and database matching across database images as shown in Table 1.
Multi-threadedDescriptor Generation 500 1T
2T
Time (ms)
400 300 200 100 0 640x480
800x600
1024x768
1280x960
Image Resolution
Figure 13. Descriptor Generation optimizations MAR Function Interest Point Detection
Parallelized across…
Two-thread Example
Different octave layers for each octave
For each octave, T1 does layer 1, 3 … T2 does layer 2, 4...
Descriptor Generation Match
Different interest points (IP’s)
T1 describes IP 1, 3… T2 describes IP 2, 4…
Different database files
T1 matches query image against DB files #1, #3, #5…. T2 matches query image against DB files #2, #4, #6….
Table 1. Parallelization approach for various MAR phases Figure 12 show that multithreading improves execution time by 35% for interest point detection. Overall, interest point detection was optimized by about 60% via the above three types of optimizations. 4.2 Optimizations to Descriptor Generation After examining the code, we primarily applied multithreading optimizations to descriptor generation. Descriptor generation is dominated by floating point operations which, when compared with their integer counterparts, typically have longer latencies and more limited throughput. This effect is especially evident in an in-order processor, since independent instructions that would be able to fill the instruction pipeline on an out-of-order processor cannot be issued. By executing independent threads simultaneously, hyper-threading increases instruction issue width and helps to remove some of the pipeline bubbles. Figure 13 shows that multi-threading improve execution time by about 30% for descriptor generation. 4.3 Optimizations to Match We applied three different performance optimizations for matching: (a) data type and precision changes to reduce processing overhead, (b) vectorization, and (c) multithreading. Figure 14 captures all these optimizations.
(a) Data type and precision changes In the baseline code, the descriptor vectors are stored in singleprecision floating point values in the candidate images database. While descriptors in 32-bit floating point format have higher precision, in reality such precision is usually not necessary. The reason is that MAR primarily depends on relative matching scores when searching the candidate images; the absolute matching score does not matter. We only need a descriptor representation that is powerful enough to rank the images. Therefore, we used 32-bit and 8-bit integers to replace the 32-bit FPs as integer operations are expected to outperform FPs markedly in almost all known processors. Using 8-bit values also reduces the database size by approximately 4X. As we can see from Figure 14, using integers perceivably improves match performance over FP. What may be counterintuitive is that compared with 32b integer, 8b integer’s performance is worse if SIMD is not used (i.e., int8 bar longer than int32). The reason is that on a 32b/64b machine like x86, native scalar ALU operations are performed on a 32b/64b granularity. Using anything narrower than 32b requires extra instructions to explicitly extract 8 bits from memory before starting the 32b ALU operations. However, narrower data types gives us better instruction throughput when vectorized, explained next. (b) Vectorization Vectorization over 32b integer inputs does not improve performance (i.e., int32 vs. int32, SIMD) because overflow concerns have caused the compiler to use 32bx32bÆ64b multiplications. As a result, the 128-bit wide SSE registers on x86 can only accommodate 2-way SIMD. The performance benefit from 2-way SIMD is offset by the extra C code that was used to enable compiler-generated vectorization. Using 8b inputs allows the compiler to use 16bx16bÆ32b multiplications, and thus 4-way SIMD. We observed significant speedups over baseline when SIMD instructions were used on the 8-bit inputs. (c) Multithreading Matching the query image against two candidate images concurrently in two threads further increases functional unit utilization and improves match performance. As can be clearly seen from the Figure 12, the 2T time is much shorter than its single threaded counterpart in every experiment. Current x86 SSE datapath is 128 bits wide. Because of the big width (64B or 128B) of the descriptor vectors, MAR match will benefit from very wide SIMD instructions. For example, Intel® Advanced Vector Extensions (AVX) extends SSE instructions to wider vectors (256 bits). We expect that availability of vector instructions with larger throughput would be able to significantly boost match performance.
Match Time
1 query image against 10 DB images - one with 100% match, nine with 0% match. Image size =640x480, IP's = 500
Speedup(FP=1.0) 600
3.5
Match time (ms)
2.5 400 2.0
Speedup
3.0
500
300 1.5 200 1.0 100
0.5
0
0.0 fp32
fp32, SIMD
fp32, 2T
fp32, SIMD+2T
int32
int32, SIMD
int32, 2T
int8
int8, SIMD
int8, 2T
int8, SIMD+2T
Figure 14. Match Speedup via Optimizations (Vectorization, Multi-threading and Data type/Precision) MAR Before S/W Optimizations image = 640x480, IP's=533
MAR with S/W Optimizations image = 640x480, IP's=533
1400
match
1200
descriptor gen
1000
Time (ms)
Time (ms)
1600
IP detection
800 600 400 200 0 0
1
10
# of DB images to match against
20
500 450 400 350 300 250 200 150 100 50 0
match descriptor gen IP detection
0
1 10 # of DB images
20
(a) Before software optimization (b) After software optimization Figure 15. Summary of Optimized MAR Execution Time “Touring machine”, a prototype MAR device that combines mobile computing with augmented reality was developed in 4.4 Software Optimization Summary [17]. This is one of the earliest works in MAR that presents Figure 15 summarizes the software optimizations for all information about a location using head-tracked, head-worn, phases of MAR processing (interest point detection, descriptor 3D display, and a handheld device . generation and matching). As shown, the overall execution Feng et al. characterize the SIFT algorithm on multi-core time reduces by 2 to 3X after software optimizations for most servers [12]. Their work focuses on optimizing the image cases, and in fact performance improves for higher number of recognition algorithm for back end servers. Heymann et al. database images, as the most dominant function “match” is have implemented SIFT on graphics processing unit (GPU) optimized the best. The execution time is about 450 msecs for for real-time tracking and recognition of feature points [13]. matching a 640x480 resolution against 20 database images. Sinha et al. have yet another implementation of SIFT on GPU Similar improvements were observed for a 1Mpixel [14]. Both these work try to achieve real-time processing of resolution. image recognition algorithm on powerful graphics core, 5. Related Work typically seen on workstations. In recent years, there are few MAR studies primarily focusing Recent work has also implemented an outdoor augmented on (a) developing algorithms for MAR usage models and (b) reality system for ARM-based mobile phones in [7]. Zhou et analysis of MAR workloads on handheld platforms that are al. focus on matching robust query features against a database based on ARM or other non-x86 processors. For example,
[15]. A mobile phone is used to capture the query images and interest points that occur in successive frames are matched against a database that is running on a server. Object based image retrieval using vocabulary of “visual words” to search a large database was done in [16]. Here the authors use “visual words” as index during query and matching phase. This work focuses on very large dataset as opposed to our small localized database. Clearly, this previous work highlights that the MAR usage model is gaining significant momentum and such workloads needs to be analyzed for performance and power behavior more seriously. In this paper, we studied one instance of a MAR workload on an Intel® ATOM™ processor-based handheld platform and showed that architecture-dependent performance optimizations can improve the performance of the application significantly (by over 2 to 3X). 6. Conclusions In this paper, we analyzed the execution time of MAR processing on the Intel® Atom™ processor for Mobile Internet Devices (MIDs)*. We showed that the base software implementation took several seconds for MAR processing. We described several software optimizations to the MAR application (cache, compute, vectorization, multithreading and data type/precision changes), implemented them and showed that these can improve the software processing by as much as 3X. Future work in this area is to (a) find faster algorithms for MAR components, (b) define hardware accelerators for compute intensive tasks and (c) analyze the processing with video input as opposed to still images shown in this paper. We are already building accelerators for match (the most dominant phase) and interest point detection (the second dominant phase) as a starting point. We plan to emulate the hardware accelerators along with general-purpose core to study the interaction between the hardware and software components in a SoC platform. We also plan to apply the accelerators to MAR processing when dealing with video input. We believe that the current optimizations and understanding of the workload will help us identify primitives that can be supported on general-purpose cores or implemented as hardware accelerators to optimize performance in future SoCs. Acknowledgement The authors would like to thank Phil Cayton, Jianping Zhou, Madhu Athreya, Jon Tyler and Li Zhao for valuable discussions as well as input. We thank Binu Mathew for Note: The performance data shown in this paper was intended purely for characterization and analysis of one initial instance of a MAR workload on a representative platform. It should not be considered as benchmarking for such applications and was not intended to be specific to any processor or platform configuration.
allowing us to use his images in this paper. The anonymous reviewers also helped us to improve the quality of the paper. References [1] Wikitude, http://www.mobilizy.com/wikitude.php [2] Nokia: Mobile Augmented Reality, http://research.nokia.com/research/projects/mara/index.html [3] Miscrosoft Techfest 2009., http://www.microsoft.com/presspass/events/msrtechfest/videoGall ery.aspx?initialVideo=techfest_channel10_AugmentedReality [4] Enkin, http://www.enkin.net [5] D.G. Lowe, Distinctive image features from scale-invariant keypoints, International Journal of Computer Vision, 60(2):91110, 2004. [6] H. Bay, T. Tuytelaars, and L. Van Gool, SURF: Speeded up robust features, in ECCV, 2006. [7] G. Takacs; V. Chandrasekhar; N. Gelfand; Y. Xiong; W-C. Chen; T. Bismpigiannis; R. Grzeszczuk; K. Pulli; B. Girod, “Outdoors Augmented Reality on Mobile Phone using Loxel-Based Visual Feature Organization”, ACM International Conference on Multimedia Information Retrieval, 2008 [8] OpenCV, http://sourceforge.net/projects/opencvlibrary [9] OpenSURF, http://code.google.com/p/opensurf1 [10] ANN, http://www.cs.umd.edu/~mount/ANN [11] “VTuneTM Performance Analyzer”, Intel http://www.intel.com//software/products/vtune
Corporation,
[12] Hao Feng, Eric Li ,Yurong Chen, and Yimin Zhang, “Parallelization and Characterization of SIFT on Multi-Core Systems”, in IISWC 2008. [13] S. Heymann, K. Müller, A. Smolic, B. Froehlich, and T.Wiegand, “SIFT Implementation and Optimization for General-Purpose GPU”, in WSCG, January 2007. [14] Sudipta N. Sinha, Jan-Michael Frahm, Marc Pollefeys, and Yakup Genc, “Feature Tracking and Matching in Video Using Programmable Graphics Hardware”, Machine Vision and Applications, March 2007. [15] Y. Zhou, X. Fan, X. Xie, Y. Gong, and W.-Y. Ma, “Inquiring of the Sights from the Web via Camera Mobiles,” IEEE International Conference on Multimedia and Expo 2006. [16] J. Philbin, O. Chum, M. Isard, J. Sivic, and A. Zisserman, “Object Retrieval with Large Vocabularies and Fast Spatial Matching,” Conf on Computer Vision and Pattern Recognition (CVPR), 2007. [17] S. Feiner, B. MacIntyre, T. Höllerer, and T. Webster, “A touring machine: Prototyping 3D mobile augmented reality systems for exploring the urban environment”, in Proeedings ISWC, 1997. [18] Aamer Jaleel, Robert S. Cohn, Chi-Keung Luk, and Bruce Jacob,
“CMP$im: A Pin-Based On-The-Fly Multi-Core Cache Simulator", Fourth Annual Workshop on Modeling, Benchmarking and Simulation (MoBS), 2008.