comparison of the two OXC architectures in a realistic network implementation in terms ..... as the final destination. D, then return (i.e., exit algorithm and return results). ... the final decision on wavelength assignment and regenerator placement.
Performance Comparison of Agile Optical Network Architectures with Static Vs. Dynamic Regenerator Assignment Kotikalapudi Sriram, David Griffith, Oliver Borchert, Giuseppe DiLorenzo, Richard Su, and Nada Golmie National Institute of Standards and Technology (NIST) Gaithersburg, Maryland 20899 Email: {ksriram, david.griffith, borchert, golmie}@nist.gov
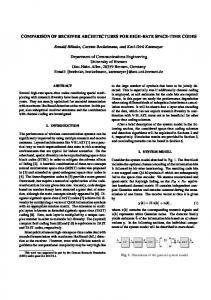
technology which allows use of (1) dynamically assignable directionality for regenerators and (2) dynamically assignable I/O port associations for transceivers. The existing and proposed technologies for optical switches are respectively called the Static Assigned Regenerator and Transceiver (SART) and Dynamically Assignable Regenerator and Transceiver (DART) architectures, shown in Fig. 1 and Fig. 2, respectively. For an OXC switch of size N × N , there are N ports and N (N − 1)/2 input/output port-pairs. In the SART architecture, a dedicated pool of regenerators is used for each of the N (N − 1)/2 port-pairs. Although not explicitly shown in Fig. 1, a dedicated transceiver (TR) pool is also used for each of the N fiber ports for add/drop of wavelengths. Splitters/combiners and Tunable I/O (TIO) devices are used at each fiber port to direct the appropriate wavelengths to the corresponding regenerator pools and TRs. The SART architecture is commonly used in the current implementations of agile all optical networks. The DART architecture, shown in Fig. 2, uses an additional switch stage, called OXC adjunct, to extract/inject the wavelengths that need regeneration or add/drop via TRs. Here the directionality of each regenerator and TR is dynamically assignable. Thus, in the DART architecture, it is possible to have one single shared pool of regenerators as well as one single shared pool of TRs. There is additional cost associated with this architecture due to the presence of the OXC adjunct as well as the more complex TIO devices. However, there is a possibility for that additional cost to be significantly offset due to savings in regenerator and TR costs, which are usually a significant fraction of the total switch cost. The sharing of regenerators and TRs in the DART architecture allows a desired connection blocking probability to be achieved at the switching node while using fewer regenerators and TRs than what is required by the SART architecture. In this paper, our objective is to present detailed analytical and simulation studies to compare the two architectures. The analytical study is applicable to a single node with N ports, and is very useful in providing intuitive insights into the two alternative architectures. Comparing the two architectures in a realistic network topology is necessary but it is considerably harder to tackle by analysis alone. Therefore, we performed
Abstract— Agile all optical cross-connect (OXC) switches currently use an architecture in which regenerators and transceivers have pre-assigned and fixed directionality. However, technology is evolving to enable new OXC architectures in which the directionality of regenerators and transceivers can be dynamically assigned on demand for each connection that requires regeneration. We have performed detailed analytical and simulation studies to compare the two architectures. The analytical study is applicable to a single node and is very useful in providing intuitive insights into the two alternative architectures. The simulation study is based on a realistic network topology consisting of 53 nodes. The simulation study was carried out using NIST’s updated GMPLS Lightwave Agile Switching Simulator (GLASS) tool. The GLASS tool was significantly enhanced over its previous version in the course of this study. We report extensive results on comparison of the two OXC architectures in a realistic network implementation in terms of connection blocking probability, efficiency of regenerator use, and carrier equipment costs. We show that fewer regenerators and transceivers need to be used with the new architecture because of sharing of resources across all directionality combinations. This translates to significant cost savings for the new architecture, especially as the traffic load in the network increases.
I. I NTRODUCTION In a recent paper [1], we described existing and evolving architectures for optical switches, based on the way the regenerator and transceiver directionality assignment is done. This paper complements and extends that study significantly by performing detailed simulations based on a realistic network topology. It is generally well known that there are significant cost advantages with respect to both capital expenditures (capex) and operational expenditures (opex) associated with deploying OXC-based agile all optical networks instead of conventional optical networks using Optical-Electrical-Optical (OEO) switching [2]–[5]. Agile all optical networks save on regenerator costs by selective use of regenerators at transit nodes only when required to regenerate an optical signal for an individual wavelength connection [3],[6]. In contrast, the OEO switched network uses a regenerator for each wavelength at each transit node in the connection path. Additionally, further technology advancements allow agile optical networks to be even more economical in terms of regenerator and transceiver cost savings. This additional advantage is due to evolving
0-7803-9277-9/05/$20.00/©2005 IEEE
55
Fiber 1
resources across all directionality combinations. This translates to significant cost savings for the new architecture, especially as the traffic load in the network increases. In Section II, we present analytical and simulation models for the SART and DART architectures for a single OCX switch. The purpose of the simulation model for a single OXC in Section II is to validate the results of the analysis, but more importantly to consider other realistic traffic characteristics that are not amenable to analysis. In Section III, we present numerical results based on the analysis and provide some insights there from. Section III also includes numerical results from simulation experiments for the single OXC. In Section IV, we describe an algorithm for regenerator and wavelength allocation, and also describe the details of the GLASS based network simulation model for comparison of the SART and DART architectures. In Section V, we present results from the network simulation studies, and discuss their implications. We state our conclusions in Section VI.
Fiber 3
OXC Fiber 4
Fiber 2
TIO
TIO
R R R R . . .
n(n-1)/2 Regenerator Pools
TIO
RR R
TIO
Fig. 1. Switch architecture associated with statically allocated regenerators and TR modules (SART architecture).
Fiber 1
Fiber 3
II. A NALYTICAL AND S IMULATION M ODELS FOR AN OXC S WITCH
OXC Fiber 4
Fiber 2
...
In order to carry out an analysis of the relative cost of the two switch architectures, we first develop expressions for the blocking probability associated with deploying the SART and DART architectures. In both cases the OXC has N bidirectional fiber ports, each of which typically supports multiple wavelengths (lambdas). The number of possible input/output port pairs is N C2 = N (N − 1)/2. In the following analysis, we assume that the OXC has four fiber ports, as shown in Fig. 3, which gives us six possible (input port, output port) combinations.
OXC Adjunct
...
...
TIO
TIO
... Shared TR Pool
... To Router
. . .
R R R R R R
. . .
Shared Regenerator Pool
1 Fig. 2. Switch architecture associated with dynamically configured regenerators and TR modules (DART architecture).
3
OXC 2
detailed simulation studies using the GMPLS Lightwave Agile Switching Simulator (GLASS) tool [7] for a realistic network topology consisting of 53 nodes. The updated GLASS simulation tool includes algorithms for efficient routing and wavelength assignment as well as least-cost regenerator placement in transit nodes when necessary. The updated GLASS tool also allows for specification of wavelength-reach profiles for the fibers. In our understanding, this is the for the first time that a detailed network simulation study has been done that considers several design considerations including k-shortest path routing, wavelength assignment, wavelength reach profile, dynamic regenerator allocation, and regenerator/transceiver directionality (static vs. dynamic). We report extensive results on comparison of the two OXC architectures in a realistic network implementation in terms of connection blocking probability, efficiency of regenerator usage, and carrier equipment costs. We show that fewer regenerators and transceivers need to be used with the new architecture because of sharing of
4
Fig. 3. OXC with four bidirectional fiber ports. The following ordered pairs denote the six possible paths through the switch: (1,2), (1,3), (1,4), (2,3), (2,4), and (3,4).
The cost of a transceiver (TR) is very close to that of a regenerator. This is because the optoelectronics and electronic circuitry used in them are almost the same. Hence, for simplicity of modeling we assume that any connection that requires a TR is equivalent to one that requires a regenerator. We therefore use a single parameter in our models for the fraction of connections that require a regenerator (or equivalently a TR). The majority of the connection requests going through a switch do not require regenerators. They simply pass through the OXC. We assume that the net arrival rate directed to the regenerators is λ. In both the SART and DART theoretical models, connection request arrivals follow a Poisson process
56
with rate λ; each regenerator is represented by a server whose rate µ is the inverse of the mean connection holding time. µ
µ
µ
µ
c regens 6
...
λ 6
cost of the primary OXC. We also assume that the cost of a regenerator is the same in each of the two architectures, and is given by f ∗ O, where O is the cost of a primary or adjunct OXC and f is a fraction representing a regenerator cost relative to an OXC cost. Thus, the costs of switches using the DART and SART architectures that satisfy a maximum blocking probability requirement, Pmax , at load ρ are given as follow (in multiples of OXC cost):
µ
6 systems
...
...
µ λ
c regens
CDART CSART
µ µ
c regens 6
...
λ 6
µ
µ
µ
(a)
(b)
In the SART architecture, shown in Fig. 1, we assume that an equal number of regenerators is assigned to each of the N C2 input/output port pairs. If the total number of regenerators in the switch is c, then c0 = 2c/(N 2 − N ) regenerators are available to each port pair. Usually c is significantly larger than (N 2 − N )/2, and for the purpose of this study, we require c0 to be always an integer (may involve a slight rounding of estimates). The models for the SART and DART architectures corresponding to N = 4 are illustrated in Figs. 4(a) and 4(b), respectively. There are (N 2 − N )/2 = 6 directional pairs of ports in a 4x4 OXC. Thus for the SART case (as shown in Fig. 4(a)), we have six M/G/c0 /c0 systems, each of which receives connection requests at a rate of λ0 = 2λ/(N 2 −N ) = λ/6. The blocking probability for connections requiring the use of any given input/output port pair is B(c0 , ρ0 ), where ρ0 = λ0 /µ is the directional regenerator load, measured in Erlangs, and
fX (x) = pλ1 exp(−λ1 x) + (1 − p)λ2 exp(−λ2 x),
(ρ0 )c /c0 !
B(c , ρ ) = Pc0
k=0 (ρ
0 )k /k!
(2) (3)
(4)
where we assume without loss of generality that λ1 > λ2 , and where p is the probability of being in mode 1 where arrivals occur at the higher rate of λ1 , and (1 − p) is the probability of being in mode 2 where arrivals occur at the lower rate λ2 . The ratio of arrival rates, θ, and the average arrival rate, λ, are θ = λ1 /λ2 (5)
0
0
2 + f · B −1 (Pmax , ρ) 1 + f · B −1 (Pmax , ρ0 ).
To validate and supplement the analytical results for the single OXC switch, we also developed a simulation model, implemented in C++, that incorporates discrete event processing. The simulation model considers other realistic traffic characteristics for the connection arrival process and connection holding time distribution that are not analytically tractable. Note that this simulation model in C++ is only for the single OXC switch, and is different from the detailed network simulation model (based on GLASS) that is described in Section IV. The connection holding time distribution is shown in Fig. 5. This distribution is meaningful because in agile optical networks the connections would be increasingly dynamic, and such connections can be expected to request wavelengths for durations on the order of a fraction of a day. The average connection duration is 3.55 hours for the distribution in Fig. 5. The connection arrival process is assumed to be either a Poisson process (smooth arrivals) or a bursty process represented by hyper-exponential interarrival times. The hyperexponential density function for two arrival modes is given by
Fig. 4. (a): Queueing model for the SART switch using 6 sets of c0 regenerators, where the probability that an arrival will be directed to a given set of servers is uniform. (b): Queueing model for the DART switch using c regenerators.
0
= =
(1)
is the well-known Erlang-B loss formula. In the DART architecture, the OXC uses a set of c dynamically allocated regenerators (see Figs. 2 and 4(b)). We can use an M/G/c/c queueing model in this case as illustrated in Fig. 4(b). The blocking probability associated with this model is B(c, ρ), where ρ = λ/µ is the total switch regenerator load, measured in Erlangs. Given a particular switch architecture and a known load level, we can use the inverse of the Erlang-B loss formula to determine the minimum number of regenerators that are required to achieve a blocking probability that is below a given threshold, Pmax . Once we obtain this quantity, cmin = B −1 (Pmax , ρ), we can determine the associated cost of the switch that satisfies the blocking probability requirement at the indicated load. For the cost comparison, we assume that the cost of an adjunct OXC is roughly equivalent to the
and −1 λ = pλ−1 1 + (1 − p)λ2
�−1
,
(6)
and the squared co-efficient of variation of the arrival process is given as follows: χ2 =
Var{X} 2(p + (1 − p)θ2 ) = − 1. (E{X})2 (p + (1 − p)θ)2
(7)
We chose the parameters of the hyper-exponential distribution to obtain different values of the net packet arrival rate λ (equivalently, Erlang load) and χ2 in the simulations. For example, the values of p = 0.95, θ = 40 give χ2 = 17.6, and p = 0.9, θ = 10 give χ2 = 5.04. Thus, varying p and θ allows for different values of burstiness measure (associated with connection arrival process) to be incorporated in the simulation runs.
57
TABLE II
0.25
T HEORETICAL AND EXPERIMENTAL VALUES OF BLOCKING FOR STATIC REGENERATOR AND
PROBABILITY
TR MODULE PLACEMENT.
Pr{Connection Duration = t}
0.2
Load (Erlangs) 10 15 20 25 30 35 40 45 50
0.15
0.1
0.05
0 0
1
2
3
4
5 6 t (Hours)
7
8
9
In the simulation of the SART switch architecture, there are six directional-pairs involved for a switch size of N = 4. We direct connection arrivals with equal probability to each directional-pair, simulate each directional-pair independently, and then take the worst of the six performance metrics to obtain the blocking probability for the switch. III. N UMERICAL R ESULTS FOR AN OXC S WITCH We first validate our OXC switch simulation methodology by comparing the results of the M/G/c/c analysis in Section II with those obtained from simulations. Table I and Table II show these comparisons for connection blocking probability due to regenerator unavailability for the DART and SART architectures, respectively. The extremely close comparison in numbers in these two tables is a very good validation of our OXC switch simulation modeling tool. In both cases, our error was on the order of 0.1% except for the DART architecture at loads of 10–25 Erlangs, where the error was on the order of 1%. We proceed to present a variety of steady-state and transient results based on simulations, including the effects of burstiness in the arrival process.
30
Number of Regenerators in Use
25
TABLE I T HEORETICAL AND EXPERIMENTAL VALUES OF BLOCKING PROBABILITY FOR DYNAMIC REGENERATOR AND TR MODULE PLACEMENT. B(c, ρ) 7.3176E-05 8.3935E-03 6.6097E-02 1.6798E-01 2.7090E-01 3.5845E-01 4.2995E-01 4.8827E-01 5.3630E-01
Experiment 6.2478E-02 1.4953E-01 2.4236E-01 3.2569E-01 3.9794E-01 4.5730E-01 5.0878E-01 5.5277E-01 5.8875E-01
use of the available regenerators, and implicitly blocks fewer connection requests. Even though the regenerator utilization of the SART switch is lower than that of the DART switch in this example, the SART blocking probability is higher because regenerators cannot be made available where they are needed. As stated earlier, in the SART switch, resources for one direction can remain idle while connection requests are blocked at another input/output port pair for lack of resources. Fig. 7 plots the connection request blocking probability, PB , for the SART and DART switches for 18 and 24 regenerators. In the SART architecture, the available regenerators are distributed equally across the 6 directional regenerator pools (see SART switch architecture in Fig. 1). The advantage of a shared regenerator pool in the DART switch in terms of lower blocking probability is evident from these plots. Also evident is the fact that adding more regenerators reduces the blocking probability significantly, with greater reductions in the case of the DART switch.
10
Fig. 5. Probability mass function for the duration of connections used in the simulations
Load (Erlangs) 10 15 20 25 30 35 40 45 50
B(c0 , ρ0 ) 6.2444E-02 1.4992E-01 2.4258E-01 3.2652E-01 3.9834E-01 4.5871E-01 5.0939E-01 5.5214E-01 5.8850E-01
20
15
10
5 DART (18 regens) SART (18 regens)
Experiment 7.4444E-05 8.2933E-03 6.6470E-02 1.6685E-01 2.7032E-01 3.5775E-01 4.3000E-01 4.8811E-01 5.3623E-01
0 12000
12003
12006
12009
12012 12015 Time (Hours)
12018
12021
12024
Fig. 6. Performance histories for DART and SART switch architectures using 18 regenerators under a load of 30 Erlangs.
Fig. 8 shows the number of regenerators required to achieve a connection blocking probability of at most Pmax = 10−3 over a range of traffic loads. The figure shows a comparison of the theoretical and simulation results for the M/G/c/c case. In the plots, the analytical results are indicated by solid and dashed lines and the simulation results are denoted by markers. For the SART switch, the M/G/c/c analysis produces a stair-
Fig. 6 shows transient behavior taken from a single simulation run and compares the numbers of regenerators used in the SART and DART switch architectures over a 24-hour period. It is evident from the plots that the DART switch makes better
58
Blocking Probability, PB
10
10
10
10
10
0
180 Minimum Number of Regens Needed for PB ≤ Pmax
10
−1
−2
−3
−4
SART (18 regens) SART (24 regens) DART (18 regens) DART (24 regens)
−5
10
15
20
25
30 35 Load (Erlangs)
40
45
100 80 60 40 20
180 Minimum Number of Regens Needed for PB ≤ Pmax
max B
120
15
20
25
30 35 Load (Erlangs)
40
45
50
from χ2 = 5 to χ2 = 18, the required number of regenerators increases by more than 20% in both cases (SART or DART). More economic usage of regenerators in the case of DART enables greater design robustness when fluctuations in traffic burstiness occur.
180
Minimum Number of Regens Needed for P ≤ P
SART (HyperExp (p=0.95, θ=40)) SART (Poisson) DART (HyperExp (p=0.95, θ=40)) DART (Poisson)
Fig. 9. Number of regenerators required to achieve a new connection blocking probability of 0.001 using DART and SART architectures with Poisson and hyper-exponential connection arrival processes.
case function with a step size of six because the regenerators are determined for any one direction and multiplied by six to give the number for the whole switch. We note that for both the SART and DART switch architectures, the difference between the number of required regenerators obtained from the theoretical analysis and the simulation results is very small. A service provider can use results such as those in Fig. 8 to determine the number of regenerators (and TRs) needed by an OXC switch to achieve a desired blocking probability for a given load level.
140
140
0 10
50
Fig. 7. New connection blocking probability for DART and SART switch architectures using 18 and 24 regenerators.
160
160
SART (Poisson, experimental) SART (Poisson, theoretical) DART (Poisson, experimental) DART (Poisson, theoretical)
120 100 80
160 140 120 100 80 60 40 20 0 10
60
SART (HyperExp (p=0.95, θ=40)) SART (HyperExp (p=0.90, θ=10)) DART (HyperExp (p=0.95, θ=40)) DART (HyperExp (p=0.90, θ=10))
15
20
25
30 35 Load (Erlangs)
40
45
50
40
Fig. 10. Number of regenerators required to achieve a new connection blocking probability of 0.001 using DART and SART architectures with hyperexponential connection arrival processes with different levels of burstiness.
20 0 10
15
20
25
30 35 Load (Erlangs)
40
45
50
Finally, Fig. 11 and Fig. 12 show comparisons of the costs of implementation of the SART and DART switch architectures over a range of traffic load values for fractional (i.e., relative to OXC) regenerator cost values of f = 0.03 and f = 0.04, respectively. The cost of a regenerator is known to be about 1/25th to 1/30th that of the OXC cost [6]. The initial cost of the DART implementation (excluding regenerators) is assumed higher by a factor of two as compared to the SART implementation (excluding regenerators). This is because of the added cost of the OXC adjunct and the need for potentially more complex TIOs (see SART and DART architectures in Fig. 1 and Fig. 2). As the traffic load increases, the SART architecture requires many more regenerators than the DART
Fig. 8. Comparison of experimental results with theoretical predictions for the number of regenerators required to achieve a new connection blocking probability of at most 0.001. Connection arrivals follow a Poisson process.
Fig. 9 shows a comparison of the numbers of regenerators required to achieve PB ≤ 0.001 in the cases of a Poisson (smooth, χ2 = 1) arrival process and a bursty (χ2 = 18) arrival process with hyper-exponential interarrival times. It is evident that DART uses significantly fewer regenerators as compared to SART, in both the Poisson and hyper-exponential cases. Fig. 10 shows the number of regenerators required in the cases of hyper-exponential interarrival times with low burstiness and high burstiness. As the burstiness measure increases
59
architecture. Hence, there is a critical load value, above which the DART architecture cost is lower than that of the SART architecture. The critical load value is much lower in Fig. 12 (about 12 Erlangs for both architectures) than in Fig. 11 (about 27 Erlangs for both architectures). Thus, Figs. 11 and 12 also demonstrate that the critical load value (at which DART becomes less costly than SART) is not very sensitive to the traffic burstiness but is quite sensitive to the regenerator cost factor f . This critical point can shift significantly to an even lower load value if we consider the opex for power consumption and footprint, because regenerators consume power as well as shelf space. The use of fewer regenerators for the DART architecture would also result in lower opex costs as compared to those associated with the SART architecture.
architectures at a single OXC switch. In this section, we describe the simulation methodology used for comparing the two architectures for a network topology similar to that of any major carrier’s network. For running network simulations, we used the NIST GLASS (GMPLS Lightwave Agile Switched-network Simulator) tool [7]. As part of this work, we have made major improvements to the GLASS tool: (1) It now includes new algorithms that take into account the fiber wavelength-reach profile for regenerator placement as well as routing and wavelength assignment; (2) The GLASS tool has also been augmented with major data recording and post-processing capabilities; and (3) The performance in terms of simulation speed-up has also been improved significantly by a factor of two or more. The algorithm that we have used for connection routing, and wavelength and regenerator assignments is as follows. First, we use the Dijkstra algorithm to obtain k-lowest cost paths between connection source (S) and destination (D) nodes. The cost may be defined as end-to-end path distance or in other ways that assign costs to links based on load, congestion, etc. The k paths are ordered in accordance with increasing cost. The least cost path is first considered for wavelength and regenerator assignment. If that is unsuccessful, then the next path in that ordered list is considered. For a given path from S to D, the combined algorithm for the wavelength assignment and regenerator placement is as follows: • Step 1: Set A = S (source node) and Z = D (destination node). • Step 2: Obtain the set of wavelengths, Sλ , each of which is contiguously available on all hops from node A to node Z. • Step 3: If Sλ = null, then reset Z to the node that is one hop from Z towards A in the A-Z path, and go to Step 2. Else, continue. • Step 4: Estimate the number of regenerators, Ri , needed for each λi as follows: Pn j=1 Dj ∀λi ∈ Sλ , (8) Ri = Gi where n is the number of hops in the A-Z path, Dj is the hop distance for jth hop in the A-Z path, and Gi is the maximum reach of λi . • Step 5: If over the space of λi ∈ Sλ , minbRi c ≥ 1, then go to Step 9, else continue. • Step 6: Since minbRi c = 0, no regenerators are required from the current A to the current Z. Select the subset of wavelengths from the set Sλ that have bRi c = 0, and name this subset of wavelengths as Qλ . Find a λk in Qλ that has the highest value of Ri and assign that λk to be used from the current A to current Z. (Explanation: This step ensures that we pick a wavelength that results in the least overshoot of wavelength reach beyond the next regenerator or perhaps the destination node). • Step 7: If the current Z is the same as the final destination D, then return (i.e., exit algorithm and return results). Else, continue to the next step.
7 6.5
Cost (Multiples of OXC Cost O)
6 5.5 5 4.5 4 3.5 3
SART (HyperExp (p = 0.9, θ = 10)) DART (HyperExp (p = 0.9, θ = 10)) SART (Poisson) DART (Poisson)
2.5 2 10
15
20
25
30 35 Load (Erlangs)
40
45
50
Fig. 11. Cost of DART and SART switch architectures as a multiple of the OXC cost when f = 0.03, for hyper-exponential and Poisson arrival processes.
7 6.5
Cost (Multiples of OXC Cost O)
6 5.5 5 4.5 4 3.5 3
SART (HyperExp (p = 0.9, θ = 10)) DART (HyperExp (p = 0.9, θ = 10)) SART (Poisson) DART (Poisson)
2.5 2 10
15
20
25
30 35 Load (Erlangs)
40
45
50
Fig. 12. Cost of DART and SART switch architectures as a multiple of OXC cost when f = 0.04, for hyper-exponential and Poisson arrival processes.
IV. D ESCRIPTION OF THE N ETWORK S IMULATION M ODEL The analytical and simulation results reported in the preceding sections were for comparing the SART and DART
60
Fig. 13.
• •
•
Network topology for simulation; 53 nodes and 69 links.
Step 8: Place a regenerator at the current Z, and set A to the current Z and set the current Z to D. Go to Step 2. Step 9: (Note: Arriving at this Step always from Step 5). At this step it is known that minbRi c ≥ 1, and hence one or more regenerators are required in the current A to Z path. Select the subset of wavelengths Wλ from the set Sλ that have the least value of bRi c. Find a λk in Wλ that has the highest value of Ri − bRi c and assign that λk to be used from the current A to current Z. (Note: The explanation in Step 6 also applies here.) Step 10: Place a regenerator at the farthest node away from A (towards Z) that the wavelength λk (that was assigned in Step 9) can reach without regeneration. Call this node the current A, and set current Z to the final destination D. Go to Step 2.
topology and traffic load. Only with a slight modification, it is also applicable for the evaluation phase, where the regenerators are provisioned at various nodes as per results of the design phase simulations, and then the connection blocking performance is studied by simulating a range of traffic loads spread around the designed load. The modification is as follows. In the evaluation phase, the regenerator placement will include a step of checking if a regenerator is available at a given node where it is determined suitable for placement. If the result of this check is negative, then the algorithm will attempt to place the regenerator at a node one hop closer (to the source node) if a regenerator is available at that node. Also in such a situation, the algorithm should normally have a limit (say, 1 or 2) on how many preceding nodes it will try in that manner to find an available regenerator before declaring the connection setup unsuccessful.
We feel that the above algorithm is well thought-out and will perform adequately for assignment of wavelengths and placement of regenerators. However, some improvements can be made nevertheless and are the subject of further study. The above algorithm can be applied in both directions, i.e., from S to D and D to S, and whichever direction yields a smaller number of required regenerators will determine the final decision on wavelength assignment and regenerator placement. The above algorithm as described above is for the design phase of our simulations, where the number of regenerators needed at each node are determined for a given network
We have carried out the simulations with a realistic network topology consisting of 53 nodes as shown in Fig. 13. This network is like any major U.S. carrier’s continental network. It is consisting of 53 nodes and 69 links. Most links have one fiber but some bottleneck links (those shown in green in the middle of the network: links 16, 17, 18, 19, 38, 39, 69, 26) have two fibers, and there are 100 wavelengths per fiber. The bottleneck links in this network carry heavy loads of traffic that go across the network from east to west and vice-versa, and hence they are assigned double capacity. This enables the network to have reduce connection blocking due to wavelength
61
0.7 0.6 Blocking & Load
5000 4500 4000 3500 3000 2500 2000 1500 1000 500 0
Leaf TW Classis DSF
0.5 Carried Load
0.4 0.3 Connection Blocking
0.2 0.1
Connection Arrival Rate = 150 calls/hr
0 0
10000
20000
30000
40000
50000
60000
70000
80000
Time (s)
97
89
81
73
65
57
49
41
33
25
17
9
Fig. 15. Connection blocking due to wavelength unavailability and carried load vs. time in the design phase.
1
Wavelength Reach (km)
unavailability, and thereby permits a better study of the issue of blocking due to regenerator unavailability for SART vs. DART comparisons. At each node, the OXC can be programmed to have either fixed or dynamically assignable regenerator directionality. Connections request a whole wavelength, and can have any general inter-arrival time distribution that the user may choose.
the design phase for the training load are deployed at each OXC. In the evaluation phase for the SART architecture, the required numbers of regenerators are rounded up to be a multiple of the number of directional pairs of ports (i.e., multiple of N (N − 1)/2 where N is the number of ports at a given OXC), and distributed evenly over all directionalpairs at the OXC. Finally, as part of the evaluation phase, several simulations are run for a range of values of load above and below the training (planned) load that was used in the design phase. Thus the design phase gives us estimates for the sizing of regenerators to be deployed at various nodes throughout the network for any given anticipated (planned) offered load. And the evaluation phase provides performance assessments for the SART and DART architectures in terms of efficiency of regenerator usage and the probabilities of connection blocking due to regenerator unavailability as well as wavelength unavailability. Figs. 15 and 16 are results obtained from the design phase. These results correspond to an offered load of 150 connections per hour fed into the 53-node network (see Fig. 13). During this phase of simulation, there is no connection blocking due to regenerator unavailability but there can be potential blocking only due to wavelength unavailability. Fig. 15 shows the time evolution plots of the carried load and the connection blocking due to wavelength unavailability over the simulation run length of 72,000 sec (20 hours). There is no relevance of the SART architecture in this phase because the regenerators can be placed in any direction in which they are needed to accommodate each connection. The experiment is repeated several times with different seeds for the random number generation but the same offered load. The regenerators are counted for each run at each of the 53 nodes. Fig. 16 shows the maximum number of regenerators observed at each of the nodes over the multiple runs. This data gives us the basis for estimating the numbers of regenerators that should be deployed at each node in order to plan the network to have low blocking
Wavelength Number Fig. 14.
Wavelength-reach profiles for different fiber types.
The probability distributions for the connection inter-arrival times and the holding times can also be set by the user. For generating the results in this paper, we used a Poisson arrival process for connection or call arrivals, and the distribution for the connection holding time is the same as that used for the analytical modeling (see Fig. 5). Fig. 14 shows some examples of reach vs. wavelength profiles for three fiber types: LEAF, TrueWave Classic, and DSF. The reach (km) varies from one wavelength to another over a wide range for a given fiber type. For the simulation runs, we used the TrueWave Classic fiber characteristics. The network is simulated for 20 hours of system time in each run (typically 30,000 to 40,000 connections arrive and depart). The results are averaged over multiple such runs using different random seeds. A wide variety of interesting network/system performance and resource utilization data have been gathered and analyzed by post-processing of the detailed simulation data. These results are reported and discussed in the next section. V. R ESULTS FROM N ETWORK S IMULATION We ran the simulations in two phases: in a design phase and then in an evaluation phase. We will first describe the purposes of these two phases. We define the offered load as the exogenous connection request rate per hour. In the design phase, the network with DART architecture is simulated for an anticipated (planned) offered load, and the number of regenerators needed at each node to have no blocking due to regenerators is determined. There may be some new connection blocking in the design phase but only due to wavelength unavailability. For the evaluation phase of the DART architecture, the numbers of regenerators obtained in
62
300
100% 150 Connections per hour; No regen blocking
90% Regerator Utilization (%)
Maximum # Regens Used
250 200 150 100 50 0 1
4
7
80% 70% 60% 50% 40% 30% 20%
DART
10%
SART
0% 100
10 13 16 20 23 26 29 32 35 38 41 44 47 50 53
110
Node ID Fig. 16. Regenerators needed at each node for 0% connection blocking (i.e., no blocking due to regenerator unavailability but potential blocking only due to wavelength unavailability).
120 130 140 150 160 170 180 Offered Load (connection requests per hour)
190
200
Fig. 17. Comparison of regenerator utilization (efficiency) for the SART and DART architectures.
Connection Blocking Probability
0.3
at the chosen (planned) load, e.g., 150 calls/hour. We described above as to how this data is used differently for the regenerator estimations for the SART and DART architectures. Once the design phase simulation runs are completed, we perform simulations for the evaluation phase. In this example, the design phase offered load was selected to be 150 calls/hour. Thus for evaluation phase of the simulations, we vary the load from 100 to 200 calls/hour to observe connection blocking performance due to regenerator or wavelength unavailability. Now we discuss some performance results comparing the SART and DART architectures for the 53-node network. Fig. 17 shows that the regenerator utilization is much higher in the network with the DART architecture as compared to the same with the SART architecture. This is because in the SART architecture a node may have available regenerators but often not in the direction in which a connection request at hand needs it, especially at higher loads. On the other hand, the DART architecture uses a common shared pool of regenerators available for use for any port-pair, and hence uses them much more efficiently. Note that the regenerator utilization saturates at about 90% for the DART architecture. Even though the network was designed (i.e., regenerators estimated) essentially for the case of the DART architecture, yet there will be some blocking and less than 100% regenerator efficiency because the offered load pattern may be different in the evaluation phase (as compared to the design phase) due to use of different seeds for the random number generators for the call arrivals and holding times. Also, note that the SART architecture actually deploys a somewhat larger number of regenerators (due to the rounding described earlier) than the DART architecture, and still it exhibits much lower regenerator utilization as compared to DART for reasons explained above. Figs. 18 and 19 show comparisons of the connection blocking performance for the SART and DART architectures. The two figures show the overall connection blocking probability as well as those separately attributable to regenerator
0.25
Average Combined Blocking SART Average Blocking SART (Regens) Average Blocking SART (Wavelengths) Average Combined Blocking DART Average Blocking DART (Regens) Average Blocking DART (Wavelengths)
0.2 0.15 DART
0.1 0.05 0 100
110
120 130 140 150 160 170 180 Offered Load (connection requests per hour)
190
200
Fig. 18. Connection blocking vs. offered load (SART vs. DART comparison).
unavailability and wavelength unavailability. In Fig. 18, the blocking probabilities are plotted as a function of the offered load. It is clear that significantly lower blocking probability due to regenerator unavailability is observed for the DART architecture as compared to the SART architecture. In the SART case, the directionally constrained regenerators are exhausted sooner than the wavelengths are exhausted. In effect, underutilization of regenerators in the SART architecture results in higher connection blocking. However, in the DART case, the regenerators are not directionally constrained, and as it happens the wavelengths as well as regenerators are utilized much better to accommodate many more connections than the SART architecture for a given offered load. This latter observation is even more evident in Fig. 19, where we see that for a given blocking probability the network with the DART architecture can be operated at a significantly higher carried load (i.e., throughput) than the same network with the SART architecture. The carried load is essentially a measure
63
of efficiency of the overall network resource utilization considering both regenerators and wavelengths (or bandwidth). As an example, for a required connection blocking probability of 10% or less, the network can be operated with the DART architecture at a throughput efficiency of about 64%, while the same is about 40% for the SART architecture. Average Combined Blocking SART
0.3 Connection Blocking Probability
We hope that our modeling methodologies and the enhanced GLASS-based simulation tool for networks with SART or DART architectures would be very helpful for network operators: (1) for sizing the resources, and (2) for further comparative evaluation of the pros and cons of potentially replacing the existing SART architecture with a DART architecture in their network. We also hope that the same can also be very useful for fellow researchers to further investigate other interesting algorithms for routing, wavelength assignment, and regenerator placement, in networks with these or other architecture choices.
Average Blocking SART (Regens) Average Blocking SART (Wavelengths) Average Combined Blocking DART
0.25
Average Blocking DART (Regens) Average Blocking DART (Wavelengths)
0.2
ACKNOWLEDGMENTS This research was partially supported by the Laboratory for Telecommunications Sciences (LTS), the Defense Advanced Research Projects Agency (DARPA) Fault Tolerant Networks (FTN) program, and the National Communications System (NCS).
0.15
DART
0.1
SART 0.05
R EFERENCES 0 0.4
0.45
0.5 0.55 0.6 0.65 Carried Load (Network Capacity Utilization)
[1] K. Sriram, D. Griffith, R. Su, and N. Golmie, ”Static vs. dynamic regenerator assignment in optical switches: Models and cost trade-offs,” Proceedings of the IEEE Workshop on High Performance Switching and Routing (HPSR 2004), April 2004, Phoenix, AZ, pp. 151-155. [2] ITU-T Recommendation G.8080/Y.1304, ”Architecture of the automatically switched optical network (ASON)” (International Telecommunication Union-Telecommunication Standardization Sector, November 2001), http://www.itu.int/ITU-T/ [3] B. Doshi, et al, ”Transparent Cross-Connect and Ultra-Long-Reach Transmission Systems: Complementary Technologies”, NFOEC 2001 Technical Proceedings. [4] G.P. Agrawal, ”Fiber-Optic Communication Systems,” 1997. [5] R. Ramaswami and K. N. Sivarajan, Optical Networks - A Practical Perspective, 2002. [6] A. Solheim, ”Agile Photonic Networking,” World Markets Series: Global Optical Communications World Markets Whitepaper, July 2002. [7] Oliver Borchert, Richard Rouil, “The GMPLS Lightwave Agile Switching Simulator - An overview,” www.antd.nist.gov/glass
0.7
Fig. 19. Connection blocking vs. carried load (SART vs. DART comparison).
VI. C ONCLUSIONS In this paper, we compared two alternative all-optical switch architectures that differ in the way the regenerators and TRs are used: static assigned (SART) vs. dynamically assigned (DART). We showed that there are significant performance and cost benefits due to the shared resource arrangement in the DART architecture. We presented analytical and discrete-event simulation modeling results for a single OXC switch as well as detailed network simulation results to compare the SART and DART architectures. We have described an efficient algorithm for wavelength allocation and regenerator placement. The results show that for a given total number of regenerators and connection blocking requirement, the DART architecture results in much higher network capacity utilization and more efficient regenerator and wavelength usage than the SART architecture. Also, significant savings in the number of required regenerators is possible for the DART architecture, resulting in much lower overall network cost as compared to the SART architecture. For the purpose of protection of light paths, there is a clear advantage due to the use of OXCs with the DART architecture. Because the regenerators and wavelengths are used much more efficiently in this architecture as compared to the currently used SART architecture, many more connections can be provided 1+1 or 1:1 protection for the same set of network resources in terms of regenerators and wavelength capacity. We plan to explore and quantify this issue further in our ongoing research.
64