Performance Comparison of Middleware Threading Strategies M. Harkema1 1
B.M.M. Gijsen2
Department of Computer Science University of Twente The Netherlands
[email protected] [email protected]
R.D. van der Mei2,3
2
Expertise Group QoS Control TNO Telecom The Netherlands
[email protected]
ABSTRACT The spectacular growth of E-business applications on the Internet has boosted the development of middleware technology. Middleware is software that manages interactions between applications distributed across a heterogeneous computing environment. In the competitive E-business market the ability to deliver a high and predictable performance of E-business applications is crucial to avoid customer churn, and thus loss of revenue. This raises the need for service providers to be able to predict and control performance. The performance of middleware-based applications depends strongly on the choice of the so-called threading strategy, describing how the middleware layer handles competing method invocation requests. The goal of this paper is to provide an understanding of the impact of threading strategies on the performance of middlewarebased applications. To this end, we (1) develop new quantitative models for the performance of middleware under different threading strategies, (2) perform extensive test lab experiments to compare the performance under different threading strategies, and (3) explain the experimental results by relating them to the quantitative models. As such, this paper provides new and fundamental insight in the impact of threading strategies on the performance of E-business applications. Keywords: Middleware, CORBA, Java, threading strategies, performance measurement, performance modeling
1. Introduction The dramatic growth of the Internet, the developments in the hardware and software industry, and the recent advances in networking technology have boosted the emergence of distributed computing. Distributed computing enables applications to be divided in components that can be executed on geographically distributed information systems. Distributed computing provides the fundamental technology for the realization of enterprise-wide and even global information systems. This development has led to the emergence of a wide variety of E-business applications that have been brought to the market. In this competitive market of Ebusinesses a critical success factor for E-business applications is the performance. Performance problems can directly lead to customer churn, and thus loss of revenue. Typical examples of Ebusiness applications are online airline ticket reservation, online banking and online purchasing of consumer products. For this type of applications, the most relevant performance aspects are service availability, payment transaction security and
L.J.M. Nieuwenhuis1 3
Faculty of Exact Sciences Vrije Universiteit Amsterdam The Netherlands
[email protected]
performance. This paper is focused on performance, particularly in terms of server throughput. Distributed applications typically run in a heterogeneous environment of networks, hardware and software components. Middleware architectures have been developed to shield developers of distributed application from interoperability problems. Middleware is software that resides between the application and the operating system. As such, middleware performance is an important part of the end-to-end performance of distributed applications. The performance of distributed middleware-based applications depends on many factors, including network performance, the performance of the application code and middleware, and the performance of the hardware on which the application and middleware is being executed. Over the past few decades, many commercially available middleware products have been brought to the market. The application developer can choose between a variety of threading strategies (and related configuration settings) offered by the middleware, while the proper choice of the threading strategy may have a dramatic impact on the performance of the application perceived by the end user. Consequently, it is important to be able to compare the implications of the choices of the threading strategies and the configuration settings prior to the actual implementation, which is usually very time consuming and hence costly. Today, however, the understanding of the implications of the choices of the threading strategies is very limited. Therefore, in this paper we develop quantitative performance models several frequently implemented threading strategies. We compare the performance under these threading strategy alternatives on basis of extensive experiments performed in a test lab environment. The comparison of the performance under the different threading alternatives is explained by relating the results to the models developed, providing new and fundamental insight in the implications of threading strategy alternatives. In this paper our focus is on CORBA Middleware [Vinoski97] [OMG01], the de-facto standard for middleware. The remainder of this paper is structured as follows. Section 2 discusses threading as specified by the OMG CORBA specification, and the implementation of threading strategies in CORBA implementations for Java. Section 3 describes performance models of threading strategies implemented in the IONA ORBacus CORBA implementation. Section 4 discusses the performance experiments we have conducted to compare these
threading strategies in a test-lab setting. Section 5 concludes this paper and addresses topics for further research.
•
GIOP messages are received in receiver threads. In some threading strategies the method invocations to CORBA objects are executed in receiver thread. During this time the receiver thread cannot handle new GIOP messages (like a new method invocation request). For applications that use method invocations with longer completion times it may be better to ‘delegate’ the execution to a separate thread (the dispatcher thread). The dispatcher thread will then handle the dispatching of the method invocation request to the servant. The method invocation will be executed in the context of the dispatcher thread. After delegating the method invocation request to the dispatcher thread, the receiver thread is free to receive the following GIOP message. Some time may elapse between the receiver thread handing over the request to a dispatcher thread, and the dispatcher thread actually handling the request.
•
The application running on top of the ORB can be multithreaded also. Usually the ‘ORB Controlled Model’ threading policy is used in POAs that manage servants for that application. The application (including the servants belonging to that application) is designed to handle requests concurrently – the application takes care of implementing critical sections (mutual exclusion) where required.
2. Specification & implementation of CORBA threading In this section we describe what threading strategies are, and what kind of threading strategies are implemented in popular CORBA implementations. A CORBA threading strategy determines how communication and execution of requests take place. A thread is a light-weighted process, having its own execution context (processor and memory state), but sharing memory and filedescriptors with other threads inside the process. By using multiple threads, an ORB can receive and execute multiple requests concurrently. Threading allows for more efficient use of the system’s resources, to achieve a higher request throughput.
2.1 The OMG CORBA specification The CORBA specification [OMG] specifies multi-threading policies for portable object adapters (POA). It doesn’t specify how ORBs should implement threading and what threading strategies they should implement. Multi-threading implementation in the ORB itself is left as platform-specific. The POA threading policies are there to ‘support threads in a portable manner across those ORBs’ that implement multi-threading. The CORBA specification doesn’t require the ORB to be multithreaded, however ORBs are required to implement the POA threading policies if they are multi-threaded.
Besides the abovementioned kinds of CORBA related threads several Java virtual machine related administrative threads, such as Java garbage collection threads, will be active.
The specification defines three threading policies for portable object adapters: the Single Thread Model, the ORB Controlled Model, and the Main Thread Model. These threading policies determine what concurrency constrains the POA will enforce while executing requests. The ORB Controlled Model (the default) doesn’t impose any concurrency constrains, requests to objects managed by the POA may execute in parallel. The Single Thread Model only allows one request to objects managed by the POA at a time (the POA dispatches requests sequentially). Requests to a single threaded POA are mutual exclusive, a lock (mutex) is introduced (by the ORB vendor in the middleware implementation), and locking contention may occur. The Main Thread Model only allows one request at a time to be processed by any POA with the main thread policy. Requests to any POA with main thread policy are mutual exclusive, a lock (mutex) is introduced, and locking contention may occur. The lock is shared by all main threaded POAs. The Main Thread Model was introduced in the CORBA 2.4 specification. In this paper we focus on the ORB Controlled Model (the default).
2.3 CORBA threading strategies
2.2 Server-side thread categories
The thread-per-client threading strategy uses receiver threads for both receiving and dispatching the requests to servants. Because requests are dispatched by the same thread as they are received in, following requests by the client are blocked until the receiver thread is done processing the current request. Effectively, only one request per client is active in user-code, i.e. in the servants. Each client-server connection has its own receiver thread, so multiple requests from different clients can be active in user-code.
On the server-side of a CORBA application we can distinguish the following kinds of threads: •
I/O threads: a common way of implementing I/O, i.e. connection setup and exchange of GIOP (General InterORB Protocol, CORBA’s messaging protocol) messages between client and server, is to use a specific acceptor thread for listening to incoming connections to CORBA objects (really the POA manager that manages the object). Typically, for every new connection a receiver thread is spawned that will handle the exchange of GIOP messages.
In general, the performance of CORBA-based applications depends on the choice of the threading strategies. To assess the impact of threading strategies on server performance used an IONA ORBacus implementation to conduct an experimental performance comparison. The reason for using ORBacus is threefold. First, ORBacus provides a complete set of threading strategies, which is most important to make a complete performance comparison of the most widely used threading strategies. Second, ORBacus is widely applied and available for both C++ and for Java. Third, ORBacus is both commercially and academically available. Other implementations, such as Orbix, Visibroker, JacORB and OpenORB, support comparable threading strategies with comparable features. Based on extensive experience with middleware performance testing, it is our expert opinion that the impact of the implementation details are negligible compared to the impact of threading strategies. As such, we expect that the results presented below are representative for implementations other than ORBacus.
The threaded threading strategy is the same as the thread-perclient model, but with an additional constraint: only one request may be active in user-code. The ORB serializes requests from the receiver thread when dispatching them to servants. While in the
thread-per-client model one request per client could be active in user-code (so multiple requests could be active if multiple clients are connected to the ORB), only one request ORB-wide can be active in user-code in the threaded model. Both the thread-per-client and the threaded threading strategies use the receiver thread for receiving and dispatching requests to servants. The thread-per-request threading strategy separates receiving requests and dispatching requests in separate threads. After receiving a request from a client, the receiver thread creates a new dispatcher thread. That thread dispatches the request to the servant, and sends the reply back to the client. Meanwhile the receiver thread can receive new requests (and dispatch them in new dispatcher threads). Thus, in the thread-per-request model multiple requests from the same client can be active in user-code. The thread-pool threading strategy is a refinement of the threadper-request model. It addresses several issues that may arise when using the thread-per-request model. First, the number of dispatcher threads is not bounded in the thread-per-request model. This can lead to an uncontrolled growth of the number of dispatcher threads. With many dispatcher threads active, the context switch overhead becomes very large, and even trashing behavior may occur, where the machine is mostly busy switching contexts rather than executing user-code. Another problem of the thread-per-request model is that thread creation and destruction is needed for each request. Especially for requests that don’t require a large amount of processing time, the added overhead of thread creation and destruction is relatively large, thus leading to inefficiencies. The thread-pool model addresses these issues by pre-allocating a fixed number of dispatcher threads when the ORB starts. Instead of creating new dispatcher threads, the receiver thread en-queues requests in the FIFO request queue of the dispatcher thread-pool. The dispatcher thread-pool assigns a dispatcher thread to process the request when an idle (nonworking) dispatcher thread is available.
3. Performance models of threading strategies To highlight the differences in the dynamic behavior of the four threading strategies we present performance models for each of the threading strategies. We present the performance models in an extended queuing network notation [LZG84] [Jain]. Figure 1 depicts some modeling constructs that require further explanation. First, a thread is modeled by a service center inside a square. All steps inside the dashed box are executed in the context of that thread. These steps contribute to the holding time of the thread. While the thread is busy requests can queue in the FIFO queue in front of the thread. A thread-pool is a group of threads that can execute some steps depicted in the dashed box. A thread-pool is modeled as a multi-server with a FIFO queue in front of it. A mutex is modeled by a queue and a dashed box denoting the processing steps inside the critical section of the mutex. Finally, we use a kind of zooming construct to denote the steps taking place inside a POA. We separate the logical and physical resource layers. The logical resource layer contains the threads and mutexes, while the physical resource layer contains the CPUs. I/O and memory resources are left outside the scope of this paper. The CPU service demands described in the logical resource layer are executed on the CPUs in the physical resource layer.
∞ ∞
Thread
Thread-pool ∞ POA
Mutex (critical section)
Steps ...
Steps taking place in POA
Figure 1. Performance model notation
3.1 Thread-per-client The simplest threading strategy available in ORBacus is the thread-per-client model. In the thread-per-client model a receiver thread is created for every incoming connection request of a client. Most CORBA implementations share TCP connections between a client and a server for invocations to different objects. However, some CORBA implementations offer private connections to specific objects to increase performance. When private connections are used, a better name for the thread-perclient strategy would be thread-per-connection. This section discusses the performance model of the thread-per-client threading strategy. Figure 2 contains the performance model in an extended queuing network notation. Performance model description Requests arrive at receiver threads with connection k (of Ncon connections) arrival rate λi,j,k for POA i and Object j. During request processing the receiver thread is occupied, this resource possession is depicted by a dashed line around the receiver thread logical resource. The thread-per-client model implements the same-thread dispatching model: requests are received and dispatched to servants in the same thread (the receiver thread). While the receiver thread is processing a request, newly incoming requests queue in the FIFO queue. The receiver thread first receives the request from the network, then it un-marshals the request header and a part of the request body, to obtain the POA and object identifiers. A series of request de-multiplexing steps is needed to locate the target POA, target object, and target method implementation. The POA identifier is used to locate the POA. In the performance model the aforementioned processing steps (including the de-multiplexing step to obtain the target POA, but excluding the other demultiplexing steps) are modeled by a service demand brec. The request is forwarded to the located POA, one of Npoa POAs. De-multiplexing continues with locating the target object in the POA’s active object map, using the earlier obtained target object
Receiver threads
λi,j,1
bser bsern
∞ brec
Root POA
bdisp
bunm
Servant 1 POA1 bmar
breply
∞ λi,j,2
bser bsern
∞
Servant Nser_1 POA1
brec POA 2
λi,j,k
∞
bser bsern
∞ brec
Ncon
ST POA NPOA
bdisp
bunm
Servant 1 POAN POA bmar
breply
∞
ST POA mutex
bser bsern
Servant Nser_1 POAN POA
logical resource layer All threads share CPU, I/O and memory resources
physical resource layer
Figure 2. Server side performance model for the thread-per-client model identifier. Now we have located the CORBA skeleton of the target object. The last de-multiplexing step is to locate the method implementation inside the skeleton. Finally, the request is dispatched to the target object’s skeleton. These two demultiplexing steps and the dispatching are modeled by a service demand bdisp. The remainder of the request (partial un-marshaling already took place earlier), including the request parameters, is un-marshaled by the skeleton. This un-marshaling step is modeled by a service demand bunm_i,j. The service demand depends on the amount and type of data that needs to be un-marshaled. The method implementation is invoked with the un-marshaled method parameters. The service demand of the method implementation is modeled by bser_i,j (CPU service demand) and bsern_i,j (delay introduced by non-CPU resources, e.g. remote database access or remote procedure calls). A POA may be configured using the single-thread threading policy, meaning that only one method at a time can be active inside the POA (i.e. in the objects managed by that POA). Access to the objects managed by this POA needs to be serialized. In single-threaded POAs the un-marshaling of the request parameters and the invocation of the method implementation are protected by a mutex, as depicted in the performance model by the ST-POA mutex (a FIFO queue). The critical section, protected by the mutex, is denoted by a dashed line drawn around the involved service centers. The Root POA, the POA created when the ORB starts, is always configured to be multi-threaded (it uses the ORB Controlled Model threading policy by default). The servant implementation may have a critical section too, which can also be modeled by FIFO queues as depicted in the model. The service centers that represent the servants with service demand bser_i,j and delay bsern_i,j may be replaced by submodels if the performance behavior of the servant cannot be captured using these parameters.
After method invocation the return parameters need to be marshaled. This is modeled by a service demand bmar_i,j. The service demand depends on the amount and type of data that needs to be marshaled. Finally, a reply message is created with the marshaled return parameters. The reply is sent back to the client over the same TCP/IP connection as the request arrived. This last step is modeled by a service demand breply. The threads that execute the mentioned steps for each request that is being served, share the physical server resources (such as the CPU, memory and I/O), as indicated in Figure 2.
3.2 Threaded The threaded threading strategy is similar to the thread-per-client threading strategy. The only difference is that in the threaded threading strategy there may only be one active request at a time in the servants. Access to the servants is serialized by an ORBwide mutex. This threading strategy is used by CORBA applications that are not multi-thread aware. For instance, legacy CORBA applications that are developed for single-threaded ORBs can use this threading strategy. Similar to the thread-perclient model, the threaded model also implements the same-thread dispatching model, where the receiver thread both receives requests from clients and dispatches them to the servants. The performance model of the threaded threading strategy is similar to the one of thread-per-client, except that the mutex for single-threaded POAs is removed (the ORB wide mutex basically makes all POAs single-threaded) and an ORB-wide mutex has been added in the POA model.
Receiver threads
λi,j,1
bser bsern
∞ brec
Root POA
bunm
bdisp
Servant 1 POA1 bmar
breply
∞ λi,j,2
bser bsern
∞ brec
λi,j,k
∞
POA 2
ORB Mutex
bser bsern
∞ ST POA NPOA
brec
Servant Nser_1 POA1
bdisp
bunm
Servant 1 POANPOA bmar
breply
∞ bser bsern
Ncon
Servant Nser_1 POANPOA
logical resource layer physical resource layer All threads share CPU, I/O and memory resources
Figure 3. Server side performance model for the threaded model Figure 3 contains the performance model in an extended queuing network notation. Performance model description Requests arrive at receiver threads with connection k (of Ncon connections) at rate λi,j,k for POA i and Object j. During request processing the receiver thread is occupied, this resource possession is depicted by a dashed line around the receiver thread logical resource. The threaded model implements the samethread dispatching model: requests are received and dispatched to servants in the same thread (the receiver thread). While the receiver thread is processing a request, newly incoming requests queue in the FIFO queue. The receiver thread first receives the request from the network, then it un-marshals the request header and a part of the request body, to obtain the POA and object identifiers. A series of request de-multiplexing steps is needed to locate the target POA, target object, and target method implementation. The POA identifier is used to locate the POA. In the performance model the aforementioned processing steps (including the demultiplexing step to obtain the target POA, but excluding the other de-multiplexing steps) are modeled by a service demand brec.
The request is forwarded to the located POA, one of Npoa POAs. De-multiplexing continues with locating the target object in the POA’s active object map, using the earlier obtained target object identifier. Now we have located the CORBA skeleton of the target object. The last de-multiplexing step is to locate the method implementation inside the skeleton. Finally, the request is dispatched to the target object’s skeleton. These two demultiplexing steps and the dispatching are modeled by a service demand bdisp. The remainder of the request (partial un-marshaling already took place earlier), including the request parameters, is un-marshaled by the skeleton. This un-marshaling step is modeled by a service demand bunm_i,j. The service demand depends on the amount and type of data that needs to be un-marshaled. The method implementation is invoked with the un-marshaled method parameters. The service demand of the method implementation is modeled by bser_i,j (CPU service demand) and bsern_i,j (delay introduced by non-CPU resources). In the threaded threading strategy only one method at a time can be active inside any POA. Access to all objects needs to be serialized. The un-marshaling of the request parameters and the invocation of the method implementation are protected by a mutex, as depicted in the performance model by the ORB mutex (a FIFO queue). The critical section, protected by the mutex, is denoted by a dashed line drawn around the involved service centers. In this threading strategy the servants don’t have critical sections, as they are single-threaded. As with the thread-perclient model, the service centers that represent the servants with
service demand bser_i,j and delay bsern_i,j may be replaced by submodels if the performance behavior of the servant cannot be captured using these parameters. After method invocation the return parameters need to be marshaled. This is modeled by a service demand bmar_i,j. The service demand depends on the amount and type of data that needs to be marshaled. Finally, a reply message is created with the marshaled return parameters. The reply is sent back to the client over the same TCP/IP connection as the request arrived. This last step is modeled by a service demand breply.
Receiver threads
λi,j,1
number of dispatcher threads is unbounded (they are created by receiver threads for incoming requests, as long as the operating system has sufficient resources for the threads) it can lead to an uncontrolled growth of dispatcher threads. When a lot of threads are simultaneously active the memory resources of the machine are drained, and the overhead caused by thread context switches can lead to trashing behavior, where little time is left for actual request processing. Figure 4 contains the performance model in an extended queuing network notation.
Dispatcher threads
bser bsern
∞ brec
btc
Root POA
bdisp
Servant 1 POA 1
bunm
bmar
breply
∞ λi,j,2
bser bsern
∞ brec
btc
Servant N ser_1 POA 1
POA 2 btk
λi,j,k
∞
bser bsern
∞ brec
btc
ST POA N POA
bdisp
bunm
ST POA mutex
Ncon
Servant 1 POA NPOA bmar
breply
∞ bser bsern
Servant N ser_1 POA NPOA
logical resource layer All threads share CPU, I/O and memory resources
physical resource layer
Figure 4. Server side performance model for the thread-per-request model
3.3 Thread-per-request
Performance model description
The thread-per-request threading strategy separates the request receiving and dispatching steps into separate threads. After the receiver thread receives a request from a client, a new thread is spawned to dispatch the request to the servant. Execution of the method implementation takes place in that dispatcher thread. After spawning the dispatcher thread and forwarding the request to that thread, the receiver thread is ready to receive the next request from the client. When the dispatcher thread is done with dispatching the request to the servant and sending the reply back to the client, it kills itself. The advantage of this threading strategy is that multiple requests from the same client can be dispatched to servants concurrently. The disadvantage of this threading strategy is the costs of thread creation and destruction for every request. Especially for requests that require little time to complete, the added overhead of thread creation and destruction is relatively high. However, for requests that take a long time to complete this threading strategy is useful, because it doesn’t block further requests by the same client. Because the
Requests arrive at receiver threads with connection k (of Ncon connections) with request arrival rate λi,j,k for POA i and Object j. During request processing the receiver thread is occupied, this resource possession is depicted by a dashed line around the receiver thread logical resource. The thread-per-request model implements the separate-thread dispatching model: requests are received in receiver threads and dispatched to servants in other threads, the dispatcher threads. While the receiver thread is receiving a request, newly incoming requests queue in the FIFO queue. The receiver thread first receives the request from the network, then it un-marshals the request header and a part of the request body, to obtain the POA and object identifiers. A series of request de-multiplexing steps is needed to locate the target POA, target object, and target method implementation. The POA identifier is used to locate the POA. In the performance model the aforementioned processing steps (including the demultiplexing step to obtain the target POA, but excluding the
other de-multiplexing steps) are modeled by a service demand brec. Then, a new dispatcher thread is created by the receiver thread. The cost of thread creation is modeled by the service demand btc. The dispatcher thread continues processing the request, and the receiver thread is now ready to receive the next request from the queue. The dispatcher thread forwards the request to the located POA, one of Npoa POAs. De-multiplexing continues with locating the target object in the POA’s active object map, using the earlier obtained target object identifier. Now we have located the CORBA skeleton of the target object. The last de-multiplexing step is to locate the method implementation inside the skeleton. Finally, the request is dispatched to the target object’s skeleton. These two de-multiplexing steps and the dispatching are modeled by a service demand bdisp. The remainder of the request (partial un-marshaling already took place earlier), including the request parameters, is un-marshaled by the skeleton. This un-marshaling step is modeled by a service demand bunm_i,j. The service demand depends on the amount and type of data that needs to be un-marshaled. The method implementation is invoked with the un-marshaled method parameters. The service demand of the method implementation is modeled by bser_i,j (CPU service demand) and bsern_i,j (delay introduced by non-CPU resources). A POA may be configured using the single-thread threading policy, meaning that only one method at a time can be active inside the POA (i.e. in the objects managed by that POA). Access to the objects managed by this POA needs to be serialized. In single-threaded POAs the un-marshaling of the request parameters and the invocation of the method implementation are protected by a mutex, as depicted in the performance model by the ST-POA mutex (a FIFO queue). The critical section, protected by the mutex, is denoted by a dashed line drawn around the involved service centers. The Root POA, the POA created when the ORB starts, is always configured to be multi-threaded (it uses the ORB Controlled Model threading policy by default). The servant implementation may have a critical section too, which can also be modeled by FIFO queues as depicted in the model. The service centers that represent the servants with service demand bser_i,j and delay bsern_i,j may be replaced by submodels if the performance behavior of the servant cannot be captured using these parameters. After method invocation the return parameters need to be marshaled. This is modeled by a service demand bmar_i,j. The service demand depends on the amount and type of data that needs to be marshaled. Finally, a reply message is created with the marshaled return parameters. The reply is sent back to the client over the same TCP/IP connection as the request arrived. This last step is modeled by a service demand breply. Now that the request dispatching is done and a reply has been sent to the client, the dispatcher thread kills itself. The cost of killing the thread is modeled by a service demand btk.
3.4 Thread-pool The thread-pool threading strategy addresses the disadvantages of the thread-per-request threading strategy, while still implementing
the separate-thread dispatching model. In the thread-pool model the dispatcher threads are pre-created. Idle dispatcher threads are put in a pool, the dispatcher thread-pool. When a request arrives at the receiver thread, it doesn’t need to create a new thread for request dispatching, instead the receiver thread forwards the request to the thread-pool, where it is queued (in FIFO order). The thread-pool request queue is monitored by the idle dispatcher threads. Idle dispatcher threads remove requests from the queue, and dispatch them to servants. When the dispatcher thread is done, it doesn’t kill itself, but instead it returns to the thread-pool. The thread-pool has a fixed size. Therefore the thread-pool threading strategy doesn’t suffer from the uncontrolled thread growth phenomena, unlike the thread-per-request model. Also, since threads are pre-created, the thread creation and destruction costs btc and btk of the thread-per-request model are not present here. Figure 5 contains the performance model in an extended queuing network notation. Performance model description Requests arrive at receiver threads with connection k (of Ncon connections) with arrival rate λi,j,k for POA i and Object j. During request processing the receiver thread is occupied, this resource possession is depicted by a dashed line around the receiver thread logical resource. The thread-pool model implements the separatethread dispatching model: requests are received in receiver threads and dispatched to servants in other threads, the dispatcher threads. While the receiver thread is receiving a request, newly incoming requests queue in the FIFO queue. The receiver thread first receives the request from the network, then it un-marshals the request header and a part of the request body, to obtain the POA and object identifiers. A series of request de-multiplexing steps is needed to locate the target POA, target object, and target method implementation. The POA identifier is used to locate the POA. In the performance model the aforementioned processing steps (including the demultiplexing step to obtain the target POA, but excluding the other de-multiplexing steps) are modeled by a service demand brec. Then, the receiver thread forwards the request to a FIFO request queue in front of the dispatcher thread-pool. The dispatcher thread-pool contains Ndisp threads. The request remains in the queue until a dispatcher thread is available to dispatch the request. The dispatcher thread forwards the request to the located POA, one of Npoa POAs. De-multiplexing continues with locating the target object in the POA’s active object map, using the earlier obtained target object identifier. Now we have located the CORBA skeleton of the target object. The last de-multiplexing step is to locate the method implementation inside the skeleton. Finally, the request is dispatched to the target object’s skeleton. These two de-multiplexing steps and the dispatching are modeled by a service demand bdisp. The remainder of the request (partial un-marshaling already took place earlier), including the request parameters, is un-marshaled by the skeleton. This un-marshaling step is modeled by a service demand bunm_i,j. The service demand depends on the amount and type of data that needs to be un-marshaled. The method implementation is invoked with the un-marshaled method parameters. The service demand of the method implementation is
modeled by bser_i,j (CPU service demand) and bsern_i,j (delay introduced by non-CPU resources).
4. Performance experiments of threading strategies
A POA may be configured using the single-thread threading policy, meaning that only one method at a time can be active inside the POA (i.e. in the objects managed by that POA). Access to the objects managed by this POA needs to be serialized. In single-threaded POAs the un-marshaling of the request parameters and the invocation of the method implementation are protected by a mutex, as depicted in the performance model by the ST-POA mutex (a FIFO queue). The critical section, protected by the mutex, is denoted by a dashed line drawn around the involved service centers. The Root POA, the POA created when the ORB starts, is always configured to be multi-threaded (it uses the ORB Controlled Model threading policy by default). The servant implementation may have a critical section too, which can also be modeled by FIFO queues as depicted in the model. The service centers that represent the servants with service demand bser_i,j and delay bsern_i,j may be replaced by submodels if the performance behavior of the servant cannot be captured using these parameters.
In this section we compare the performance of the four common threading strategies implemented in the IONA ORBacus CORBA implementation for Java. We start by explaining the workload generator and our performance measurement tool. After describing the experimental set-up we present and discuss the experimental results, including some recommendations for when to use a certain threading strategy.
4.1 Workload generation For the presented experiments we used a closed-loop request arrival process, as illustrated in Figure 6. Initially each client sends a single request and waits for the reply. Then a new request is sent after the reply to the previous request is received by the client. This way each client has at most one outstanding request. The reason for using a closed arrival process, instead of an open arrival process, is twofold. First of all, in a set-up with open arrivals TCP/IP sessions have to be set-up and terminated during the experiments. This overhead will degrade the end-to-end performance, and the performance of the threaded and thread-perclient strategy will be affected most. Because we are focusing on a fair comparison of server performance we want to exclude this effect from our results. Secondly, since we are comparing the performance of several threading strategies, the most interesting results are regarding the performance under ‘maximum load’ instead of under light load. With the closed loop arrival process used in this paper, the ‘maximum load’ for each strategy is realized automatically.
After method invocation the return parameters need to be marshaled. This is modeled by a service demand bmar_i,j. The service demand depends on the amount and type of data that needs to be marshaled. Finally, a reply message is created with the marshaled return parameters. The reply is sent back to the client over the same TCP/IP connection as the request arrived. This last step is modeled by a service demand breply. Now that the request dispatching is done and a reply has been sent to the client, the dispatcher thread returns to the thread-pool and is ready to process the next request.
Receiver threads
λi,j,1
Dispatcher threads
bser bsern
∞ brec
Root POA
bdisp
Servant 1 POA 1
bunm
bmar
breply
∞ λi,j,2
bser bsern
∞ brec
λi,j,k
∞
POA 2
∞
Ncon
Pool of Ndisp threads
ST POA N POA
bdisp
Servant 1 POA NPOA
bser bsern
∞ brec
Servant N ser_1 POA 1
bunm
ST POA mutex
bmar
breply
∞ bser bsern
Servant N ser_1 POA NPOA
logical resource layer All threads share CPU, I/O and memory resources
physical resource layer
Figure 5. Server side performance model for the thread-pool model
A B
C
D
busy
E busy
blocked
Performance experiments often iterate one or more parameters in the scenario. For instance, a series of experiments can be performed to study the effect of an increasing number of clients. We use scripts that iterate these parameters and instantiate workload scenario templates using the parameter values.
Client
busy
Server
busy
4.2 Performance measurement
idle
Network
idle
server-side dynamics, and therefore, detailed characterization of the request patterns generated by the client side is beyond the scope of this paper.
busy
In this section we shortly describe how we obtain performance measurements of the ORBacus CORBA implementation using the Java Performance Monitoring Toolkit (JPMT) [HQG+02].
idle
time Figure 6. Request timing diagram We developed a workload generator to automate performance experiments with different scenarios. The workload generator consists of a client and server application. The client-side application executes a given workload on the server application. The workload description consists of a collection of arrival processes. An arrival process description consists of: •
The number of clients that generate requests.
•
The total number of requests to generate.
•
The targets of the arrival process. A description of a target consists of the name of the remote object, the name of the method to invoke, and (if applicable) requests parameters (payload). If an arrival process has multiple targets, then by default the requests are equally distributed over the targets.
The server-side application offers the following scenario configuration options: •
Specification of the POA hierarchy, including POA managers and POA policies (e.g. single-threaded POAs).
•
Deployment of objects on the specified POAs.
•
Service demands for methods in the object implementation. Both CPU time usage and idle, waiting time can be described. The CPU time can be used to model work that is done by the object implementation. The waiting time can be used to simulate that the object implementation is waiting for an external entity, for instance a query to a remote SQL database.
•
Configuration options for the ORB, for instance which threading strategy to use or connection reuse policies.
We emphasize that support for non-synthetic workload generation with open request arrival processes (e.g., trace-driven load generation) can easily be added to the experimental setup. However, the focus of the present paper is on modeling of the
JPMT represents the execution behavior of applications by event traces, in which each event represents the occurrence of some activity, such as a method invocation or the creation of a new thread of execution. JPMT’s event traces are similar to call-trees, but in addition to method invocations they also contain other event types. Events are annotated with high-resolution timestamps, and depending on the event type other attributes such as used CPU time. The event traces produced by JPMT provide highly detailed performance information. We developed post-processing scripts to interpret this information, by traversing the event traces and summarizing the measurements. The CORBA experiment report produced by the post-processing scripts includes detailed information, regarding request throughput, completion times and a break-down of completion times in terms of CPU time usage, garbage collection, and time spent waiting for locks. The throughput is defined as the total number of requests handled by the server, divided by the elapsed time between end and start of the experiment. The completion time of a request is defined as the elapsed time between request arrival at the server and sending the reply towards the client. Further, the queuing times at the dispatcher thread pool and the request throughput are reported. For the purpose of performance comparison of threading strategies we focus on a comparison of the throughputs.
4.3 Experimental setup We compare the four threading strategies of ORBacus with an increasing number of connected clients. Each client has its own TCP/IP connection to the server ORB, and thus its own receiver thread on the server. Our test-bed consists of two machines: Utip267 and Utip442. Utip267 is a Pentium IV 1.7 GHZ with 512 MB of memory. Utip442 is a Pentium III 550 MHz with 256 MB of memory. In these experiments Utip442 acts as the CORBA server and Utip267 as the CORBA client. Notice that we used the faster machine as the client in order to make sure that the client does not become the bottleneck in the experiments. In particular, for all results presented below we verified that the request rate generated by the client was at least enough to keep the server busy at all times (i.e. the client is not the bottleneck). Both machines run the Linux 2.4.19 operating system and the Sun Java 2 standard edition v1.4.1. The Java virtual machine is configured with default garbage collection settings and without run-time precompilation optimization features. The CORBA implementation we use in this example is IONA ORBacus/Java 4.1.1. The threadpools used in the experiments with the thread-pool strategy hold a number of threads equal to the number of clients (i.e. it varies
with the number of clients). The following is a fragment of the IDL definitions used in the experiments.
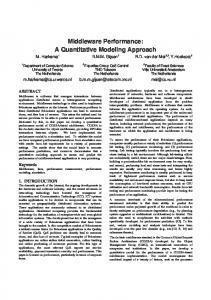
1 ms servant CPU demand
Throughput comparison (1 ms servant CPU) 400 350 300 Thread-per-client
250
Threaded
200
Thread-per-request
150
Thread-pool
100 50 0 0
10
20
30
40
50
60
70
num ber of clients
Figure 7. Throughput for 1 ms servant CPU demand interface PerformanceTest { long doSomeWork(); };
The doSomeWork method executes a configured work-load on the system. In the experiments we use three workload cases. The 1 ms CPU demand scenario represents the CPU processing cost of a simple method. The 5 ms CPU demand represents the CPU processing costs of a scenario with a more complex method (a CPU bound application). Finally, the 50 ms delay (not CPU processing time) represents the delay induced from a simple SQL query on a database server running on another machine (an I/O bound, database driven application). All service demands and delays are configured to have an exponential distribution. We run the experiment with 2, 4, 8, 16, 32 and 64 clients. Some experiments are also executed with 128 clients, depending on the CPU utilization at 64 clients. Each client executes a work-load of 200 requests on the server. We also have configured a minimum duration of 45 seconds for each experiment, so that we get enough measurements for runs with a small number of clients.
4.4 Experimental results This section summarizes the experimental results. In all experiments the thread-per-client threading strategy is expected to be the most efficient, since we use single-threaded clients executing one blocking request at a time. In this scenario it doesn’t make sense to release the receiver thread for processing forthcoming requests, since they won’t arrive because the client is single threaded and blocking until it receives a reply for the current outstanding request. Therefore, the results for the threadper-client strategy can be regarded as best case results. We emphasize that this observation is based on our choice to use a closed arrival process.
Figure 7 shows the throughput (in number of requests per second) as a function of the number of clients, for the different threading strategies. The results demonstrate that the thread-per-client and thread-pool threading strategies perform best in this experiment and scale well with the number of connected clients. The slow decrease of the throughput presented in Figure 7 is due to the fact that the CPU service time per request increases slightly from roughly 1.8 ms for 2 clients to 2.3 ms for 64 clients. This increase in CPU service time is most likely due to additional context switching activity. The thread-per-request strategy suffers from high thread creation and destruction costs, especially compared to the small service demand of 1 ms CPU time. This is the reason why the throughput obtained with the thread-per-request strategy is lower than the throughput for the thread-per-client and thread-pool strategy. For the threaded strategy the ORB mutex turns out to be a bottleneck, especially with a large number of clients. In particular, the locking activity strongly increases the processing time. For 2 clients the CPU service time per request is approximately equal to 1.8 ms, while for 64 clients the CPU times have increased to 5.4 ms. The increase of CPU times causes the linear decrease of throughput for the threaded strategy shown in Figure 7.
5 ms servant CPU demand Figure 8 contains the throughputs for the different threading strategies and the scenario with 5 ms CPU servant demand. First of all, note that the throughputs are significantly lower than the throughputs for the previous case. Of course, this is due to the fact that the servant is now more CPU demanding. Similar as for the previous scenario the thread-per-client and thread-pool perform best of the four threading strategies.
The throughput for the thread-per-request strategy remains smaller than the throughput for the thread-per-client and threadpool strategy, but relatively the thread-per-request strategy performs better in this scenario. For a scenario with 1 ms CPU servant demand the throughput for the thread-per-request strategy was between 75 and 80% of the throughput for the thread-perclient strategy. For the 5 ms CPU servant demand the relative throughput increases to between 85 and 90%. This relative improvement of the thread-per-request strategy is due to the fact that the thread creation and destruction overhead becomes less,
requests/s. For a large number of clients the CPU becomes the bottleneck. For the thread-per-client and thread-pool strategy this point is reached at approximately 30 clients. For the more CPU demanding thread-per-request strategy this point is reached around 20 clients. For the threaded strategy we observe a completely different throughput performance. Again, this is due to the ORB mutex, which does not allow the servant to be invoked by more than one request at the time. In combination with the ‘loop time’ observation above, it follows that the servant can never handle
Throughput com parison (5 m s servant CPU) 160 140 120
Thread-per-client
100
Threaded
80
Thread-per-request
60
Thread-pool
40 20 0 0
10
20
30
40
50
60
70
num ber of clients
Figure 8. Throughput for 5 ms servant CPU demand relative to the increased servant CPU demand. For the threaded strategy we observe the same phenomenon as for the previous scenario. For a small number of clients the throughput performance is comparable to the throughput achieved with the thread-per-client and thread-pool strategy. However, for a large number of clients the throughput performance becomes significantly worse. Again this is caused by the additional CPU demand for handling locking contention for the ORB mutex of the threaded threading strategy.
50 ms servant delay Figure 9 contains the throughput comparison for the thread-perclient, thread-per-request, thread-pool and threaded threading strategies, for 50 ms ‘sleep time’ at the servant. The performance of thread-per-client and thread-pool is the same again. Observe that the throughput curves are different from the previous throughput curves. In particular, for a low number of clients the throughput increases linear with the number of clients. This effect is due to the servant ‘sleep time’ of 50 ms. Observe that the sleep time causes that the request ‘loop time’ (i.e. the elapsed time between two consecutive arrivals of a request at the server) is at least 50 ms and this provides an upper bound on the maximum throughput per client, of 1 / 0.05 = 20 requests/s. Then, for n clients the maximum achievable throughput equals n x 20
more than 20 requests/s. And this exactly corresponds to the throughput results shown in Figure 9. To summarize, the thread-per-client threading strategy is the best performer. This was to be expected since the work-load of clients executing one request at a time perfectly fits that threading strategy. The thread-pool is overall the second best performer. Contrary to the thread-per-client threading strategy, the threadpool model also copes with multi-threaded clients, which invoke more than one method at a time over a client-server connection. In the thread-per-client threading strategy the receiver thread is not separated from the method dispatching thread, i.e. the server ORB cannot handle requests coming from the same client concurrently. The thread-pool model is a good choice for applications that have multi-threaded clients.
4.5 Guidelines for choosing threading strategy When designing and implementing an application, the choice of which threading strategy to use is an important issue. In many cases the requirements of an application already point to certain threading strategies. For instance,
Throughput comparison (50 ms servant delay) 550.00 500.00 450.00 400.00 350.00
Thread-per-client
300.00
Threaded
250.00
Thread-per-request
200.00
Thread-pool
150.00 100.00 50.00 0.00 0
10
20
30
40
50
60
70
num ber of clients
Figure 9. Throughput for 50 ms servant delay •
Legacy applications would use the threaded model if they cannot handle concurrent requests.
•
Applications that want to restrict the number of simultaneous method invocations by a client can use thread-per-client, so that only one request at a time is handled for each client.
•
Thread-per-client or thread-pool would be used for applications with multi-threaded clients.
•
Applications that will likely suffer from uncontrolled thread growth, for instance, when bursts of requests are expected at times, can use thread-pool with a number of pre-allocated threads.
•
Applications with CPU intensive servants will likely want to limit the number of simultaneously active dispatching threads, for instance for QoS reasons. These applications would use the thread-pool threading strategy. The threadper-client threading strategy could also be used to this end, but the number of clients should be bounded.
Applications whose client-side is not multi-threaded will not benefit from the thread-per-request and thread-pool threading strategies. The server-ORB should be deployed with the threadper-client threading strategy if only single-threaded clients connected, or clients that only invoke one (blocking) method at a time. Single-threaded clients that use non-blocking requests (oneway asynchronous or deferred synchronous), could still benefit from the concurrency of thread-per-request or thread-pool.
implementations of middleware, such as Visibroker, Orbix, JacORB and OpenORB. As indicated in section 2.3, we expect that the impact of the implementation details are negligible compared to the impact of threading strategies. Nonetheless, investigation of other CORBA implementations is a challenging topic for further research. Second, the models presented in this paper may be refined in various directions (as indicated in the discussion of the numerical result), for example by adding the impact of context switching and the processing time involved in locking activity. Third, our experiments may be performed with open arrival processes instead of the closed-loop approach taken in the current measurement setup. Finally, since performing simulation experiments may be very time consuming, we plan to develop and validate simple, fast and fairly accurate approximations for the throughput for the different threading strategies.
6. Acknowledgements This work was partly carried out within the EQUANET project, an “ICT-doorbraakproject” which is supported by the Dutch Ministry of Economic Affairs via its agency Senter. Information on the EQUANET project is available from http://equanet.cs.utwente.nl/.
7. References HQG+02
M. Harkema, D. Quartel, B.M.M. Gijsen, R.D. van der Mei, Performance Monitoring of Java Applications, Proc. of the 3rd Workshop on Software and Performance (WOSP) 2002, ACM Press, Rome, Italy.
Jain91
R. Jain, The art of computer systems performance analysis: Techniques for experimental design, measurement, simulation, and modeling, John Wiley & Sons, 1991.
5. Future work The results presented in this paper one the one hand provide new and fundamental insight in the impact of the different threading strategies on the performance, but on the other hand raise a number of challenges for further research in this area. First, it is necessary to investigate the performance under other
LZG+84
E.D. Lazowska, J. Zahorjan, G.S. Graham, K.C. Sevcik, Quantitative system performance, Computer system analysis using queueing network models, Prentice Hall, Inc., 1984.
OMG01
Object Management Group, The Common Object Request Broker: Architecture and Specification, revision 2.5, OMG document formal/2001-09-01, 2001.
Vinoski97
S. Vinoski, CORBA: Integrating diverse
applications within distributed heterogeneous environments, IEEE Communications Magazine, February, 1997.