Nigerian Journal of Technology (NIJOTECH) Vol. 35, No. 4, October 2016, pp.949 – 956 Copyright© Faculty of Engineering, University of Nigeria, Nsukka, Print ISSN: 0331-8443, Electronic ISSN: 2467-8821 www.nijotech.com
http://dx.doi.org/10.4314/njt.v35i4.33
PERFORMANCE EVALUATION OF CLAY-SAWDUST COMPOSITE FILTER FOR POINT OF USE WATER TREATMENT C. C. Nnaji1,*, B. C. Afangideh2 and C. Ezeh3 1,3 DEPARTMENT OF CIVIL ENGINEERING, UNIVERSITY OF NIGERIA, NSUKKA. ENUGU STATE. NIGERIA 2,DEPARTMENT OF CIVIL ENGINEERING, AKWA IBOM STATE UNIVERSITY, MKPAT-ENIN. AKWA IBOM STATE. NIGERIA
Email addresses: 1
[email protected], 2
[email protected], 3
[email protected] ABSTRACT
Water borne diseases have remained a major challenge in most developing countries. This is usually as a result of lack of access to clean water and contamination associated with water fetching and conveyance. This work explores the possibility of improving water quality and eliminating the possibility of recontamination by the use of point of use (POU) water filters made from cheap locally available materials. The performance of POU water filters for the purification of water obtained from various sources was investigated. Sawdust was used as a burnout material in order to enhance the rate of filtration. The clay was first characterized and then various proportions (5%, 10%, 20%, 30% and 50% by weight) of sawdust were mixed with the clay for filter production. The clay was found to have a specific gravity of 2.4, a high liquid limit of 81.6% and a medium plastic limit of 48.54%. The flow rates of the filters ranged between 0.0005litres/hr for the filter with 5% sawdust and 0.8litres/hr for the filter with 50% sawdust. The average removal of suspended solids (SS) and biochemical oxygen demand (BOD) was 98.6% and 33% respectively while the mean Log10 reduction in total count (TC) was 93.1%. Result of analysis of variance showed that there was no significant difference between the performances of the filters. However, there was a significant difference between the flow rates with F(18.71) > F critical (5.14). This implies that while burnout materials improve water quality, increasing burnout materials in clay filters beyond 50% does not significantly affect the performance for the filter with respect to the quality of effluent but with respect to flow rate. Keywords: Point of use, filter, water, water treatment, sawdust. 1. INTRODUCTION Access to safe drinking water is essential to health and a fundamental human right. However, about 13% (884 million) of the people in the world lack access to potable water [1]. Water related diseases are among the leading cause of death in developing countries where access to drinking water has remained a mirage. Many people in rural and semi urban areas of developing countries are not connected to municipal water facilities; hence they resort to self-help means of water supply. Most of the available water sources such as streams, rivers and wells have been impaired by anthropogenic activities, thereby rendering them unsafe for consumption. Besides, the process of fetching and conveyance can introduce impurities into water. This problem can be minimized by POU water treatment systems. POU treatment systems are water treatment systems used for treating water at the point
* Corresponding author, tel: +234-803-894-8808
of use, usually at household levels. POU systems help to drastically reduce contamination associated with transmission and conveyance. In recent years, pointof-use systems have gained new-found popularity as solutions to water issues in the developing world [2]. Safe storage is an important aspect of some systems used for drinking water treatment or safe storage containers may be used as a stand-alone technology for protecting water quality where the main source of contamination is improper handling [3]. Ideally, POU systems can also safeguard against stored water contamination in the home through unsafe water handling practices, known to be a major cause of degraded drinking water quality [4]. Point-of -use (POU) filtration system includes porous clay filters, cloth or fiber filters, membrane filters, and granular media filter. These filters reduce microbes by a combination of physical, chemical and biological
PERFORMANCE EVALUATION OF CLAY-SAWDUST COMPOSITE FILTER FOR POINT OF USE WATER TREATMENT
processes including physical straining, sedimentation, and adsorption; and have been proven to be very effective in reducing Vibrio cholera in water [5, 6]. Colwell [5] reported a 48% reduction in cholera associated with use of the filters over a 35 month trial that included 65 villages in rural Bangladesh and approximately 133,000 participants. Filtration technologies are finding increasing application in developing countries where chemical disinfection or boiling may not always be practical or effective [5]. Studies have shown that these filters which are locally or commercially designed and produced are effective in the removal of microbial pathogens in water [7, 8]. One of the simplest and most common POU water treatment systems is the clay filter. Clay filtration is the use of porous fired clay to filter microbes or other contaminants from drinking water. The basic mechanism is the exclusion of particles larger than the mean pore size. The pore sizes are sometimes small enough to trap anything larger than a water molecule [9]. The performance of clay filters can be significantly improved by the use of burnout materials which increase flow rate by creating a network of pores and the use of bactericidal compounds for destruction of pathogens. Low cost clay filtration for drinking water treatment in developing countries is diverse, varying by overall design, production method, clay and other materials, quality assurance and quality control, procedures, burnout material, firing temperatures and methods, and sometimes chemical (e.g., colloidal silver) amendments, and other characteristics [10]. Unlike chemical or thermal disinfection, clay filters do not significantly change water taste or temperature and do reduce turbidity [3, 11]. Filters have functional stability in the sense that they have only one moving part (the tap) and require no external energy source [12]. They have a potentially long useful life of about 5 years or more with proper care and maintenance [13]. One of the most important properties of clay is its rheological properties which are a function of pH of solution, structure, particle size, shape, and surface characteristics of the dispersed phase [14]. Controlling the rheological property of clay is often indispensable in industrial processes and practical applications involving ceramics processing (meltprocessing behavior such as injection molding) or paper coating [15]. Moreover, this property has allowed for the development of clay-based composites and nanocomposite materials. Clay water filters are usually compacted into cylindrical shaped clay pot using a hydraulic or Nigerian Journal of Technology
C. C. Nnaji, et al.
manual press and then allowed to dry in ambient condition, followed sintering (or firing) of clay pot at high temperature [8]. While the removal of microbes from water is done using particle size occlusion, chemical contaminants can also be removed from water by adsorption process. This work was conducted to check the effect of various proportions of sawdust on the performance of POU use water filters. 2. METHODOLOGY The main raw materials used for the production of the filter are clay, water, and various proportions of burnout materials (sawdust). Clay was obtained from the ceramics studio of Arts Department, University of Nigeria, Nsukka. The clay was first characterized. Specific gravity and Atterberg limits were determined according to BS 1377. Atterberg limits test was carried out in order to assess the plasticity of the clay and its consistency at different moisture contents. Clay in a plastic state can be easily molded without breaking. 2.1 Filter Production Five hundred grams (500g) of clay was soaked in a bowl of water for 24 hours for complete hydration. The soaked clay was sieved with a BS sieve size of 699mm. The slurry passing through the sieve was allowed to stand for 24 hours. The water was then decanted leaving behind a thick solution of clay, which was then laid on a bay for air drying. The dried clay was ground and sieved before mixing with friable material. It is important to note that ASTM Standard C 618-98 (American Society of Testing and Materials) set a minimum value of 70% for the sum of silica, alumina and iron oxide of the total compounds making up the clay material with sulphur dioxide less than 4% and loss on ignition of less than 10%. Table 1 gives typical chemical composition of clay. Burnout materials were added to the clay to increase the porosity by creating pores in the ceramic material when fired. Table 1: Chemical compositions of clay [16] Oxides
% Composition by mass of clay
SiO2 Al2O3 Fe2O3 MgO CaO TiO2 Na2O K2O Zr MnO
63.35 22.42 6.109 1.351 0.689 0.923 0.789 2.878 0.045` 1.351 Vol. 35, No. 4, October 2016
950
PERFORMANCE EVALUATION OF CLAY-SAWDUST COMPOSITE FILTER FOR POINT OF USE WATER TREATMENT
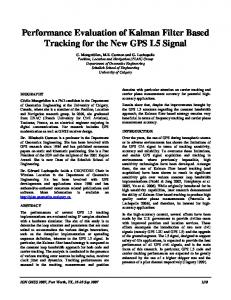
The most used materials are combustible materials. When the mass is fired, the combustible material burns out leaving corresponding pore spaces. The porosity of the fired mass is roughly proportional to the volume of combustible matter added. The main combustible materials are hard wood sawdust, corn husks, starch and rice husks. In this work, sawdust was used because of their abundance at Nsukka Timber Market in Enugu State Nigeria. The sawdust was sieved with three sets of sieve (5, 8 and 22 sieve) and material retained on 22 sieves was used. Five percent (5%), 10%, 20%, 30%, 40% and 50% of sawdust was added to a fixed amount of clay (6kg); and the filters produced were designated as A, B, C, D, E and F respectively. The dry mix of clay and sawdust was mixed thoroughly before addition of water. More water was added until the clay began to hold its shape when squeezed out through the hands
Figure 1a: Sieve numbers 5, 8 and 22
C. C. Nnaji, et al.
The mixture was then kneaded in order to expel all of the air out of the mixture. The mixture was pressed into the desired shape and label markings made on them before firing. The filters were then fired in a kiln at 9000C for 8 – 9 hours. The filters were then removed from the kiln and allowed to cool to room temperature. Sintering (or firing) usually results in (further) reduction in porosity, increase in density (densification) and an increase in strength of the material. During sintering, the volume shrinkage which occurs is just equal to the porosity decrease and varies from a few to 30 or 40 percent by volume, depending on the forming process and the ultimate density of the fired ware. After cooling, the filters were thoroughly soaked in water in preparation for flow test. The flow rate tests were done by filling the filter with water and allowing it to stand for 1hr, after which the quantity of filtrate was calculated.
Figure 1b: Sawdust retained on sieve number 22
Figure 2: Filter Formation
Nigerian Journal of Technology
Vol. 35, No. 4, October 2016
951
PERFORMANCE EVALUATION OF CLAY-SAWDUST COMPOSITE FILTER FOR POINT OF USE WATER TREATMENT
Figure 3a: Finished Filter
3. RESULTS AND DISCUSSIONS The specific gravity of the clay was obtained as 2.4. This specific gravity value lies within the expected range of 1.8 to 2.6 for pure clays. The clay has a high liquid limit of 81.6% and a medium plastic limit of 48.54%. Hence the clay can be classified as CH or OH inorganic clay. Clay soils having liquid limit greater than 50% are categorized as high quality pottery clay. The plasticity index is 25.54%. 3.1 Flow Rate The flow rate through the filters was found to vary with increase in proportion of sawdust. Figure 4 shows that the flow rate varied from 0.0071litres/hr for the filter with 5% sawdust to 0.86 l/hr for filter with 50% sawdust. The most porous of the filters studied (50% clay water filter), exhibited the fastest discharge, followed by the two reference filter (20%, & 30%). The slowest discharge rates were associated with the 5% CWF. Therefore, the rate of water discharge by CWF increases with porosity, or in other words with the fraction of sawdust used in making the filter. Lantagne [17] reported that the flow rates obtained for the 50% CWF were between 0.80 and 1 litres/hr during the first two hours of test. Similarly, the Kenya study of candle filters reported the Doulton Super Sterasyl filter to have an average flow rate of 0.24litres/hr in the field when the product was advertised to have a flow rate of 1.3 litres/hr [18]. To prevent performance reduction, users need to scrub their filter with a brush once it becomes noticeably slower. Half of the families in one study scrubbed their filters no more than once every other week [19]. Scrubbing can substantially increase flow rate, as demonstrated when the flow rate of a filter increased from 0.56 litres/hr to 1.0 litres/hr following scrubbing in the laboratory. Flow rates for the 5% and 10% Nigerian Journal of Technology
C. C. Nnaji, et al.
Figure 3b: Flow Test Set up
CWFs were well below this level. The level of permeability of a porous CWF gives a measure of the relative ease at which water (or any other fluid) will flow through it. The pore size and pore size distribution of a filter are important in determining the filters’ efficacy at removing particulates from water. There are additional factors that will influence flow rate once the filter is in use such as the suspended solids (SS) of source water, the frequency that the filter is scrubbed, and the hydraulic head above the filter. Figure 4 is an indication that the increasing sawdust content of the CWFs increases the filtration rate exponentially. It was also found that a rapid estimation of the flow rate can be performed by using the time of first drop of water to break through the filter. A power relation was obtained between the flow rate and time of first drop (Tf) as follows: A major concern about locally fabricated POU filters is their ability to produce adequate drinking water. The ability of the filters to produce enough drinking water is a function of the flow rate, number of persons served and the average rate of drinking water consumption. Table 1 adapted from [20] and modified shows that average daily water intake ranges between 1.8 and 5.0 litres per capita per day (lpcd). The volume of water produced per day by the filters was estimated using the determined flow rate. Only the filters with 30% and 50% sawdust were considered since the other filters did not produce reasonable amount of filtrate. Figure 5 shows that for an average water intake of 3 lpcd, the filter with 50% sawdust can conveniently serve a household of six persons while the filter with 30% sawdust can barely serve two persons. It is obvious that increasing the quantity of sawdust will definitely increase the quantity of filtrate, Vol. 35, No. 4, October 2016
952
PERFORMANCE EVALUATION OF CLAY-SAWDUST COMPOSITE FILTER FOR POINT OF USE WATER TREATMENT
however, the major challenge is that increasing sawdust content beyond the proportions used in this research will impair the quality of filtrate as well as the structural integrity of the filters. Filtration Rate (L/hr)
Time of first drop (s) 350
y = 10.394x3.1787 R² = 0.9773
y = 2.3064x-1.631 R² = 0.9765
1.2
300
1
250
0.8
200
0.6
150
0.4
100
0.2
50
0
Time of first drop (sec)
Rate of filtration (L/hr)
1.4
were subjected to filtration using the filters with a view to ascertaining their individual efficiencies. The water used for the test are rainwater obtained from local rainwater storage facility, storm water from rainfall runoff and well water from shallow well. Four water quality parameters viz: biochemical oxygen demand (BOD), suspended solids concentration as a measure of turbidity, pH and total bacterial count (TC) were determined before and after filtration. The quality of raw water is shown in Table 3. As expected, stormwater is much more polluted than rainwater and well water. Rainwater is the least polluted.
0 0%
10%
20%
30%
40%
50%
60%
Table 3: Quality parameters of raw water used in the study
Proportion of sawdust (%)
Figure 4: Effect of sawdust on rate of filtration
Water Source Rain Stormwater Well
Table 2: Drinking Water Requirement (Adapted from [20] and modified) Average Daily Water Intake (lpcd) 3.0 – 5.0 2.0 5.0 2.0 2.5 1.8 – 3.0 2.5 50% sawdust
Number of persons served per filter
C. C. Nnaji, et al.
Reference [20] [21] [22] [23] [24] [25] [26]
30% sawdust
14 12 10 8
6
y = 19.2x-1 R² = 1
y = 4.8x-1 R² = 1
4 2 0 0
1
2
3
4
5
6
Drinking water requirement (litres/day)
Figure 5: Adequacy of filtrate for household application
3.2 Filtration Efficiency In order to test the efficiency of the filters as POU treatment systems, water from three different sources
SS (mg/l) 1.623 5.34 2.032
BOD (mg/l) 11.4 11.622 12.01
TC (/100ml) 500 600 700
pH 7.20 7.5 7.1
The results for the turbidity of the filters obtained by using suspended solid test, shows that the turbidity increases with increasing proportion of sawdust. Generally, the filters were found to be very effective in removing suspended solids from water with removal efficiency ranging between 97.3% and 99.6% (Table 4 - 6). The increase in percentage of sawdust in the filters resulted in only very slight change (decrease) in suspended solids removal efficiency. Also slight decrease in pH of filtrate was observed as the quantity of sawdust in the filter decreases. The pH of the raw water samples were slightly basic, hence the decrease in pH of filtrate is possibly because of removal of dissolved solids by adsorption to the filter composite. The efficiency of log10 reduction of bacteria by the filters ranged between 91.8% and 94.86%. Very slight difference was observed in the performance of filters with different proportions of sawdust. Thus efficiency of the filters is not sacrificed by increasing the burnout material ratio within the range observed here.
Table 4: Filtration results for rainwater Filter A B C D
SS (mg/l) No filtrate No filtrate 0.014 0.036
Filtration Efficiency (%) 99.1 97.8
BOD (mg/l) No filtrate No filtrate 6.30 8.40
Filtration Efficiency (%) 44.8 26.3
TC (/100ml) No filtrate No filtrate 200 200
Log10 Reduction (%) 91.8 91.8
E
0.044
97.3
9.90
13.2
200
91.8
Nigerian Journal of Technology
Vol. 35, No. 4, October 2016
pH No filtrate No filtrate 6.9 7.1 7.1
953
PERFORMANCE EVALUATION OF CLAY-SAWDUST COMPOSITE FILTER FOR POINT OF USE WATER TREATMENT
C. C. Nnaji, et al.
Table 5: Filtration results for storm water Filter A B C D E
SS (mg/l) No filtrate No filtrate 0.019 0.037 0.045
Filtration Efficiency (%) 99.6 99.3 99.2
BOD (mg/l) No filtrate No filtrate 6.299 8.398 8.698
Filtration Efficiency (%) 45.8 27.7 25.2
TC (100/ml) No filtrate No filtrate 200 200 200
Log10 Reduction (%) 93.66 93.66 93.66
pH No filtrate No filtrate 7.1 7.1 7.1
Log10 Reduction (%) 94.86 94.86 91.46
pH No filtrate No filtrate 6.8 6.8 6.8
Table 6: Filtration results for well water Filter A B C D E
SS (mg/l) No filtrate No filtrate 0.010 0.040 0.041
Filtration Efficiency (%) 99.5 98 98
BOD (mg/l) No filtrate No filtrate 5.66 8.20 8.70
Filtration Efficiency (%) 52.87 31.72 27.58
TC (/100ml) No filtrate No filtrate 200 200 300
Table 7: ANOVA Results Showing Filter Performance Parameter
P-value 0.011 0.002 3.10E-09 5.50E-07
SS pH TC BOD
F
F critical 8.22 13.8 136 64.13
50% 30% 20%
50% 30% 20%
60.0
99.0 98.5
98.0 97.5 97.0 96.5
96.0
50.0
80.0
biochemicaloxygen demand
40.0
30.0 20.0 10.0
Stormwater
Well water
60.0 50.0
40.0 30.0 20.0 10.0
0.0 Rain water
plate count
70.0 Removal Efficiency (%)
suspended solids Removal Efficiency (%)
Removal Efficiency (%)
0.05 0.05 0.05 0.05
50% 30% 20%
100.0 99.5
Remark Moderate significance High significance Very high significance Very high significance
Sig 4.5 4.5 4.5 4.5
0.0 Rain water
Stormwater
Well water
Rain water
Stormwater
Well water
Figure 6: Comparison of filter performance
The performance of the filters with respect to suspended solids removal is very high compared with TC and BOD. This is expected since most of the suspended particles are larger than bacterial cells. The percentage reduction in water quality parameters especially with respect to BOD and TC are not as high as those recorded in similar works. This can be attributed to the characteristics of the raw samples used for the demonstration. An analysis of variance was done to ascertain whether there is a significant improvement of water quality by the filters. Table 7 shows that quality of water significantly improved after filtration. TC had the highest level of significance with a p value of 3.1E-09 and an F value of 136 greater than the critical value of F (4.5). In order to ascertain Nigerian Journal of Technology
whether increase in the proportion of sawdust has any significant impact on the performance of the filters with respect to suspended solids, biochemical oxygen demand and bacterial removal, an analysis of variance was performed on the experimental data. Essentially, the comparison was done between clay filters with 20%, 30% and 50% of sawdust, since the other filters (5% and10%) did not produce enough filtrate for analyses. The ANOVA result (Table 7) shows that there is no significant difference in the performance of the filters having 20%, 30% and 50% sawdust with respect to suspended solids (F = 2.38; Fcritical = 5.14) and TC (F = 0.76; Fcritical = 5.14). Where F is the variance ratio and p is the level of significance. However, there was a significant difference between Vol. 35, No. 4, October 2016
954
PERFORMANCE EVALUATION OF CLAY-SAWDUST COMPOSITE FILTER FOR POINT OF USE WATER TREATMENT
the performance of the filters with respect to biochemical oxygen demand (F = 18.71; Fcritical = 5.14). Hence based on performance alone, there is scarcely any justification for increased sawdust in the filters. However, one might have to look to the flow rates for justification of increase in sawdust content. An analysis of variance performed on the flow rates shows that there is a significant difference among the filters with respect to flow rate (F = 9.55; Fcritical = 4.39). Hence, it can be seen that the main justification for inclusion of burnout materials in POU filters is to increase the filtration rate through the media, while at the same time achieving a high level of treatment. It is also suspected that a fraction of the dissolved pollutants are subject to removal by adsorption, though this aspect was not investigated in this research. 4. CONCLUSION The quality of drinking water, especially in developing countries can be enormously improved by the use of clay-sawdust composite filter. Well water, harvested rainwater as well as surface runoff can be converted to potable water by subjecting them to filtration using POU filters. This will go a long way to reduce the burden of water-borne diseases in developing countries and also ensure sustainable water supply. Many people in urban areas of developing countries do not harvest rainwater because of the notion that it is polluted. However, with POU filters, the practice of rainwater harvesting can be boosted. The major challenge posed by the filters is the slow rate of filtration (0.86 litres/day for the 50% sawdust filter). One of these filters can barely serve an average household, under continuous daily operation. Further researches should focus on improving flow rate without impairing the quality of filtrate. 5. REFERENCES [1]
UNICEF/WHO “Diarrhoea: Why Children Are Still Dying and What Can Be Done”, New York: United Nations Children's Fund, (2009).
[2]
Mintz, E. Bartram, J. Lochery, P. and Wegelin, M. “Not Just a Drop in the Bucket: Expanding Access to Point-Of-Use Water Treatment Systems, American Journal of Public Health, 10, pp 1565 – 1570, (2001).
[3]
Clasen, T. Brown, J. Collin, S. Suntura, O. and Cairncross, S “Reducing Diarrhea Through The Use of Household-Based Ceramic Water Filters: A Randomized, Controlled Trial in Rural Bolivia”, Nigerian Journal of Technology
C. C. Nnaji, et al.
American Journal of Tropical Medicine and Hygiene, 70(6), pp 651-657, (2004). [4] Clasen, T F and Bastable, A “Faecal Contamination of Drinking Water during Collection and Household Storage: The Need to Extend Protection to the Point of Use”, Journal of Water and Health, 1(3), pp 109 – 115, (2003). [5]
Colwell, R. Huo, A. Islam, M. S. Aziz, K. M. A. Yunus, M. Khan, N. H. Mahmud, A. Sack, R. B. Nair, G. B. Chakraborty, J. Sack, D. A. Russek-Cohen, E. “Reduction of Cholera in Bangladeshi Villages by Simple Filtration”, Proceedings of the National Academy of Science, 100(3), pp 1051 – 1055, (2003).
[6]
Huo, A. Xu, B. Chowdhury, M. A. Islam, M. S. Montilla, R and Colwell, R R “A Simple Filtration Method to Remove Plankton-Associated Vibrio Cholerae in Raw Water Supplies in Developing Countries, Applied and Environmental Microbiology, 62(7), pp 2508 – 2512, (1996).
[7]
Clasen, T and Boisson, S “Household-Based Ceramic Water Filters for The Treatment of Drinking Water in Disaster Response: An Assessment of A Pilot Programme in The Dominican Republic,Water Practice and Technology, 1(2),pp 1 – 9, (2006).
[8]
Yakub, I., Plappally, A., Leftwich, M., Malatesta, K., Friedman, K., Obwoya, S., Nyongesa, F., Maiga, A., Soboyejo, A., Logothetis, S., and Soboyejo, W. “Porosity, Flow, and Filtration Characteristics of Frustum-Shaped Ceramic Water Filters”, Journal of
Environmental
Engineering,
10.1061/(ASCE)EE.1943-7870.0000669, 986 – 994, (2013). [9]
Erhuanga, E. Kashim, I. B. and Akinbogun, L. “Development of Ceramic Filters for Household Water Treatment in Nigeria”, Art and Design Review, 2(1), pp 6 – 10, (2014).
[10] Cheesman, S L “A Feasibility Study to Assess The Potential for Red Clay Ceramic Water Filters to Be Reproduced by Skilled Artisans and An Evaluation of The Filters' Ability To Remove Protozoa, Bateria, and Virus Pathogens ”Master of Science Thesis, Cranfield University, (2003). [11] Brown, J “Evaluation of Point-of-Use Microfiltration for Drinking Water Treatment in Rural Bolivia”, MPhil dissertation, Department of Geography, University of Cambridge, (2003). [12] Brown, J Sobsey, M and Proum, S “Improving Household Drinking Water Quality: Use of Ceramic Water Filters in Cambodia”, WSP, Cambodia, (2007). [13] Campbell, E “Study of Life Span of Ceramic Filter Colloidal Silver Pot Shaped Model”, Agua Solutions, Managua Nicaragua, (2005).
Vol. 35, No. 4, October 2016
955
PERFORMANCE EVALUATION OF CLAY-SAWDUST COMPOSITE FILTER FOR POINT OF USE WATER TREATMENT [14] Ramos-Tejada, M. Ontiveros, A. Viota, J. and Duran, J “Interfacial and Rheological Properties of Humic Acid/Hematite Suspensions”, Journal of Colloid and Interface Science, 268(1), pp 85 – 95, (2003). [15] Penner, D and Lagaly, G “Influence of Anions on The Rheological Properties of Clay Mineral Dispersion”, Applied Clay Sciences, 19, pp 131 – 142, (2001). [16] Aramide, F. O., Alaneme, K. K., Olubambi, P. A. and Borode, J O “Characterization of Some Clay Deposits in South West Nigeria”, Leonardo Electronic Journal of Practices and Technologies, 25, pp 46 – 57, (2014). [17] Lantagne, D “Investigations of the Potters for Peace Colloidal Silver Impregnated Ceramic Filter”, Report 2: Field Investigations, Alethia Environmental, Allston, MA, USA, (2001). [18] Franz, A “A Performance of Ceramic Candle Filters in Kenya Including Tests for Coliphage Removal”, Civil and Environmental Engineering, Massachusetts Institute of Technology,(2005). [19] Lantagne, D “Investigations of the Potters for Peace Colloidal Silver Impregnated Ceramic Filter”, Report 1: Intrinsic Effectiveness, Alethia Environmental, Allston, M. A, USA, (2001).
Nigerian Journal of Technology
C. C. Nnaji, et al.
[20] Gleick, P H “Basic Water Requirement for Human Activities: Meeting Needs”, Water International, 21(2), pp 83 – 92, (1996). [21] National Academy of Sciences “Drinking Water and Health”, Washington DC: National Academy Press, (1997). [22] Saunders, R J and Warford, J J “The Goal of Improved Health”, Village Water Supply, Economics and Policy in the Developing World, Baltimore: World Bank/John Hopkins University Press, pp 31 – 55, (1976). [23] United States Environmental Protection Agency “National Interim Drinking Water Regulations”, EPA-570/9-76-003, Washington DC, USA, (1976). [24] Vinograd, S P “Medical Aspects of an Orbiting Research Laboratory”, Space Medicine Advisory Group Study, SANA-SP-86, National Aeronautics and Space Administration, Washington DC, USA, (1966). [25] White, G F Bradley, D J and White, A U “Drawers of Water: Domestic Water Use in East Africa”, University of Chicago Press, Chicago, IL, USA, (1976). [26] World Health Organization “International Standards for Drinking Water”, Switzerland: World Health Organization, Geneva, (1971).
Vol. 35, No. 4, October 2016
956