Novel messaging applications, however, pose some serious performance and scalability challenges. In ... formance testing and product comparisons (e.g., [8, 25, 4]), these benchmarks ... Thus, the benchmark provides a flexible and robust tool.
Performance Evaluation of Message-oriented Middleware using the SPECjms2007 Benchmark Published in: Performance Evaluation 66 (2009) 410-434, Elsevier, doi:10.1016/j.peva.2009.01.003 Kai Sachs1 , Samuel Kounev1,2 , Jean Bacon2 , Alejandro Buchmann1 1 Databases and Distributed Systems Group, TU Darmstadt, Germany, 2 Computer Laboratory, University of Cambridge, UK
Abstract Message-oriented middleware (MOM) is at the core of a vast number of financial services and telco applications, and is gaining increasing traction in other industries, such as manufacturing, transportation, health-care and supply chain management. Novel messaging applications, however, pose some serious performance and scalability challenges. In this paper, we present a methodology for performance evaluation of MOM platforms using the SPECjms2007 standard benchmark. SPECjms2007 is based on a novel application in the supply chain management domain designed to stress MOM infrastructures in a manner representative of real-world applications. In addition to providing a standard workload and metrics for MOM performance, the benchmark provides a flexible performance analysis framework that allows users to tailor the workload to their requirements. The contributions of this paper are: i) we present a detailed workload characterization of SPECjms2007 with the goal to help users understand the internal components of the workload and the way they are scaled, ii) we show how the workload can be customized to exercise and evaluate selected aspects of MOM performance, iii) we present a case study of a leading JMS platform, the BEA WebLogic server, conducting an in-depth performance analysis of the platform under a number of different workload and configuration scenarios. The methodology we propose is the first one that uses a standard benchmark providing both a representative workload as well as the ability to customize it to evaluate the features of MOM platforms selectively.
1 Introduction Message-oriented middleware (MOM) is increasingly adopted as an enabling technology for modern event-driven applications like stock trading, event-based supply chain management, air traffic control and online auctions to name just a few. Moreover, the publish-subscribe paradigm is now used as a building block in major new software architectures and technology domains such as Enterprise Service Bus (ESB), Enterprise Application Integration (EAI), Service-Oriented Architecture (SOA) and Event-Driven Architecture (EDA) [6]. Novel messaging applications, however, pose some serious performance and scalability challenges. For example, the next generation of event-driven supply chain management based on RFID technology [11] (for instance SAP’s AutoID infrastructure [3]) will be highly reliant on scalable and efficient backend systems to support the processing of acquired real-time data and its integration with enterprise applications and business processes [31]. Large retailers, like Wal-Mart, Metro or Tesco, are expected to have throughput rates of about 60 billion messages per annum [2]. The performance and scalability of the underlying MOM platforms used to process these messages will be of crucial importance for the successful adoption of such applications in the industry. To guarantee that applications meet their Quality of Service (QoS) requirements, it is essential that the platforms on which they are built are tested using benchmarks to measure and validate their performance and scalability. However, if a benchmark is to be useful and reliable, it must fulfill several fundamental requirements [23]. First of all, it must be designed to stress platforms in a manner representative of real-world messaging applications. It must exercise all critical services provided by platforms and must provide a level playing field for performance comparisons. Finally, to be reliable, a benchmark must generate reproducible results and must not have any inherent scalability limitations. While a number of proprietary benchmarks for MOM servers (e.g., [37, 20, 1, 22]) have been developed and used in the industry for performance testing and product comparisons (e.g., [8, 25, 4]), these benchmarks do not meet the above requirements. The reason is that most of them use artificial workloads that do not reflect any real-world application scenario. Furthermore, they typically concentrate on stressing individual MOM features in isolation and do not provide a comprehensive and representative workload for evaluating the overall MOM server performance. Finally, these benchmarks do not provide enough flexibility allowing users to design their own custom workloads aimed at stressing and evaluating selected aspects of MOM performance. To address these concerns, in September 2005 we launched a project at the Standard Performance Evaluation Corporation (SPEC) with the goal to develop a standard benchmark for evaluating the performance and scalability of MOM products. The new benchmark was called SPECjms2007 and it was developed at SPEC’s OSG-Java Subcommittee with the participation of TU-Darmstadt, IBM, Sun, BEA, Sybase, Apache, Oracle and JBoss. SPECjms2007 exercises messaging products through the JMS (Java Message Service) [39] standard interface which is supported by all major MOM vendors [32]. In this paper, we present a methodology for performance evaluation of MOM platforms using the SPECjms2007 benchmark. SPECjms2007 is based on a novel application in the supply chain management domain that comprises a set of supply chain interactions between a supermarket company, its stores, its distribution centers and its suppliers. We describe these interactions and explain the way they are interrelated. An important advantage of SPECjms2007 is that it allows users to customize the workload to their needs by configuring it to stress selected features of the MOM infrastructure in a way that resembles a given target customer workload. Thus, the benchmark provides a flexible and robust tool that can be used for in-depth performance evaluation of MOM servers. However, in order to exploit this, users need to understand the way the workload is decomposed into components and which performance aspects are exercised by these components. To this end, after discussing the benchmark scenario and its implementation, we present a detailed workload characterization of SPECjms2007 with the goal to help users understand the internal components of the workload and the way they are scaled. We show how the workload can be customized to exercise and evaluate selected aspects of MOM performance. In the second half of the paper, we present a case study of a leading JMS platform, the BEA WebLogic server, conducting an in-depth performance analysis of the platform under a number of different workload and configuration scenarios. We evaluate the server performance for both the point-to-point and publish/subscribe messaging domains studying the effect of individual workload characteristics on the server CPU utilization, the message throughput, the CPU processing time per message/KByte payload, the message delivery latency, etc. The methodology we propose is the first one that uses a standard benchmark providing both a representative workload as well as the ability to customize it to evaluate the features of MOM platforms selectively. The rest of the paper is organized as follows. In Section 3, we introduce the SPECjms2007 benchmark. Following this, in Section 4, we present an in-depth characterization of the SPECjms2007 workload. We show how the workload can be customized to stress selected performance aspects and discuss two standard strategies for scaling the workload. In Section 5, we present our in-depth case study of BEA WebLogic JMS server. In Section 6, we survey related work in the area of MOM performance analysis. Finally, the paper is wrapped up with some concluding remarks in Section 7.
2
Sender
Msg
x Msg y, Msg x
Msg Sender
y Queue 1
Publisher
Msg x
Receiver Publisher
Ms g
y
Topic 1
x , Msg Msg y M sg y , M sg x Ms gy ,M sg x
Subscriber
Subscriber
Subscriber
Queue n
Topic m
JMS Server
JMS Server
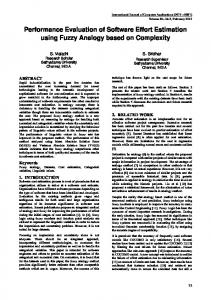
Figure 2.1: Point-to-point messaging.
Figure 2.2: Pub/sub messaging.
2 Background Message-oriented middleware (MOM) is a specific class of middleware that supports loosely coupled communication among distributed software components by means of asynchronous message-passing as opposed to a request/response metaphor. In a nutshell, the idea behind MOM is that a middleman is introduced sitting between communicating parties. The middleman receives messages from one or more message producers and broadcasts those messages to possibly multiple message consumers. This allows a producer to send a message and then continue working while the message is being delivered and processed. The decoupling of communicating parties has several important advantages: i) message producers and consumers do not need to know about each other, ii) they do not need to be active at the same time to exchange information, iii) they are not blocked when sending or receiving messages [10]. The Java Message Service (JMS) [39] is a standard Java-based interface for accessing the facilities of enterprise MOM servers. In the terminology of JMS, a MOM server that supports the JMS API is referred to as JMS provider (or JMS server) and applications that use the JMS provider to exchange messages are referred to as JMS clients. A client that sends a message is called message producer and a client that receives a message is called message consumer. JMS supports two messaging models: point-to-point (P2P) and publish/subscribe (pub/sub). P2P messaging is built around the concept of a message queue which forms a virtual communication channel. Each message is sent to a specific queue and is retrieved and processed by a single consumer. Pub/sub messaging, on the other hand, is build around the concept of a topic. Each message is sent to a specific topic and it may be delivered to multiple consumers interested in the topic. Consumers are required to register by subscribing to the topic before they can start receiving messages. In the pub/sub domain, message producers are referred to as publishers and message consumers as subscribers. JMS queues and topics are commonly referred to as destinations. The two messaging models are depicted in Figures 2.1 and 2.2. The JMS specification defines several modes of message delivery with different QoS attributes: Non-Persistent/Persistent: In non-persistent mode, pending messages are kept in main memory buffers while they are waiting to be delivered and are not logged to stable storage. This provides low messaging overhead at the cost of losing undelivered messages in case of a server crash. In persistent mode, the JMS provider takes extra care to ensure that no messages are lost in case of a server crash. This is achieved by logging messages to persistent storage such as a database or a file system. In case of a server crash, undelivered messages are recovered from stable storage on system restart. In non-persistent mode, each message is guaranteed to be delivered at-most-once, whereas in persistent mode it is guaranteed to be delivered once-and-only-once. Non-Durable/Durable: JMS supports two types of subscriptions, durable and non-durable. Non-durable subscriptions last for the lifetime of their subscriber, i.e., a subscriber will only receive messages that are published while it is active. Messages published while the subscriber is inactive, will be missed by the latter. In contrast to this, durable subscriptions ensure that a subscriber does not miss any messages during periods of inactivity. Non-Transactional/Transactional: A JMS messaging session can be transactional or non-transactional. A transaction is a set of messaging operations that are executed as an atomic unit of work. JMS supports two types of transactions: local and distributed. Local transactions are limited to messaging operations executed on a JMS server. Distributed transactions allow other transactional operations such as database updates to be executed with JMS messaging operations as part of a single atomic transaction.
3
For a more detailed introduction to MOM and JMS the reader is referred to [19, 39].
4
3 The SPECjms2007 Benchmark 3.1 Requirements and Goals The aim of the SPECjms2007 benchmark is to provide a standard workload and metrics for measuring and evaluating the performance and scalability of MOM platforms. To achieve this the SPECjms2007 workload must fulfill several important requirements. First of all, it must be based on a representative workload scenario that reflects the way platform services are exercised in real-life systems. The goal is to allow users to relate the observed behavior to their own applications and environments. Second, the workload should be comprehensive in that it should exercise all platform features typically used in MOM applications including both point-to-point (P2P) and publish/subscribe (pub/sub) messaging. The features and services stressed should be weighted according to their usage in real-life systems. The third requirement is that the workload should be focused on measuring the performance and scalability of the MOM server’s software and hardware components. It should minimize the impact of other components and services that are typically used in the chosen application scenario. For example, if a database would be used to store business data and manage the application state, it could easily become the limiting factor of the benchmark as experience with other benchmarks shows [24]. Finally, the SPECjms2007 workload must not have any inherent scalability limitations. The user should be able to scale the workload both by increasing the number of destinations (queues and topics) as well as the message traffic pushed through a destination. Producing and publishing standard results for marketing purposes will be just one usage scenario for SPECjms2007. Many users will be interested in using the benchmark to tune and optimize their platforms or to analyze the performance of certain specific MOM features. Others could use the benchmark for research purposes in academic environments where, for example, one might be interested in evaluating the performance and scalability of novel methods and techniques for building high-performance MOM servers. All these usage scenarios require that the benchmark framework allows the user to precisely configure the workload and transaction mix to be generated. Providing this configurability is a great challenge because it requires that interactions are designed and implemented in such a way that one could run them in different combinations depending on the desired transaction mix.
3.2 Workload Scenario The workload scenario chosen for SPECjms2007 models the supply chain of a supermarket company. The participants involved are the supermarket company, its stores, its distribution centers and its suppliers. The scenario offers an excellent basis for defining interactions that stress different subsets of the functionality offered by MOM servers. Moreover, it offers a natural way to scale the workload. The participants involved in the scenario can be grouped into the following four roles:
3.2.1 Company Headquarters (HQ) The company’s corporate headquarters are responsible for managing the accounting of the company, managing information about the goods and products offered in the supermarket stores, managing selling prices and monitoring the flow of goods and money in the supply chain.
3.2.2 Distribution Centers (DCs) The distribution centers supply the supermarket stores. Every distribution center is responsible for a set of stores in a given area. The distribution centers in turn are supplied by external suppliers. The distribution centers are involved in the following activities: taking orders from supermarkets, ordering goods from suppliers, delivering goods to supermarkets and providing sales statistics to the HQ (e.g. for data mining).
5
Suppliers
Supermarket Company Company HQ
Suppliers
Company HQ
Supermarkets
1 6 2
1 7 13 6 24 5
3 Distribution Centers
Supermarkets
4
2
4
=goods & info flow =only info
Supermarket Company
5
Figure 3.1: Interaction 1 - Communication between SM and DC
=goods & info flow =only info
Distribution Centers
Figure 3.2: Interaction 2 - Communication between SP and DC
3.2.3 Supermarkets (SMs) The supermarkets sell goods to end customers. The scenario focuses on the management of the inventory of supermarkets including their warehouses. Some supermarkets are smaller than others, so that they do not have enough room for all products, others may be specialized for some product groups like certain types of food. We assume that every supermarket is supplied by exactly one of the distribution centers.
3.2.4 Suppliers (SPs) The suppliers deliver goods to the distribution centers of the supermarket company. Different suppliers are specialized for different sets of products and they deliver goods on demand, i.e. they must receive an order from the supermarket company to send a shipment.
3.3 Modeled Interactions SPECjms2007 implements seven interactions between the participants in the supermarket supply chain. Interaction 1: Order/Shipment Handling between SM and DC This interaction exercises persistent P2P messaging between the SMs and DCs. The interaction is triggered when goods in the warehouse of a SM are depleted and the SM has to order from its DC to refill stock. The following steps are followed as illustrated in Figure 3.1: 1. A SM sends an order to its DC. 2. The DC sends a confirmation to the SM and ships the ordered goods. 3. Goods are registered by RFID readers upon leaving the DC warehouse. 4. The DC sends information about the transaction to the HQ (sales statistics). 5. The shipment arrives at the SM and is registered by RFID readers upon entering the SM warehouse. 6. A confirmation is sent to the DC.
Interaction 2: Order/Shipment Handling between DC and SP This interaction exercises persistent P2P and pub/sub (durable) messaging between the DCs and SPs. The interaction is triggered when goods in a DC are depleted and the DC has to order from a SP to refill stock. The following steps are followed as illustrated in Figure 3.2: 1. A DC sends a call for offers to all SPs that supply the types of goods that need to be ordered.
6
2. SPs that can deliver the goods send offers to the DC. 3. Based on the offers, the DC selects a SP and sends a purchase order to it. 4. The SP sends a confirmation to the DC and an invoice to the HQ. It then ships the ordered goods. 5. The shipment arrives at the DC and is registered by RFID readers upon entering the DC’s warehouse. 6. The DC sends a delivery confirmation to the SP. 7. The DC sends transaction statistics to the HQ.
Interaction 3: Price Updates This interaction exercises persistent, durable pub/sub messaging between the HQ and the SMs. The interaction is triggered when selling prices are changed by the company administration. To communicate this, the company HQ sends messages with pricing information to the SMs. Interaction 4: SM Inventory Management This interaction exercises persistent P2P messaging inside the SMs. The interaction is triggered when goods leave the warehouse of a SM (to refill a shelf). Goods are registered by RFID readers and the local warehouse application is notified so that inventory can be updated. Interaction 5: Sales Statistics Collection This interaction exercises non-persistent P2P messaging between the SMs and the HQ. The interaction is triggered when a SM sends sales statistics to the HQ. HQ can use this data as a basis for data mining in order to study customer behavior and provide useful information to marketing. Interaction 6: New Product Announcements This interaction exercises non-persistent, non-durable pub/sub messaging between the HQ and the SMs. The interaction is triggered when new products are announced by the company administration. To communicate this, the HQ sends messages with product information to the SMs selling the respective product types. Interaction 7: Credit Card Hot Lists This interaction exercises non-persistent, non-durable pub/sub messaging between the HQ and the SMs. The interaction is triggered when the HQ sends credit card hot lists to the SMs (complete list once every hour and incremental updates as required).
3.4 Benchmark Implementation 3.4.1 Event Handlers and Agents SPECjms2007 is implemented as a Java application comprising multiple JVMs and threads distributed across a set of client nodes. For every destination (queue or topic), there is a separate Java class called Event Handler (EH) that encapsulates the application logic executed to process messages sent to that destination. Event handlers register as listeners for the queue/topic and receive call backs from the messaging infrastructure as new messages arrive. For maximal performance and scalability, multiple instances of each event handler executed in separate threads can exist and they can be distributed over multiple physical nodes. Event handlers can be grouped according to the physical location (e.g. HQ, SM, DC or SP) they pertain to in the business scenario. In addition to the event handlers, for every physical location, a set of threads is launched to drive the benchmark interactions that are logically started at that location. These are called driver threads. The set of all event handlers and driver threads pertaining to a given physical location is referred to as agent. For example, each DC agent is comprised of a set of event handlers for the various destinations inside the DC and a set of driver threads used to drive Interaction 2, which is the only interaction with logical starting point at DCs.
3.4.2 Driver Framework The SPECjms2007 scenario includes many locations represented by many event handlers. In order to drive the JMS server to its capacity, event handlers may well be distributed across many physical machines. The reusable control framework
7
designed for SPECjms2007 aims to coordinate these distributed activities without any inherent scalability limitations. Key design decisions were that • It should be written as far as possible in plain Java. Since Java is the natural prerequisite of a JMS application this reduces installation and configuration requirements on end users. • Further to the above, RMI is used as the basis for communication as this is part of the standard J2SE platform. • The controller needs not be on the same machine as any of the performance-critical workloads. • Users should have maximum choice in how they wish to lay out their workload to achieve optimum performance (within the bounds of the SPECjms2007 run rules).
Figure 3.3: Driver Framework Figure 3.3 provides a simplified view of a typical test being run on four nodes. In addition to the event handlers, it is made up of several simple components: Controller The controller component reads in all of the configuration and topological layout preferences given by the user. This will include items such as the number of different types of event handler and lists of the nodes across which they may be run. With this knowledge, the controller instantiates the topology. It begins this by connecting to a satellite process on each node machine identified as part of this test to give it specific instructions. Satellite The satellite is a simple part of the framework which knows to build the correct environment to start child Java processes for SPECjms2007. It takes the controller’s configuration and starts the agent processes relevant to that node. Although each agent is logically discrete from its peers, the satellite will, based upon the initial configuration, combine many agents into a single JVM for reasons of scalability. Agents Each logical agent represents one of the locations in the application scenario. This means that, for example, a distribution center agent will contain a set of DC event handlers pertaining to that location. Agents connect back to the controller who co-ordinates the stages of the test. Once all agents are connected, the event handlers (implemented as a Java thread each) start connecting to the JMS server and the warm-up phase of messaging begins. The controller manages the life cycle of the test by monitoring progress, coordinating phase changes and collecting statistics from the other components. When complete, it validates and combines the statistics into summary output files and presents the final metric for the test.
8
3.4.3 Workload Configurability An important goal of SPECjms2007 that we discussed in Section 3.1 was to provide a flexible framework for performance analysis of MOM servers that allows users to configure and customize the workload according to their requirements. To achieve this goal, the interactions have been implemented in such a way that one could run them in different combinations depending on the desired transaction mix. SPECjms2007 offers three different ways of structuring the workload: horizontal, vertical and freeform. The latter are referred to as workload topologies and they correspond to three different modes of running the benchmark offering different level of configurability. The horizontal topology is meant to exercise the ability of the system to handle increasing number of destinations. To this end, the workload is scaled by increasing the number of physical locations (SMs, DCs, etc.) while keeping the traffic per location constant. The vertical topology, on the other hand, is meant to exercise the ability of the system to handle increasing message traffic through a fixed set of destinations. Therefore, a fixed set of physical locations is used and the workload is scaled by increasing the rate at which interactions are run. Finally, the freeform topology allows the user to use the seven SPECjms2007 interactions as building blocks to design his own workload scenario which can be scaled in an arbitrary manner by increasing the number of physical locations and/or the rates at which interactions are run. In the most general case, the following workload parameters can be configured: • # physical locations (HQs, SMs, DCs, SPs) emulated • Rates at which interactions are run • Message size distribution for each message type • # agents for each physical location • Distribution of agents across client nodes • # JVMs run on each client node • Distribution of agents among JVMs • # event handlers for each message type • # driver threads for each interaction • # JMS Connections shared amongst event handlers • Acknowledgment mode for non-transactional sessions • Optional connection sharing by multiple sessions While in the horizontal and vertical topologies there are some restrictions as to which of the above parameters can be set, no restrictions apply to the freeform topology. Most importantly, the user can selectively turn off interactions or change the rate at which they are run to shape the workload according to his requirements. At the same time, when running the horizontal or vertical topology, the benchmark behaves as if the interactions were interrelated according to their dependencies in the real-life application scenario. For further details on the benchmark implementation, the reader is referred to [33].
9
4 SPECjms2007 Workload Characterization 4.1 Message Traffic Analysis We start with a detailed analysis of the message traffic produced by the benchmark workload in terms of the number and type of messages generated and their sizes. We consider the workload parameters that can be configured in the most general freeform topology and show how they affect the resulting message traffic. The different types of messages and destinations used in the various interactions are detailed in Table 4.1. Intr.
1
Message
Destination
Type
Prop.
Description
order orderConf shipDep
Queue (DC) Queue (SM) Queue (DC)
ObjectMsg ObjectMsg TextMsg
P, T P, T P, T
statInfo-OrderDC shipInfo
Queue (HQ) Queue (SM)
StreamMsg TextMsg
NP, NT P, T
shipConf
Queue (DC)
ObjectMsg
P, T
Order sent from SM to DC. Order confirmation sent from DC to SM. Shipment registered by RFID readers upon leaving DC. Sales statistics sent from DC to HQ. Shipment from DC registered by RFID readers upon arrival at SM. Shipment confirmation sent from SM to DC.
callForOffers offer pOrder pOrderConf
Topic (HQ) Queue (DC) Queue (SP) Queue (DC)
TextMsg TextMsg TextMsg TextMsg
P, T, D P, T P, T P, T
invoice pShipInfo
Queue (HQ) Queue (DC)
TextMsg TextMsg
P, T P, T
pShipConf
Queue (SP)
TextMsg
P, T
statInfo-ShipDC
Queue (HQ)
StreamMsg
NP, NT
Call for offers sent from DC to SPs (XML). Offer sent from SP to DC (XML). Order sent from DC to SP (XML). Order confirmation sent from SP to DC (XML). Order invoice sent from SP to HQ (XML). Shipment from SP registered by RFID readers upon arrival at DC. Shipment confirmation sent from DC to SP (XML). Purchase statistics sent from DC to HQ.
3
priceUpdate
Topic (HQ)
MapMsg
P, T, D
Price update sent from HQ to SMs.
4
inventoryInfo
Queue (SM)
TextMsg
P, T
Item movement registered by RFID readers in the warehouse of SM.
5
statInfoSM
Queue (HQ)
ObjectMsg
NP, NT
Sales statistics sent from SM to HQ.
6
productAnnouncement
Topic (HQ)
StreamMsg
NP, NT, ND
New product announcements sent from HQ to SMs.
7
creditCardHL
Topic (HQ)
StreamMsg
NP, NT, ND
Credit card hotlist sent from HQ to SMs.
2
Table 4.1: Message Types Used in The Interactions - (N)P=(Non-)Persistent; (N)T=(Non-)Transactional; (N)D=(Non-)Durable
4.1.1 Messages Sizes The sizes of the messages generated as part of each interaction can be configured by setting an interaction-specific message sizing parameter (for example, “number of order lines sent to DC" for Interaction 1). Each sizing parameter can be assigned three possible values with respective probabilities (discrete probability distribution). The message sizing parameters used for the different interactions are listed in Table 4.2, along with some data that can be used to compute the resulting message sizes in KBytes. This data is based on measurements we took using a deployment of SPECjms2007 on a major JMS server platform1 . The exact message sizes may be slightly different on different platforms, as MOM servers add their own platform-specific message headers. The measurements provided here were compared against measurements on a second popular JMS server and the differences were negligible. Based on the data in Table 4.2, the message sizes in KBytes for Interactions 1, 2, 4, 6 and 7 can be computed as ϑ = m1 · x + b where x is the interaction’s message sizing parameter and m1 and b are set to their respective values from Table 4.2. The priceUpdate messages of Interaction 3 have constant size that cannot be changed by the user. The size of the statInfoSM messages used in Interaction 5 is configured using two sizing parameters as follows ϑ = x ·(m1 +m2 · y)+ b where x and y are the two sizing parameters (i.e. “number of SM cash desks" and “number of sales lines") and m1 , m2 and b are set to their respective values from Table 4.2. Based on the above two formulas and the data in Table 4.2, the user can configure the benchmark to use message sizes that match the user’s own target workload. 1
Due to product license restrictions, the specific configuration used cannot be disclosed.
10
Intr.
Message Sizing Parameters
Message
m1
m2
b
No of order lines sent to DC
orderConf statInfoOrderDC shipInfo shipDep order shipConf
0.0565 0.0153 0.0787 0.0787 0.0565 0.0202
na na na na na na
1.7374 0.1463 0.8912 0.7222 1.4534 0.7140
2
No of purchase order lines sent to SP
callForOffers offer pOrder pShipConf statInfoShipDC pOrderConf invoice pShipInfo
0.1785 0.2489 0.2498 0.0827 0.0831 0.2410 0.1942 0.0827
na na na na na na na na
0.8094 0.9414 1.1076 0.7612 0.7681 1.3494 1.1211 0.7279
3
Message has fixed size
priceUpdate
na
na
0.2310
4
No of registered items leaving warehouse
inventoryInfo
0.0970
na
0.5137
5
No of cash desks & sales lines
statInfoSM
0.0139
0.3650
0.9813
6
No of new products announced
productAnnouncement
0.0103
na
0.1754
7
No of credit cards in hot list
creditCardHL
0.0166
na
0.1846
1
Table 4.2: Parameters for Message Size Calculation Group Type Properties
a Pub/Sub NP NT ND
b Pub/Sub PTD
c P2P NP NT
d P2P PT
Table 4.3: Message Groups
4.1.2 Message Throughput We now characterize the message throughput first on a per interaction basis and then on a per location basis. The two most important sets of workload parameters that determine the message throughput are the number of locations of each type and the interaction rates. We denote the sets of physical locations as follows: ΨS M = {S M1 , S M2 , . . . , S M|ΨSM | } Ψ DC = {DC1 , DC2 , . . . , DC|ΨDC | } ΨS P = {S P1 , S P2 , . . . , S P|ΨSP | } ΨHQ = {HQ 1 , HQ 2 , . . . , HQ |ΨHQ | } Note that although the modeled scenario has a single physical HQ location, the benchmark allows multiple HQ instances to exist each with its own set of queues. The goal is to avoid the HQ queues becoming a bottleneck when scaling the number of SMs, DCs and SPs. It is assumed that messages sent to the HQ are distributed evenly among the HQ instances. Multiple HQ instances are considered as separate servers within the same physical location. For each interaction, the interaction rate specifies the rate at which the interaction is initiated by every physical instance of its initiating location, SM for Interaction 1, DC for Interaction 2, etc. We denote the interaction rates as λi , 1 ≤ i ≤ 7. Since multiple HQ instances are not considered as separate physical locations, it follows that the rates of Interactions 3, 6 and 7 which are initiated by the HQ are interpreted as rates over all HQ instances as opposed to rates per HQ instance. Interaction 2 uses a set of topics representing the different product families offered by suppliers. These topics help to distribute the callForOffers messages sent by DCs. Suppliers subscribe to all topics corresponding to groups of products they offer so that they receive all relevant callForOffers messages. We denote the set of product families as Π = {P F1 , P F2 , P F3 , . . . , P F|Π| }. The probability that a SP offers products from a given product family P Fi ∈ Π is a configurable workload parameter and will be denoted as ρ . Every SP subscribes to ρ · |Π| product families and thus |ΨSP | · ρ · |Π| subscriptions exist overall. The number of subscribers that subscribe to a given product family is denoted as ζ = |ΨSP | · ρ . In the following, we show how the message throughput, in terms of the number of messages sent and received per unit of time, can be broken down according to the type of messaging (P2P vs. pub/sub) and the message delivery mode (persistent vs. non-persistent, transactional vs. non-transactional, durable vs. non-durable). To this end, we group messages as shown in Table 4.3. Further, we define the following sets: Γ = {a, b, c, d}: Message groups as defined in Table 4.3. Ω = {se, r e}: Messages sent vs. messages received. Λ = {S M , S P, DC, HQ}: Types of physical locations.
4.1.2a). Message Throughput per Interaction We first analyze the message throughput on a per interaction basis. We will use the following notation:
11
j
ξi,k for j ∈ Ω, 1 ≤ i ≤ 7 and k ∈ Γ No of messages of group k sent/received per sec as part of Interaction i . P j j ξi = k∈Γ ξi,k for 1 ≤ i ≤ 7, j ∈ Ω Total no of messages sent/received per sec as part of Interaction i . P7 j ξ j = i=1 ξi for j ∈ Ω Total no of messages sent/received per sec over all interactions.
Based on the information provided in the previous sections and analysis of the benchmark design, the following equations are derived characterizing the message throughput of each interaction: Interaction 1:
ξse 1,c
=
re ξ1,c = λ1 · |ΨSM |
j
=
0, ∀k ∈ {a, b} ∧ j ∈ Ω
ξ1,k
Interaction 2:
Interaction 3:
ξse 1,d
=
re ξ1,d = 5 · λ1 · |ΨSM |
ξ2,a
j
=
0, ∀ j ∈ Ω
ξse 2,c
=
re ξ2,c = λ2 · |Ψ DC |
ξse 2,b
=
λ2 · |Ψ DC |
ξse 2,d
=
re ξ2,d = (ζ + 5) · λ2 · |Ψ DC |
re ξ2,b
=
ζ · λ2 · |Ψ DC | ξ3,k
j
=
0, ∀k ∈ Γ, k 6= b ∧ j ∈ Ω
ξse 3,b
=
λ3
re ξ3,b
=
λ3 · |ΨSM |
Interaction 4:
ξse 4,d
=
re ξ4,d = λ4 · |ΨSM |
ξ4,k
j
=
0, ∀k ∈ Γ, k 6= d ∧ j ∈ Ω
Interaction 5:
ξse 5,d
=
re ξ5,d = λ5 · |ΨSM |
ξ5,k
j
=
0, ∀k ∈ Γ, k 6= d ∧ j ∈ Ω
ξ6,k
j
=
0, ∀k ∈ Γ, k 6= a ∧ j ∈ Ω
j
=
0, ∀k ∈ Γ, k 6= a ∧ j ∈ Ω
Interaction 6:
Interaction 7:
ξse 6,a
=
λ6
re ξ6,a
=
λ6 · |ΨSM |
ξse 7,a
=
λ7
ξ7,k
re ξ7,a
= λ7 · |ΨSM | 4.1.2b). Message Throughput per Location We now analyze the message throughput on a per location basis. The following notation will be used: j
χl,k for j ∈ Ω, l ∈ Λ, k ∈ Γ No of messages of group k sent/received per sec by a location of type l . P j j χl = k∈Γ ξl,k for j ∈ Ω, l ∈ Λ Total no of messages sent/received per sec by a location of type l .
SMs participate in all interactions apart from Interaction 2. The following equations characterize the message throughput of each SM: χSseM ,a e χSr M ,a e χSr M ,b
=
e χSseM ,b = χSr M ,c = 0
se χSM ,c
=
λ5
=
λ6 + λ7
=
2λ1 + λ4
=
λ3
se χSM ,d re χSM ,d
=
2λ1 + λ4
SPs participate only in Interaction 2. Overall λ2 ·|Ψ DC | callForOffers messages are sent by the DCs per sec. Therefore, every SP receives ρ · λ2 · |Ψ DC | messages and for each of them it sends an offer to the respective DC. The probability that an offer is accepted is ζ1 and hence the number of SP offers accepted per sec is given by: ρ · λ2 · |Ψ DC | ζ
=
λ2 · |Ψ DC | |ΨSP |
12
The following equations characterize the message throughput of each SP: χSseP,a
=
re se se re χSP,a = χSP,b = χSP,c = χSP,c =0
e χSr P,b
=
ρ · λ2 · |Ψ DC |
χSseP,d
=
ρ · λ2 · |Ψ DC | +
e χSr P,d
=
3λ2 · |Ψ DC | |ΨSP |
2λ2 · |Ψ DC | |ΨSP |
DCs participate in Interactions 1 and 2 both as producers and consumers of messages. The number of SMs supplied |Ψ | by each DC is given by δ = |ΨSM | . DC The following equations characterize the message throughput of each DC: se χ DC,a
=
re re re χ DC,a = χ DC,b = χ DC,c =0
se χ DC,b
=
λ2
se χ DC,c se χ DC,d re χ DC,d
=
δ · λ1 + λ2
=
3λ1 · δ + 2λ2
=
3λ1 · δ + λ2 (ζ + 2)
The HQ participate in Interactions 1, 2, and 5 as message consumer and in Interactions 3, 6, and 7 as message producer. The following equations characterize the message throughput of the HQ: re χHQ,a
=
re se se χHQ,b = χHQ,c = χHQ,d =0
se χHQ,a
=
λ6 + λ7
se χHQ,b re χHQ,c re χHQ,d
=
λ3
=
λ1 · |ΨSM | + λ2 · |Ψ DC | + λ5 · |ΨSM |
=
λ2 · |Ψ DC |
The detailed message throughput analysis presented above serves two main purposes. First, using the throughput equations, the user can assemble a workload configuration (in terms of number of locations and interaction rates) that stresses specific types of messaging under given scaling conditions. As a very basic example, the user might be interested in evaluating the performance and scalability of non-persistent pub/sub messaging under increasing number of subscribers. In this case, a mix of Interactions 6 and 7 can be used with increasing number of SMs. Second, the characterization of the message traffic on a per location basis can help users to find optimal deployment topology of the agents representing the different locations such that the load is evenly distributed among client nodes and there are no client-side bottlenecks. This is especially important for a messaging benchmark where the server acts as mediator in interactions and significant amount of processing is executed on the client side.
4.2 Horizontal Topology As mentioned earlier, the goal of the horizontal topology is to exercise the ability of the system to handle increasing number of destinations. To achieve this, the workload is scaled by increasing the number of physical locations (SMs, DCs, etc) while keeping the traffic per location constant. A scaling parameter BASE is introduced and the following rules are enforced: 1. |ΨS M | = BASE 5. |Π| = |ΨSM | 2. |Ψ DC | = d
|ΨSM | e 5
3. |ΨS P | = [0.4 · |ΨS M |] |Ψ
|
6. ρ =
5 |Π|
7. λi , 1 ≤ i ≤ 7 are set as shown on Table 4.4
SM 4. |ΨHQ | = d 20 e Figure 4.1 shows how the number of locations of each type is scaled as the BASE parameter is increased. The rates λi at which interactions are initiated by participants are fixed so that the traffic per location (and therefore also per destination) remains constant. The relative weights of the interactions are set based on a detailed business model of the supermarket supply chain which captures the interaction interdependencies. This model has several input parameters (e.g. total number of product types, size of supermarkets, average number of items sold per week) whose values are chosen in such a way that the following overall target messaging mix is achieved as close as possible:
13
No. Locations
Transactional
180 160 140 120 100 80 60 40 20 0
100% 90% 80% 70% 60% 50% 40% 30% 20% 10% 0%
HQ SM SP DC
P2P
5 15 25 35 45 55 65 75 85 95
Base
Pub/Sub
P2P
% Msg.
Figure 4.1: # Locations for Horiz. Topology λ1 1.53920154
Non-Transactional
λ2 2.13333333
Pub/Sub
% Kbytes
Figure 4.2: Horiz. Topology Message Mix
λ3 6.00000000
λ4 3.37837837
λ5 11.54401154
λ6 11.38519924
λ7 9.23076923
Table 4.4: Interaction Rates for the Horizontal Topology
• 50% P2P messages and 50% pub/sub • 50% of P2P messages persistent, 50% non-persistent • 25% of pub/sub messages persistent, 75% non-persistent
9000 8000 7000 6000 5000 4000 3000 2000 1000 0
a b c d
40 80 120 160 200 240 280
Base
Figure 4.3: Horizontal Topology: # msg. sent
Kbytes
No. Msg.
The goal is to put equal weight on P2P and pub/sub messaging. Within each group the target relative weights of persistent vs. non-persistent messaging have been set according to the relative usage of these messaging styles in reallife applications. The criteria for what is a typical MOM application were defined based on input provided by the various participating vendors in the SPECjms working group including IBM, Sun, Oracle, BEA, Sybase and Apache. A comprehensive survey was conducted considering real-life customer applications and analyzing their workloads. Table 4.6(a) shows the resulting message mix in the horizontal topology. Figure 4.2 presents the same data in graphical form. Figures 4.3 and 4.4 show how the number of messages of each type and the bandwidth they use are scaled as a function of the BASE parameter. As evident from the figure, when scaling the workload the proportions of the different types of messages remain constant. This is expected since the relative weights of the various messaging styles used by the workload should not depend on the scaling factor. The sizes of the messages used in the various interactions have been chosen to reflect typical message sizes in real-life MOM applications. Pub/sub messages are generally much smaller than P2P messages due to the decoupled nature of the delivery mechanism. For every type of message, SPECjms2007 generates messages with sizes chosen from a discrete distribution with three possible values as shown in Table 4.5. There are two exceptions, the priceUpdate message used
20000 18000 16000 14000 12000 10000 8000 6000 4000 2000 0
a b c d
40
80 120 160 200 240 280
Base
Figure 4.4: Message traffic in Kbytes
14
Size 1 95 %
Size 2 4%
Size 3 1%
Avg. Size
1
orderConf statInfoOrderDC shipInfo shipDep order shipConf
2.02 0.22 1.28 1.12 1.74 0.81
7.39 1.67 8.76 8.59 7.10 2.73
41.29 10.83 55.95 55.79 41.01 14.83
2.63 0.39 2.13 1.96 2.34 1.03
2
callForOffers offer pOrder pShipConf statInfoShipDC pOrderConf invoice pShipInfo
1.35 1.69 1.86 1.01 1.02 2.07 1.70 0.98
7.06 9.65 9.85 3.65 3.68 9.79 7.92 3.62
36.52 50.71 51.07 17.29 17.38 49.56 39.95 17.26
1.93 2.50 2.67 1.28 1.29 2.86 2.33 1.24
3
priceUpdate
0.24
0.24
0.24
0.24
4
inventoryInfo
1.48
10.22
49.03
2.31
5
statInfoSM
6
productAnnouncement
1.21
0.28
10.51
1.26
7
creditCardHL
1.01
8.49
50.00
1.80
Intr.
Message Probability
5.27
na
Table 4.5: Message Sizes in KByte Transactional
Table 4.6: Topology Message Mix (a) Horizontal Message Group a b c d
Message Count Target Achieved 37.50% 37.46% 12.50% 12.45% 25.00% 24.55% 25.00% 25.55%
Message Group a b c d
Message Count Target Achieved 15.00% 14.19% 5.00% 5.99% 40.00% 39.09% 40.00% 40.74%
Bandwidth Used 24.66% 2.41% 49.19% 23.74%
(b) Vertical Bandwidth Used 7.19% 2.25% 61.03% 29.52%
Non-Transactional
100% 90% 80% 70% 60% 50% 40% 30% 20% 10% 0% P2P
Pub/Sub
% Msg
P2P
Pub/Sub
% Kbytes
Figure 4.5: Vert. Topology Message Mix
in Interaction 4 and the statInfoSM message used in Interaction 5. The former has a fixed size, while the latter has size between 4.7 and 24.78 KB with an average of 5.27 KB. Since statInfoSM messages contain sales statistics, their size is determined by the rate at which items are sold in supermarkets which depends on the number of customers visiting a supermarket per day and the average number of items sold per customer.
4.3 Vertical Topology The goal of the vertical topology is to exercise the ability of the system to handle increasing message traffic through a fixed set of destinations. Therefore, a fixed set of physical locations is used and the workload is scaled by increasing the rate at which interactions are executed. Similar to the horizontal case, a single parameter BASE is used as a scaling factor. The following rules are enforced: 1. |ΨS M | = 10 5. |Π| = 100 2. |Ψ DC | = 2
6. ρ = 50%
3. |ΨS P | = 5
7. λi = ci · BASE, where ci is a fixed factor (see Table 4.7) and 1 ≤ i ≤ 7
4. |ΨHQ | = 2 Again, the relative weights of the interactions are set based on the business model of the supply chain scenario. Unlike the horizontal topology, however, the vertical topology places the emphasis on P2P messaging which accounts for 80% of the total message traffic. The aim is to exercise the ability of the system to handle increasing traffic through a destination by processing messages in parallel. This aspect of MOM server performance is more relevant for P2P messaging (queues)
15
c1 0.076190476
c2 0.106666667
c3 0.050000000
c4 0.162162162
c5 0.577200577
c6 0.142314991
c7 0.102564103
4500 4000 3500 3000 2500 2000 1500 1000 500 0
16000 14000
a b c d
12000
Kbytes
No. Msg.
Table 4.7: Interaction Rate Scaling Factors for the Vertical Topology
a b c d
10000 8000 6000 4000 2000 0
40 80 120 160 200 240 280
Base
Figure 4.6: Vertical Topology: # msg. sent
40 80 120 160 200 240 280
Base
Figure 4.7: Message traffic in Kbytes
than for pub/sub messaging where the message throughput is inherently limited by the speed at which subscribers can process incoming messages. Table 4.6(b) shows the achieved message mix in the vertical topology. Figure 4.5 presents the same data in graphical form. Figures 4.6 and 4.7 show how the number of messages of each type and the bandwidth they use are scaled as a function of the BASE parameter. Again, when scaling the workload the message mix remains constant which is the expected behavior. The sizes of the messages used in the various interactions are computed in the same way as for the horizontal topology (see Table 4.5).
16
5 Case Study In this section, we present a case study with a deployment of SPECjms2007 using the WebLogic Server 10 JMS platform. We present a detailed performance analysis of the platform considering both the P2P and pub/sub messaging domains. Our evaluation is the first one that uses a standard workload to stress the JMS server. We demonstrate how SPECjms2007 can be exploited for in-depth analysis of selected aspects of the MOM server performance.
BEA WebLogic Server 10 2 x Intel Xeon 5335 2.33 GHz Quad-Core, 8 MB Cache 4 SAS RAID 0, 16 GB Windows 2003 Server 64bit
SPECjms2007 Driver Opteron 1216 2.4 GHz Dual Core CPU 4 GB, Debian Linux 2.6.18
1 GBit 1 GBit
SPECjms2007 Driver IBM x3850 Server 4 x Intel Dual-Core Xeon 7150N 3.5GHz, 16 GB, 6 SAS RAID 10 Debian Linux 2.6.18
Figure 5.1: Experimental Environment
5.1 Experimental Setting The experimental environment in which we conducted our case study is depicted in Figure 5.1. WebLogic Server was deployed on a machine with two quad-core Intel Xeon 2.33 GHz CPUs and 16 GB of main memory. The server was run in a 64-bit JRockit 1.5 JVM using 8 GByte of heap space. A RAID 0 disk array comprised of four disk drives was used for maximum performance. The WebLogic JMS Server was configured to keep persistent messages in a file-based store on the disk array and to use a 3.8 GByte message buffer to store message bodies in memory. The SPECjms2007 controller and satellite drivers were distributed across five machines, four one-way dual-core Opteron at 2.4 GHz and one four-way dual-core Intel Xeon at 3.5 GHz. All machines were connected to a 1 Gbit network. To further increase the network capacity, a separate Gbit link was installed between the server and the 4-way driver machine. The latter was configured to always use this link when accessing the server. The satellite drivers were distributed across the machines in such a way that the network traffic was load-balanced between the two networks.
17
5.2 Horizontal and Vertical Scaling We first ran some experiments in the horizontal and vertical topologies in order to show the behavior of the server when scaling the workload in the two alternative ways1 . Figure 5.2 shows the server CPU utilization and the CPU processing time per message (counting both sent and received messages) for the horizontal topology. Figure 5.3 shows the same data for the vertical topology. In both cases, there is a clear linear correlation between the scaling factor (i.e., the BASE) and the server utilization. However, the server utilization grows much faster in the horizontal mode. For a given value of the scaling factor, the CPU consumption of the horizontal topology is between 2.2 and 2.3 times higher than the CPU consumption of the vertical topology. This is expected given that the number of messages injected per second in the horizontal topology is about two times higher than in the vertical topology (see the message traffic analysis in Sections 4.2 and 4.3). It is interesting to compare the average CPU time per message (counting both sent and received messages). The latter is about 10% lower for the horizontal topology. The reasons for this will become clear in the next section.
CPU Time Per Message (ms)
100
CPU Utilization
80 60 40 20 0
0.4 0.35 0.3 0.25 0.2 0.15 0.1 0.05 0
BASE (horizontal)
BASE (horizontal)
Figure 5.2: Measurement Results for Horizontal Experiments
CPU Time Per Message (ms)
100
CPU Utilization
80 60 40 20 0 BASE (Vertical)
0.4 0.35 0.3 0.25 0.2 0.15 0.1 0.05 0 BASE (Vertical)
Figure 5.3: Measurement Results for Vertical Experiments
5.3 Customized Vertical Workloads We now consider two customized workloads based on the vertical topology. The goal is to break down the workload into its P2P and pub/sub components and analyze the server performance when running them in isolation. To this end, the 1
SPECjms2007 is a trademark of the Standard Performance Evaluation Corporation (SPEC). The results or findings in this publication have not been reviewed or accepted by SPEC, therefore no comparison nor performance inference can be made against any published SPEC result. The official web site for SPECjms2007 is located at http://www.spec.org/osg/jms2007.
18
12000 Messages Sent Per Sec
100
CPU Utilization
80 60 40 20
12000 11000 10000 9000 8000 7000 6000 5000 500 550 600 650 700 750 800 850 900 950 BASE (Customized Vertical)
10000 9000 8000 7000 6000 5000 500 550 600 650 700 750 800 850 900 950 BASE (Customized Vertical)
CPU Time Per Message (ms)
Messages Received Per Sec
0 500 550 600 650 700 750 800 850 900 950 BASE (Customized Vertical)
11000
0.4 0.35 0.3 0.25 0.2 0.15 0.1 0.05 0 500 550 600 650 700 750 800 850 900 950 BASE (Customized Vertical)
Figure 5.4: Measurement Results for Customized Vertical Experiments with P2P Messaging
first workload runs only P2P interactions (i.e., 1, 4 and 5), whereas the second one runs only pub/sub interactions (i.e., 3, 6 and 7)2 . In both cases, the relative interaction mix for the considered interactions is the same as for the standard vertical topology. Figures 5.4 and 5.5 show the measurement results. We can see that, as expected, the pub/sub portion of the workload is by far much more light-weight than the P2P portion. This is due to two reasons. On the one hand, for a given value of the BASE, the P2P message traffic injected is much larger than the pub/sub traffic according to the definition of the vertical topology presented in Section 4.3. On the other hand, the server overhead per delivered message is significantly lower in the pub/sub case. Looking at the CPU time per message (counting both sent and received messages) in the two workloads, we can see that for both workloads the latter does not change much as we increase the BASE. For P2P messaging it stabilizes at around 0.28ms, whereas for pub/sub messaging it stabilizes at 0.13ms. From this we can conclude that the overhead per P2P message sent/received in the vertical topology is over two times higher than the overhead per pub/sub message sent/received. This explains why the CPU time per message sent/received in the horizontal topology compared to the vertical topology was measured to be lower in the previous section. This is expected given that the horizontal topology has much less P2P messaging as a proportion of the overall workload than the vertical topology (see Table 4.6).
5.4 Publish/Subscribe Messaging We now study the performance of the server when running only pub/sub messaging. We use the freeform topology and specifically Interactions 3 and 7 to exercise persistent transactional durable (PTD) messaging and non-persistent nontransactional non-durable (NPNTND) messaging, respectively. Table 5.1 shows the configuration for five of the scenarios we analyzed. For each scenario, the emulated number of producers and consumers are shown. Multiple producers and consumers are configured by setting the number of interaction driver threads and the number of emulated SMs, respectively. The producers were run on the 4-way IBM x3850 server, whereas the consumers were distributed among 2
Note that Interaction 2 is not part of these workloads since it contains a mix of both P2P and pub/sub messaging.
19
3000 Messages Sent Per Sec
100
CPU Utilization
80 60 40 20
2500 2000 1500 1000 500
0
0
30000
2000 4000 6000 8000 10000 BASE (Customized Vertical) CPU Time Per Message (ms)
Messages Received Per Sec
2000 4000 6000 8000 10000 BASE (Customized Vertical)
25000 20000 15000 10000 5000 0
0.4 0.35 0.3 0.25 0.2 0.15 0.1 0.05
2000 4000 6000 8000 10000 BASE (Customized Vertical)
0 2000 4000 6000 8000 10000 BASE (Customized Vertical)
Figure 5.5: Measurement Results for Customized Vertical Experiments with Pub/Sub Messaging
the four one-way Opteron-based servers. In both of the considered interactions, each SM acts as a message consumer and therefore the number of consumers is equal to the number of SMs. In all scenarios there is a single HQ instance and a different number of SMs depending on the specified number of consumers. For each scenario, Table 5.1 also shows the message injection rate, the message size and the message type according to the classification in Section 4.1.2 (Table 4.3). Given that in both Interaction 3 and 7, each interaction execution results in sending a single message, the specified message injection rate is configured by setting the respective interaction rate. In the cases where ‘unlimited’ message injection rate is specified, each producer is configured to inject messages at full speed (i.e., with zero delay between successive messages). The results from the experiments are presented in Figures 5.6 to 5.10. Scen. 1 2 3 4 5
Interaction 7 7 7 3 3 and 7
# Prod. 30 30 variable 1 1
# Cons. variable 10 variable variable variable
Msg. Injection Rate 1000 msg/sec 1000 msg/sec unlimited unlimited unlimited
Msg. Size variable variable 0.24 KByte 0.24 KByte 0.24 KByte
Msg. Group a a a b b
Fig. 5.6 5.7 5.8 5.9 5.10
Table 5.1: Configuration for Pub/Sub Scenarios We now take a closer look at the measurement results. We start with NPNTND pub/sub messaging. In the first scenario, we consider the effect of increasing the number of consumers on the server CPU consumption. As expected, the overall CPU utilization and the CPU processing time per message increase linearly with the number of consumers and the rate of increase depends on the message size (Figure 5.6). The larger the message size, the greater the effect the number of consumers has on the overall CPU consumption. The goal of the second scenario is to evaluate the effect of increasing the message size on the CPU consumption per message and KByte of payload sent. The CPU processing time per message is directly proportional to the message size, however, this does not hold for the CPU time per KByte of payload (Figure 5.7). The latter drops exponentially for message sizes up to 10 KByte and stabilizes around 0.2ms for larger messages. This is due to the fact that for every
20
100
CPU Time Per Message Sent (ms)
80 CPU Utilization
10
0.24 KByte 1 KByte 2 KByte
60 40 20 0
0.24 KByte 1 KByte 2 KByte
8 6 4 2 0
10
20
30
40 50 # Consumers
60
70
80
10
20
30
40 50 # Consumers
60
70
80
Figure 5.6: Scenario 1: NPNTND Pub/Sub Messaging with Increasing Number of Consumers
message there is a constant overhead around 0.4ms (independent of the message size) for parsing the JMS message header. For small messages this overhead dominates the overall processing time, however, as the size of the message grows, the overhead becomes negligible compared to the time needed to deliver the message payload. Thus, for messages larger than 20 KByte, we can estimate the message processing time as M sgSize ∗ 0.2ms.
CPU Time Per KByte Payload (ms)
CPU Time Per Message Sent (ms)
2.5 20
15
10
5
0
2 1.5 1 0.5 0
0
10
20
30 40 50 60 70 Message Size (KByte)
80
90 100
0
10
20
30 40 50 60 70 Message Size (KByte)
80
90 100
Figure 5.7: Scenario 2: NPNTND Pub/Sub Messaging with Increasing Message Size In the third scenario, we analyze the effect of varying the number of producers and consumers (Figure 5.8). Each producer is configured to publish messages at full speed. Given that the number of emulated producers (up to 5) does not exceed the number of available CPU cores on the machine hosting the producers, the latter can inject messages in parallel without competing for CPU time on the client side. We consider the server CPU utilization, the throughput in terms of messages sent per second and the CPU processing time per message sent. It is important to note that, in all considered scenarios, the machines hosting the producers and consumers were far from saturated, so that the effect of the client side of the benchmark on the observed system performance was insignificant. From the results we see that increasing the number of message producers and consumers both lead to higher server CPU utilization, however, the number of producers has by far much higher effect on the CPU consumption than the number of consumers. The reason is that whereas the message throughput increases with increasing number of producers, it decreases with increasing number of consumers even if the server is only lightly loaded. The results show that the effect of the decreasing throughput on the CPU consumption cancels out the effect of the increasing number of consumers resulting in stagnation in the server utilization. This is due to synchronization effects. The server has to ensure that successive messages sent by individual producers are delivered in the order in which they are sent. Thus, the more consumers, the higher the synchronization overhead for each producer. Messages sent by different producers, on the other hand, are not affected by this because the server is not required to deliver them in the order in which they were sent. The results also show that the number of producers does not have a significant effect on the average CPU processing time per message. On the other hand,
21
80
60 50 40 30 20
0
50 40 30
10 1
2
3 # Producers
16000
4
5
20
40 60 # Consumers
10000 8000 6000 4000
80
100
1 producer 2 producers 3 producers 4 producers 5 producers
14000 Messages Sent Per Sec
12000
1 16000
1 consumer 25 consumers 50 consumers 75 consumers 100 consumers
14000 Messages Sent Per Sec
60
20
10
12000 10000 8000 6000 4000
2000
2000
0
0 1
2
6
3 # Producers
4
5
4
20
6
1 consumer 25 consumers 50 consumers 75 consumers 100 consumers
5
1
CPU Time Per Msg Sent (ms)
CPU Time Per Msg Sent (ms)
1 producer 2 producers 3 producers 4 producers 5 producers
70 CPU Utilization
70 CPU Utilization
80
1 consumer 25 consumers 50 consumers 75 consumers 100 consumers
3 2 1 0
40 60 # Consumers
80
100
1 producer 2 producers 3 producers 4 producers 5 producers
5 4 3 2 1 0
1
2
3 # Producers
4
5
1
20
40 60 # Consumers
80
100
Figure 5.8: Scenario 3: NPNTND Pub/Sub Messaging with Varying Number of Producers and Consumers
as already shown in the first scenario, the CPU processing time per message is directly proportional to the number of consumers. In the fourth and fifth scenarios, we evaluate the performance of PTD pub/sub messaging. We first look at the effect of increasing the number of consumers on the server CPU consumption, the mean message delivery latency and the number of messages sent/received per second. The results are shown in Figure 5.9. The server CPU utilization goes up to almost 80% for 150 consumers and stabilizes at this level together with the total number of received messages per second for higher number of consumers. Message processing in this case includes disk I/O operations for persisting the messages. The message delivery latency remains below 15ms for up to 150 consumers. There is a good linear correlation between the received messages/sec and the server CPU utilization. Finally, the rate of sending messages drops by almost a factor of 20 as the number of consumers is increased up to the saturation point.
22
16 Mean Delivery Latency (ms)
100
CPU Utilization
80 60 40 20 0
14 12 10 8 6 4 2 0
0
20
40
60 80 100 120 140 160 # Consumers
0
20
40
60 80 100 120 140 160 # Consumers
16000 Received Sent
Messages per Sec
14000 12000 10000 8000 6000 4000 2000 0 0
20
40
60 80 100 120 140 160 # Consumers
Figure 5.9: Scenario 4: PTD Pub/Sub Messaging with Increasing Number of Consumers Scenario 1 2 3
Interaction 5 4 4
# SMs variable variable 5
# HQs variable na na
Injection Rate unlimited unlimited unlimited
Msg. Size 2 KByte 2 KByte variable
Msg. Group c d d
Figure 5.11 5.11 5.12
Table 5.2: Configuration for P2P Scenarios
The fifth scenario compares NPNTND messaging with PTD messaging in terms of the server CPU utilization, the message throughput (number of messages sent per second) and the CPU processing time per message sent. As we increase the number of consumers, the server CPU utilization increases steadily at a decreasing rate. The CPU processing time per message sent increases linearly with the number of consumers and the rate of increase is much higher for PTD messaging than for NPNTND messaging. For 150 consumers, the overhead is over 6 times higher for PTD messaging than for NPNTND messaging. This is explained by the fact that PTD messaging includes additional overhead not just for persisting messages but also for managing transactions which is directly dependent on the number of consumers.
5.5 P2P Messaging We now study the performance of the server when running only P2P messaging. We use the freeform topology and specifically Interactions 5 and 4 to exercise non-persistent non-transactional (NPNT) and persistent transactional (PT) messaging, respectively. Table 5.2 shows the configuration for three scenarios we analyzed. For each scenario, the number of SMs and HQs are shown as well as the message injection rate, the message size and the message type according to the classification in Section 4.1.2 (see Table 4.3). Given that in both Interaction 4 and 5, each interaction execution results in sending a single message, the specified message injection rate is configured by setting the respective interaction rate. The interaction rate is specified on a per location basis. The analysis results for the three scenarios are presented in Figures 5.11 and 5.12.
23
100
4500
CPU Utilization
80
Messages Sent Per Sec
Non-Persistent Persistent
60 40 20 0
Non-Persistent Persistent
4000 3500 3000 2500 2000 1500 1000 500 0
20
40
60 80 100 120 140 160 # Consumers CPU Time Per Msg Sent (ms)
0
0
20
40
60 80 100 120 140 160 # Consumers
70 Non-Persistent Persistent
60 50 40 30 20 10 0 0
20
40
60 80 100 120 140 160 # Consumers
Figure 5.10: Scenario 5: NPNTND vs. PTD Pub/Sub Messaging
We now take a closer look at the results. The first two scenarios compare the performance of NPNT and PT P2P messaging (Figure 5.11). In both scenarios, the number of queues used is varied and the goal is to measure the maximum message traffic per second that can be processed. The first scenario uses Interaction 5 with multiple HQ instances each having its own queue for incoming statInfoSM messages sent by the SMs. In each test, both the number of HQ instances and the number of SMs are set to the desired number of queues. Thus, every SM has a HQ instance and a respective queue that receives its messages. SM agents have 5 producer (driver) threads each. HQ agents have 5 consumer threads each. In order to ensure that the number of producer and consumer threads remains constant, the number of agents per SM/HQ is set in such a way that the number of agents of each type does not change (Section 3.4.2). For example, in the test with 1 queue (1 SM and 1 HQ), there are 20 agents per SM/HQ, in the test with 2 queues, there are 10 agents per SM/HQ and so forth, in all cases leading to 20 agents in total. The second scenario is setup in exactly the same way with exception that it uses Interaction 4 and therefore only SM agents are involved. Each SM agent has 5 producer and 5 consumer threads. The two interactions are configured to use the same message size so that we can compare the results. As we can see in Figure 5.11, when moving from 1 queue to 2 queues, the message throughtput increases by about 5% for NPNT messaging and about 10% for PT messaging. Increasing the number of queues beyond 2, does not affect the message throughput, the server utilization or the CPU time per message/Kbyte. The server CPU utilization is slightly lower (6-10%) for PT messaging. The latter is expected given that persistent messaging involves disk I/O. The message throughput is about 2.5 times higher for NPNT messaging given that the CPU time used per message/KByte processed is over 2 times lower compared to PT messaging. Overall, the results show that using more than two queues does not lead to any noticable change in the system performance of our configuration. In the third scenario, we study the performance of PT P2P messaging with variable message size. We use Interaction 4 with a fixed number of SMs and 5 producer and 5 consumer threads per SM. The results are shown in Figure 5.12. As we can see, the CPU processing time per message increases linerarly with the message size whereas the CPU time per KByte quickly drops and stabilizes around 0.1ms per KByte. As we discussed earlier when evaluating pub/sub messaging, the reason for the drop in the overhead per KByte is that there is a constant overhead for parsing the message header which
24
Exp. 1 Exp. 2
60 40 20 0 0
2
4
6
CPU Time Per Msg (ms)
1 Exp. 1 Exp. 2
0.8 0.6 0.4 0.2 0 0
2
4
6
25000
8 10 12 14 16 18 20 # Queues
Exp. 1 Exp. 2
20000 15000 10000 5000 0
8 10 12 14 16 18 20 # Queues
0 CPU Time Per KByte Payload (ms)
CPU Utilization
80
Message Throughput (Msg/sec)
100
2
4
6
8 10 12 14 16 18 20 # Queues
1 Exp. 1 Exp. 2
0.8 0.6 0.4 0.2 0 0
2
4
6
8 10 12 14 16 18 20 # Queues
Figure 5.11: Scenarios 1 and 2: NPNT vs. PT P2P Messaging with Increasing Number of Queues
for small messages dominates the overall processing time. The mean delivery latency seems to increase quadratically with the message size.
25
100 Disk I/O Per Sec (MByte)
100
CPU Utilization
80 60 40 20
80 60 40 20
0
0 0
5
10 15 Message Size (KByte)
20
25
0
5
10 15 Message Size (KByte)
20
25
10 15 Message Size (KByte)
20
25
10 15 Message Size (KByte)
20
25
Mean Delivery Latency (ms)
Message Throughput (Msg/sec)
30 10000 8000 6000 4000 2000 0
20 15 10 5 0
0
5
10 15 Message Size (KByte)
20
25
0
5
1 CPU Time Per KByte Payload (ms)
2 CPU Time Per Msg (ms)
25
1.5
1
0.5
0
0.8 0.6 0.4 0.2 0
0
5
10 15 Message Size (KByte)
20
25
0
5
Figure 5.12: Scenario 3: PT P2P Messaging with Increasing Message Size
26
6 Related Work Message-oriented middleware is a major part of today’s enterprise systems and its performance and scalability has been gaining increasing attention over the past decade. In the following, we present an overview of the most popular workloads used for benchmarking MOM products and review a selection of performance studies of commercial and open-source messaging platforms that have been published recently. In [41], an evaluation of IBM’s MQSeries V5.2 platform is presented. The authors study the performance of four different styles of messaging: non-persistent non-transactional, persistent non-transactional, persistent local transactional and persistent global transactional. The server’s maximum sustainable throughput is introduced as a metric for characterizing the server performance. The results show the impact of various factors including the message length, the server log buffer space and the number of receiver threads. In [40], the authors evaluate three leading JMS providers, IBM WebSphere MQ/MQIntegrator, TIBCO Rendezvous/MessageBroker V4.0 and Mercator Integration Manager V6.0. A synthetic transactional workload is used and the maximum sustainable throughput for persistent and non-persistent messages is measured. Similarly, in [7] an empirical methodology for evaluating the QoS of JMS products is presented. This time in addition to the maximum sustainable throughput, several further evaluation criteria are considered, the message delivery latency, the elapsed time for batch messaging and the effectiveness of persistent message recovery after a server crash. Two leading JMS servers are evaluated. Unfortunately, the study only considers point-to-point messaging and the authors do not disclose the names of the tested products. Another performance study comparing TIBCO Rendezvous (TIB/RV) against SonicMQ was published in [27]. This study considers both point-to-point and publish/subscribe messaging. For point-to-point messaging, the effects of increasing the number of sender and receiver pairs is analyzed. For publish/subscribe messaging, the effect of increasing the number of publishers and subscribers is analyzed. Furthermore, the authors consider the time taken for a batch of messages to be delivered, the connection time for new subscribers, as well as the server memory and CPU utilization. Some general guidelines for designing a benchmark suite for distributed publish/subscribe systems are presented in [5], however, no specific implementation or measurement results are provided. In [9], the performance of the individual elements used in message broker applications is evaluated highlighting the cost of using each element rather than the cost of running complete applications. In [18], the capacity of the WebsphereMQ JMS server is evaluated in terms of its throughput performance. The message throughput in the presence of filters is studied and it is shown that the message replication grade and the number of installed filters have a significant impact on the server throughput. An analytical model of the message processing time and the server throughput is presented and validated through measurements. Several similar studies using Sun Java System Message Queue, FioranoMQ, ActiveMQ and BEA WebLogic JMS server were published in [17], [14], [15] and [16], respectively. The study in [15] considers complex AND-, OR-. and IN-filters of different length. In [29], the results from the evaluation of the different products are compared and summarized. A more in-depth analysis of the message waiting time for the FioranoMQ JMS server is presented in [28]. The authors study the message waiting time based on an M /G/1 − ∞ approximation and perform a sensitivity analysis with respect to the variability of the message replication grade. The analysis shows that the message waiting time is low as long as the server throughput is sufficiently high. The authors derive formulas for the first two moments of the message waiting time based on different distributions (deterministic, Bernoulli and binomial) of the replication grade. Finally, two simple distributed architectures based on conventional JMS servers that increase the JMS capacity beyond the capacity provided by a single server are proposed. In [26], a simple test harness for testing of JMS providers for correctness and performance is presented. The authors develop a formal model for JMS behavior based on the I/O automata used in other group communication systems. The focus here is on verifying the correctness of JMS implementations and only basic support for performance analysis is provided. In [13], an efficient strategy for reliable messaging using different persistence methods with different kinds of messages is developed. The strategy utilizes daemon threads to reduce its influence on the system and has been implemented as part of a JMS server. In addition to the above, a number of proprietary and open-source benchmarks for messaging platforms have been developed and used in the industry, for example, the SonicMQ Test Harness [37], IBM’s Performance Harness for Java Message Service [20], Apache’s ActiveMQ JMeter Performance Test [1] and JBoss’ Messaging Performance Framework [22]. Using these and other similar benchmarks, numerous comparative performance studies of competitive products have been conducted and published by JMS product vendors over the last 5 years, see for example [8, 25, 36, 34, 4, 12, 30]. As evident from the above, numerous approaches to MOM performance analysis have been developed and used in the industry and academia. However, pretty much all of them are based on artificial workloads that do not reflect any real-
27
world application scenarios. Furthermore, they typically concentrate on exercising individual MOM features in isolation and do not stress the server in a manner representative of real-life applications. Moreover, in most cases performance studies conducted using these workloads have been biased in favor of particular products leading to contradictary claims made by MOM vendors [21, 35, 34, 8, 25, 38]. The workload and benchmarking methodology presented in this paper represent a novel approach to performance evaluation of MOM platform performance. The benchmark we presented has several distinct characteristics that distinguish it from previous benchmarks in this area. It not only provides standard workload and metrics that are comprehensive and representative of real-life applications, but also provides a robust and flexible performance analysis framework making it possible to customize the workload to best match the user application requirements.
28
7 Concluding Remarks We presented a methodology for performance evaluation of MOM platforms using the SPECjms2007 standard benchmark. We first introduced the benchmark discussing its goals, the business scenario it models and its internal component architecture. After this, we presented a detailed workload characterization of SPECjms2007 with the goal to help users understand the internal components of the workload and the way they are scaled. We showed how the workload can be customized to exercise and evaluate selected aspects of MOM performance. Our extensive analysis of the message traffic produced by the benchmark considered the following dimensions, i) message types and destinations, ii) message sizes, iii) message throughput and iv) message delivery modes. We characterized the message traffic both on a per interaction and location basis. The results we presented can be used to define a workload configuration that stresses selected features of the MOM infrastructure in a way that resembles a given target customer workload. Moreover, the traffic equations are essential for finding an optimal deployment topology with a uniform load distribution and no client-side bottlenecks. After considering the general freeform topology, we looked at the more specific horizontal and vertical topologies. We discussed their goals and characterized the interaction and message mixes they are based on and the way they are scaled. Our analysis not only helps to better understand and interpret official benchmark results, but also provides an example of how to define a scalable workload configuration for evaluating selected performance and scalability aspects of MOM. In the second half of the paper, we presented a case study of a leading JMS platform, the BEA WebLogic server, conducting an in-depth performance analysis of the platform under a number of different workload and configuration scenarios. We evaluated the server performance for both the point-to-point and publish/subscribe messaging domains studying the effect of individual workload characteristics on the server CPU utilization, the message throughput, the CPU processing time per message/KByte payload, the message delivery latency, etc. Two groups of scenarios were tested. The first group uses complex workloads based on the standard horizontal and vertical topologies provided by the benchmark. The second group includes scenarios that focus on specific aspects and features of MOM, e.g the overhead of persisting messages, the influence of the message size, the effect of increasing the number of message producers/consumers and the maximum throughput that can be processed through a given number of queues.
29
8 Acknowledgments This work was partially funded by the German Research Foundation (Deutsche Forschungsgemeinschaft) as part of the project “Performance Modeling and Evaluation of Event-based Systems” under grant KO 3445/1-1. We acknowledge the contributions of the members of the SPECjms Working Group to the specification and development of SPECjms2007, in particular Marc Carter, Tim Dunn and Martin Ross from IBM, George Tharakan from Sun Microsystems, Sebastian Frischbier from TU Darmstadt, Evan Ireland from Sybase, Tom Barnes and Russell Raymundo from BEA, and Adrian Co from Apache. We are also thankful to Lawrence Cullen, Alan Adamson and John Stecher from IBM and Steve Realmuto from BEA for their continued support of the SPECjms project.
30
Bibliography [1] ActiveMQ. JMeter Performance Test. http://activemq.apache.org/jmeter-performance-tests.html, 2006. [2] K. Alexander, T. Gillian, K. Gramling, M. Kindy, D. Moogimane, M. Schultz, and M. Woods. IBM Business Consulting Services - Focus on the Supply Chain: Applying Auto-ID within the Distribution Center. White paper IBM-AUTOIDBC-002, 2003. [3] C. Bornhövd, T. Lin, S. Haller, and J. Schaper. Integrating Automatic Data Acquisition with Business Processes Experiences with SAP’s Auto-ID Infrastructure. In Proceedings of VLDB’04, 2004. [4] M. Carter. JMS Performance with WebSphere MQ for 1.ibm.com/support/docview.wss?rs=171& uid=swg24010028, 2005.
Windows
V6.0.
http://www-
[5] A. Carzaniga and A. L. Wolf. A Benchmark Suite for Distributed Publish/Subscribe Systems. Technical report, Department of Computer Science, University of Colorado, 2002. [6] D. Chappell. Enterprise Service Bus. O’Reilly, 2004. ISBN: 059600675. [7] S. Chen and P. Greenfield. QoS Evaluation of JMS: An Empirical Approach. In HICSS ’04: Proceedings of the Proceedings of the 37th Annual Hawaii International Conference on System Sciences (HICSS’04) - Track 9, Washington, DC, USA, 2004. IEEE Computer Society. [8] Crimson Consulting Group. High-Performance JMS Messaging mark Comparison of Sun Java System Message Queue and IBM http://www.sun.com/software/products/message_queue/wp_JMSperformance.pdf, 2003.
A BenchWebSphere MQ.
[9] T. Dunn and R. Branagan. Websphere MQ Integrator for Windows NT and Windows 2000 V2.1. Performance Report. IBM U.K. Hursley Park Laboratories, 2002. [10] P. T. Eugster, P. A. Felber, R. Guerraoui, and A.-M. Kermarrec. The Many Faces of Publish/Subscribe. ACM Computing Surveys, 35(2):114–131, June 2003. [11] K. Finkenzeller. RFID Handbook : Fundamentals and Applications in Contactless Smart Cards and Identification. John Wiley & Sons, 2nd edition, may 2003. [12] Fiorano Software Inc. JMS Performance Benchmarks Illustrating 2007 Performance Advantage against SonicMQ 7.0, Tibco EMS 4.4 and http://fiorano.best.vwh.net/whitepapers/jms_performance_comparison.htm, 2007.
the FioranoMQ ActiveMQ 4.1.0.
[13] X. Guo, X. Ding, H. Zhong, and J. Li. A new performance optimization strategy for java message service system. In Proceedings of the Eighth International Conference on Enterprise Information Systems: Databases and Information Systems Integration (ICEIS 2006), Paphos, Cyprus, May 23-27, 2006, pages 520–523, 2006. [14] R. Henjes, M. Menth, and S. Gehrsitz. Throughput Performance of Java Messaging Services Using FioranoMQ. In 13th GI/ITG Conference on Measuring, Modelling and Evaluation of Computer and Communication Systems (MMB), Nürnberg, Germany, March 2006. [15] R. Henjes, M. Menth, and V. Himmler. Impact of Complex Filters on the Message Throughput of the ActiveMQ JMS Server. pages 192–203. 2007. [16] R. Henjes, M. Menth, and V. Himmler. Throughput Performance of the BEA WebLogic JMS Server. International Transactions on Systems Science and Applications, Volume 3, Number 3, October 2007. [17] R. Henjes, M. Menth, and C. Zepfel. Throughput performance of java messaging services using sun java system message queue. In Proceedings 20th European Conference on Modelling and Simulation, pages 684–691, Bonn, Germany, May 2006.
31
[18] R. Henjes, M. Menth, and C. Zepfel. Throughput Performance of Java Messaging Services Using WebsphereMQ. In ICDCSW ’06: Proceedings of the 26th IEEE International ConferenceWorkshops on Distributed Computing Systems, Washington, DC, USA, 2006. IEEE Computer Society. [19] G. Hohpe and B. Woolf. Enterprise Integration Patterns: Designing, Building, and Deploying Messaging Solutions. Addison-Wesley Professional, ISBN-10: 0321200683, ISBN-13: 978-0321200686, October 2003. [20] IBM Hursley. Performance Harness for Java Message Service. http://www.alphaworks.ibm.com/tech/perfharness, 2005. [21] Java News Desk. FioranoMQ 7.5 Offers Largest JMS Performance Gains Ever, Notes CEO Atul Saini. SYS-CON Media, http://java.sys-con.com/read/46130.htm, 2004.
[22] JBoss. JBoss JMS Messaging Performance Framework. http://wiki.jboss.org/wiki/Wiki.jsp?page=JBossJMSNewPerformanceB 2006. [23] S. Kounev. Performance Engineering of Distributed Component-Based Systems - Benchmarking, Modeling and Performance Prediction. Shaker Verlag, Dec. 2005. ISBN: 3832247130. [24] S. Kounev and A. Buchmann. Improving Data Access of J2EE Applications by Exploiting Asynchronous Processing and Caching Services. In Proceedings of VLDB’02, 2002. [25] Krissoft Solutions. JMS Performance Comparison. http://hosteddocs.ittoolbox.com/krissoft102904.pdf, 2004. [26] D. Kuo and D. Palmer. Automated Analysis of Java Message Service Providers. In Middleware ’01: Proceedings of the IFIP/ACM International Conference on Distributed Systems Platforms Heidelberg, pages 1–14, London, UK, 2001. Springer-Verlag. [27] P. Maheshwari and M. Pang. Benchmarking message-oriented middleware: TIB/RV versus SonicMQ. Concurrency and Computation: Practice and Experience, 17(12):1507–1526, October 2005. [28] M. Menth and R. Henjes. Analysis of the Message Waiting Time for the FioranoMQ JMS Server. In ICDCS ’06: Proceedings of the 26th IEEE International Conference on Distributed Computing Systems, Washington, DC, USA, 2006. IEEE Computer Society. [29] M. Menth, R. Henjes, C. Zepfel, and S. Gehrsitz. Throughput performance of popular JMS servers. SIGMETRICS Perform. Eval. Rev., 34(1):367–368, June 2006. [30] A. Rindos, M. Loeb, and S. Woolet. A performance comparison of IBM MQseries 5.2 and Microsoft Message Queue 2.0 on Windows 2000. IBM SWG Competitive Technical Assessment, Research Triangle Park, NC, 2001. [31] K. Sachs. Evaluation of Performance Aspects of the SAP Auto-ID Infrastructure. Master’s thesis, Department of Computer Science, TU Darmstadt, 2004. [32] K. Sachs and S. Kounev. Kaffeekunde -SPECjms2007 misst message oriented middleware. iX - Magazin für professionelle Informationstechnik, (2), Feb. 2008. [33] K. Sachs, S. Kounev, M. Carter, and A. Buchmann. Designing a Workload Scenario for Benchmarking MessageOriented Middleware. In Proceedings of the 2007 SPEC Benchmark Workshop. SPEC, January 2007. [34] Sonic Software Corporation. JMS Performance Comparison: SonicMQ(R) vs TIBCO Enterprise(TM) for JMS. White Paper, Nov. 2003. [35] Sonic Software Corporation. SonicMQ(R) 5.0.2 Outperforms TIBCO Enterprise(TM) for JMS 3.1.0 in Nine Key Publish/Subscribe Benchmark Tests. PR Newswire, http://goliath.ecnext.com/coms2/summary_0199-3273161_ITM, 2003. [36] Sonic Software Corporation. Benchmarking E-Business Messaging Providers. White Paper, Jan. 2004. [37] Sonic Software Corporation. SonicMQ Test Harness, 2005. [38] Sun Microsystems. Sun and Sonic Software Demonstrate Outstanding Performance Running SonicMQ on Sun’s Solaris 10 OS for x86 Platform. http://www.sun.com/smi/Press/sunflash/2004-11/sunflash.20041122.1.xml, 2004.
32
[39] Sun Microsystems, Inc. Java Message Service (JMS) Specification - Version 1.1. Technical report, 2002. [40] P. Tran, J. Gosper, and I. Gorton. Evaluating the sustained performance of COTS-based messaging systems. Software Testing, Verification and Reliability, 13(4):229–240, 2003. [41] P. Tran, P. Greenfield, and I. Gorton. Behavior and Performance of Message-Oriented Middleware Systems. In ICDCSW ’02: Proceedings of the 22nd International Conference on Distributed Computing Systems, pages 645–654, Washington, DC, USA, 2002. IEEE Computer Society.
33