1
Performance Evaluation of Peak-to-Average Power Ratio Reduction and Digital Pre-distortion for OFDM Based Systems Charles Nader, Student Member, IEEE, Per Niklas Landin, Student Member, IEEE, Wendy Van Moer, Senior Member, IEEE, Niclas Björsell, Member, IEEE, Peter Händel, Senior Member, IEEE,
Abstract—In this paper, we evaluate the effect of applying peak-to-average power ratio (PAPR) reduction and digital pre-distortion (DPD) on two types of radio frequency power amplifiers when an orthogonal frequency division multiplexing (OFDM) signal is used. The power amplifiers under test are a standard class-AB amplifier and a Doherty amplifier. The PAPR reduction methods are based on a state-of-the art convex optimization formulation and on the standard clipping and filtering technique. The DPD method consists of modeling the behavior of the power amplifier using a parallel Hammerstein model, and then extracting the inverse parameters based on the indirect learning architecture. To achieve better DPD performance, extracting the DPD parameters based on multiple-step iterations is investigated. The cases where PAPR reduction and DPD are applied separately and combined are studied and investigated. Power amplifier figures of merit are evaluated. Good performance is shown when combining both pre-processing techniques up to a certain operating point where DPD performance deteriorates due to generation of strong peaks in the signal. In addition, a difference in the power amplifier behavior is reported and analyzed. Index Terms—OFDM, power amplifiers, peak-to-average power reduction, clipping and filtering, digital pre-distortion, Doherty power amplifiers.
I. I NTRODUCTION RTHOGONAL frequency division multiplexing (OFDM) is widely used in today’s wireless systems ranging from wireless local area network (WLAN), worldwide interoperability for microwave access (WiMAX), to the long term evolution (LTE) system, and digital video broadcasting (DVB-T, DVB-T2). Its high bandwidth efficiency and robustness against frequency fading is highly attractive for such wireless systems requiring high data throughput and high reliability. However, applying such modulated signals to a radio frequency (RF) transmitter presents a major challenge because these signals are characterized by high peak-to-average power ratio (PAPR). Hence, the RF base station power amplifier (PA) needs to operate at lower power levels compared to its saturation point in order to
O
This paper is an expanded paper from the IEEE International Microwave Symposium held on June 5-10, 2011 in Baltimore, MD. C. Nader, P.N. Landin, N. Björsell and P. Händel are with the University of Gävle, Center for RF Measurement Technology, Gävle, SE-80176, Sweden. C. Nader, P.N. Landin and P. Händel are with the ACCESS Linnaeus Centre, KTH Royal Institute of Technology, Stockholm, SE-10044, Sweden. C. Nader, P.N. Landin and W. Van Moer are with the ELEC Department, Vrije Universiteit Brussel, B-1050, Belgium. Corresponding author:
[email protected].
avoid compression and hence clipping of the signal peaks, which generates in-band and out-of-band distortion. However, backing-off the PA operating power by a number of dB’s proportional to the signal PAPR reduces the efficiency of the amplifier as a large amount of supplied power is dissipated as heat. Hence, a trade-off exists between nonlinearity and efficiency [1]. RF system designers strive to overcome such trade-off by digitally correcting for its causes. Some of them target to reduce the nonlinearity effect by digitally pre-distorting (DPD) the signals [2], [3]; while others aim to reduce the PAPR, i.e. the required back-off margin [4]–[7]. In general, PAPR reduction and DPD are investigated separately. Only a few researchers have experimentally studied their overall impact on the PA power performance when combined, e.g. [8], [9]. Hence, there is high interest in evaluating such combined application, certainly with the increasing interest in ”highly-linear and highly-efficient” amplification transmitters, e.g. Doherty PAs [1]. Recently, the authors in [9] have presented an experimental evaluation on the use of PAPR reduction based on convex optimization and DPD for improving the performance of a class-AB PA when excited with an OFDM WLAN type of signal. The results in [9] showed attractive improvements in efficiency and linearity when both digital pre-processing techniques are combined. In addition, investigation of the DPD performance at strong compression is presented, and suggestions for performance improvements are given. This paper extends the work in [9] by combining DPD with the traditional clipping and filtering (CAF) PAPR reduction technique, which is known for its simple implementation. In addition, [9] showed that at strong compression, DPD compensates the compression by a strong expansion, hence generating high peaks in the signal. Such high peaks heat the power transistor and push it more into compression, stress the bias network, and introduce additional memory effects, in a manner that DPD fails to correct. A way to improve the DPD performance in such situations is to extract its parameters iteratively, as shown here. Finally, this work will evaluate the performance of the signal shaping techniques discussed above on a Doherty PA. The Doherty technique is presented as an amplification method that offers an increase in the achieved output power, hence in the efficiency, at the cost of linearity [1]. Hence, investigating the combination of the above mentioned digital pre-processing
2
techniques on its linear behavior and useful efficiency is of high interest. The PAPR reduction techniques adopted are based on [6], [7], and clipping and filtering, which are described in Section II. The structure of the DPD with memory, along with its parameter identification, for both one-step extraction and multiple-step iterative extraction, are presented in Section III. The excitation signal, devices under test, and measurement setups are presented in Section IV. Power amplifier performance is evaluated in Section V for cases where PAPR reduction and DPD are applied separately and combined, for a standard base station class-AB PA and a Doherty PA. Discussions are given in Section VI, and conclusions are drawn in Section VII. II. PAPR
REDUCTION
A. PAPR Reduction as a Convex Problem In this section, OFDM PAPR reduction using convex optimization, as formulated in [6] and [7], is briefly reviewed. The optimization method is a state-of-art method in shaping signals that reduces the time domain peaks by redistributing the constellation symbols while satisfying constraints on inband errors and out-of-band emissions. Such PAPR reduction techniques are advantageous compared to other methods, e.g. CAF or coding, due to their low out-of-band emission and data rate reduction when applied to high modulation order, e.g. 128-QAM. A WLAN OFDM signal with spectrum formed by 48 data, 4 pilot, and 12 power-free sub-carriers is used [10]. The data/pilot sub-carriers are modulated with 16-QAM, and 128 symbols are considered. Consider c0 = (c0,1 , . . . , c0,n )T a complex-valued vector of length n to be the ideal frequency constellation. During the minimization process, c0 will be modified by a factor δ ∈ Cn such that c = c0 + δ, with c = (c1 , . . . , cn )T . Hence, the average error vector magnitude (EVM) is defined as v u id u1 ∑ u √ |ci − c0,i |2 ud t i=i1 ||S (c − c0 )||2 EVM = = (1) P0 dP0 where S is a diagonal carrier selection matrix with diagonal elements Si,i = 1 for those d carriers i1 , . . . , id that contain data/pilot, and zero otherwise. ||·|| denotes the Euclidian vector norm. Note that c and c0 are scaled to the same average power for evaluation. The scalar P0 is the average power of the modulation scheme used [10]. The time domain signal, x of length nℓ, is generated by applying an ℓ-times oversampled inverse fast Fourier transform IFFTℓ [·] on the constellation c. The PAPR is defined as the ratio of the highest signal peak power to its average power value, nℓ maxj (|xj |2 ) . (2) PAPR = ||x||2 Minimizing PAPR is equivalent to minimizing the peak-power p = maxj (|xj |2 ) where |xj |2 ≤ p holds for all j = 1, ..., nℓ. The convex minimization of PAPR is obtained by distorting the data/pilot sub-carriers Sc and by adding power to a portion of
the free sub-carriers as a relaxation for the optimization procedure. The introduced distortion of the transmitted constellation is bounded by a constraint imposed on the EVM; hence EVM ≤ EVMmax . The minimization problem is resumed to minimize peak power subject to
p = max(|xj |2 ) j
||S (c − c0 )|| ≤ ϵ
(3)
2 ℜ⟨cH 0 S (c − c0 )⟩ ≥ −ϵ /2 ||(I − S)c|| ≤ ρ||Sc0 ||
where ϵ is a real-valued positive parameter √ proportional to EVMmax and is given by ϵ = EVMmax d P0 ; ℜ⟨·⟩ is the real part operator of a complex number. The first constraint in (3) is derived from (1) and bounds the in-band error. The second constraint is a relaxed convex constraint on the average transmitted data power ||S c||2 , that is derived from the nonconvex constraint c: ||S c||2 ≥ ||S c0 ||2 . The third constraint is an overhead power constraint that limits the wasted energy transmitted in the free sub-carriers [6]. The convex minimization problem is solved based on a fast logarithmic-barrier-IPM algorithm which finds the global optimum solution (p∗ , c∗ , x∗ ) that solves the PAPR minimization problem. The reader is referred to [6], [11] for details on the solver.
B. Clipping and Filtering The CAF method is based on distorting the time-domain waveform by introducing an amplitude limiting function through a hard limiter [12]. The hard limiter is defined by [12] { xj if |xj | ≤ A x ¯j = Aej∠xj if |xj | > A with xj being the time domain original OFDM signal at sample j as defined in Section II-A, j = 1, ..., nℓ, A is the clipping amplitude threshold, and ∠xj is the angle of xj . The nonlinear operation of the limiter introduces both inband and out-of-band distortion. The out-of-band distortion is ¯ . A consequence of filtering reduced by filtering the signal x the signal is a partial regeneration of the peaks [12] and a possible deterioration in the in-band information. Hence, the filter type and parameters need to be chosen based on the system requirements. The clipping threshold is specified using the clipping ratio CR [13], [14] √ nlA . (4) CR = ||x|| The approach used in this paper is to reduce the PAPR as much as possible by CAF while keeping the in-band and outof-band distortion below standard limits. For the used WLAN signal, this means a CR of 3.5 dB, resulting in a reduction of the PAPR from 10.8 dB to 4.1 dB. After filtering the signal, using a raised-cosine filter with order 20, 2.4 dB of the peaks are regenerated, resulting in a PAPR of 6.5 dB.
3
III. D IGITAL PRE - DISTORTION
IV. E XPERIMENTAL S ETUP
A. One-Step DPD Digital pre-distortion is a technique used to improve the overall linearity of the PA when operated under weak compression. By weak compression, we refer to the operating power region of a PA where the excitation signal peaks start to clip. DPD works on reshaping the excitation signal by injecting a distortion extracted from an inverse model of the PA nonlinearity. As a consequence, the output signal from the PA is ideally linearly proportional to the input signal before the pre-distorter. Hence, linearity figures-of-merit, such as adjacent channel power ratio (ACPR) are improved in the PA operating region where the DPD parameters were extracted. Several methods are presented in the literature regarding the extraction of the PA nonlinearity inverse model, e.g. AM/AM and AM/PM characteristics [15] or behavioral models with memory [2], [3]. In this paper, DPD is based on the well-known parallel Hammerstein model. The model structure has shown to give satisfactory performance when used for both direct modeling, i.e. description of the input-output relation of RF PAs, and for inverse modeling, i.e. as a DPD structure [2], [3], [16], [17]. The structure of the parallel Hammerstein model is given by the nonlinear order P and the memory depth M . Such a model is denoted PH(P,M) and can be expressed as y(n) =
P ∑ M ∑
h2p−1 u(n − m)|u(n − m)|2(p−1) , m
(5)
p=1 m=0
where u(n) is the low-pass equivalent input signal at sample n, y(n) the low-pass equivalent model output at sample n, and h2p−1 the parameters of the model. The inverse model m are identified using the indirect learning parameters h2p−1 m architecture (ILA) in [18], [19]. B. Multiple-Step Iterative DPD The signal expansion at the output of the one-step ILA DPD results in heating the power transistor, pushing it further into compression and stressing the bias network, which introduces undesirable memory effects. Due to these unmodeled effects, the DPD performance deteriorates. To overcome such effects and achieve additional performance improvements, a multiplestep iterative method is used. The first step is the normal onestep ILA, resulting in the pre-distorted input signal uDPD1 and the output signal yDPD1 . In the second step, the parameters of the pre-distorter are instead extracted using uDPD1 and yDPD1 . The parameters from this second step are then used in the pre-distortion model identification to create the second step pre-distortion signal uDPD2 and subsequently the measured output signal yDPD2 . This is continued until the pre-distorter results show no further improvements. In this paper, two steps were found to be sufficient for achieving the maximum improvement, as applying more steps led only to negligible improvements. The required number of steps depends mainly on the device under test and the bias network.
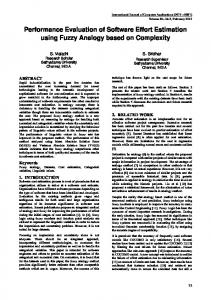
A 20-MHz OFDM signal with 64 subcarriers using 16QAM modulation and consisting of 128 symbols is used. The original excitation signal has a PAPR of 10.8 dB, an effective bandwidth of 16 MHz, and an ACPR of −45 dB. The optimized excitation signal has a PAPR of 6.4 dB, an effective bandwidth of 18 MHz, an EVM of −19.6 dB and an ACPR of −42.5 dB. The slight increase in ACPR compared to the original signal is due to the increase in the effective bandwidth of the signal which affects the spectrum tails caused by the time-window used in generating the OFDM signal. The clipped and filtered excitation signal has a PAPR of 6.5 dB, an EVM of −20.5 dB, and an ACPR of −42.9 dB. The increase in ACPR compared to the original signal is due to the low filter order used, which gives the ultimate PAPR reduction while keeping EVM below the 19 dB standard limits for the modulation type that is used. Two PAs are used in the evaluation process. The first amplifier is a single-transistor class-AB LDMOS from Infineon Technologies based on a revised version of the PTF20451E amplifier module. It is optimized for operation in the 2-GHz band with a linear gain of 16 dB and maximum continuous wave output power of 48 dBm. The second amplifier under test is a Doherty design from Freescale Semiconductor based on the MRF6P21190H LDMOS transistor, that is optimized for operation in the 2.1-2.2 GHz frequency band. It has a 15 dB overall gain and a maximum continuous wave output power of 52 dBm. The Doherty amplifier is based on two power transistors working in parallel. The first one is biased for a class-AB mode of operation, while the second one, named ”peaking amplifier”, is class-C biased and its operational purpose is to backup the class-AB transistor at high operation power levels, which results in higher total output power and efficiency. The output signals from the PA when operated in compression, have bandwidths on the order of 100 MHz. For measuring such bandwidths, a system consisting of a wideband downconverter and a high performance analog-to-digital converter with 14 bits resolution and a sampling rate of 400 MHz is used. The vector signal generator is a R&S SMU200A combined with a R&S AFQ100A IQ-source. The driver power amplifier is designed by Ericsson for research purpose. The measurement setup is shown in Fig. 1. Coherent averaging is used to reduce the noise levels [16]. The input and output signals are synchronized using time-domain cross-correlation followed by frequency-domain phase shift [16]. V. M EASUREMENTS AND EVALUATIONS In this section, an evaluation of the effect of applying PAPR reduction and DPD on the amplifier performance is presented. The input power of the PAs under test was swept to cover the region between weak compression, where DPD is usually applied, and strong compression. The DPD parameters were extracted for every 0.5 dB power step. The discussions focus on cases where the digital pre-processing techniques are applied separately and combined. It should be mentioned that
4
Wide-band down-converter −26
Filter Amplifier Equalizer
RF AWG
SG
DPA
PA
−28
IF ADC
−30
LO
DPD PAPR Reduction
ACPR (dB)
−32
Digital Processing Unit Signal Generation
Fig. 1.
−34
original reduced clipped pre−distorted1 pre−distorted2 reduced+pre−distorted1 reduced+pre−distorted2 clipped+pre−distorted1 clipped+pre−distorted2
1dB
−36 −38 −40 −42
Test-setup for measuring wide-band spectra.
−44 −46
A. Class-AB Power Amplifier 1) Adjacent channel power ratio: The major advantage of using DPD is to reduce the outof-band distortion generated by the PA, and hence to allow operation of the PA at higher input power levels. A standard figure-of-merit representing such distortion is the adjacent channel power ratio (ACPR) which represents the ratio between the average power leaking to the adjacent channel and the average power in the main channel. In this work, ACPR is evaluated with respect to the worst, left or right, adjacent leakage, where the adjacent channel is situated at shoulder-toshoulder distance from the main channel and with a bandwidth of 20 MHz. Fig. 2 shows the ACPR at the output of the PA as a function of the output power. It can be noticed that both PAPR reduction techniques give similar performance with a slight improvement for the PAPR reduction based on convex optimization. Such slight improvement is expected to be more pronounced when a higher order modulation technique is used, due to the tight constraint on EVM, which affects the clippingand-filtering overall performance. From Fig. 2 it is obvious that applying DPD will reduce the ACPR up to a certain operating power level where the DPD performance deteriorates sharply. It is also noticed, that applying PAPR reduction before DPD achieves higher output power, with a power increase approximately equal to the PAPR reduction value, while keeping low ACPR. However, such combination of pre-processing techniques leads to a steeper
35
Fig. 2.
36
37
38
39 40 41 Output power (dBm)
42
43
44
45
Class-AB: Adjacent channel power ratio evaluation.
−15
−20
−25 1dB EVM (dB)
the effects of the driver PA are also considered in the DPD, which pre-distorts the complete amplification chain. In the plots, “original” refers to the original signal, “reduced” refers to the PAPR reduced signal by convex optimization, “clipped” refers to the PAPR reduced signal by CAF, “pre-distorted1” refers to the signal when DPD is extracted based on one-step iteration, “pre-distorted2” refers to the signal when DPD is extracted based on two-step iterations, “reduced+pre-distorted1” and “reduced+pre-distorted2” refer to the reduced signal based on convex optimization when DPD is extracted based on one-step and two-step iteration respectively, and finally “clipped+pre-distorted1” and “clipped+predistorted2” refers to the clipped signal when DPD is extracted based on one-step and two-step iteration respectively. In addition, the output power level relative to the 1-dB compression point of the amplifier when excited with a continuous wave is noted in the figures by a “1dB” down arrow.
−30 original reduced clipped pre−distorted1 pre−distorted2 reduced+pre−distorted1 reduced+pre−distorted2 clipped+pre−distorted1 clipped+pre−distorted2
−35
−40
−45
−50 35
36
37
38
39 40 41 Output power (dBm)
42
43
44
45
Fig. 3. Class-AB: Error vector magnitude evaluation at the output of the power amplifier.
deterioration of the DPD performance when compared to using DPD alone, due to the fact that signals with reduced PAPR have a much higher density of lower peaks; hence when operated near weak compression, the clipping effect is highly pronounced and leads to high signal distortion. Such performance deterioration puts a strong constraint on real-time applications, as most signals are characterized by high dynamic PAPR that varies with the system load. In the following, a better understanding of the DPD behavior is presented. In addition, Fig. 2 also shows that iterating twice the DPD extraction procedure will lead to better DPD performance with an additional improvement of 1 dB in the output power for a low ACPR value. Iterating further the DPD extraction did not led to additional improvement. It should be mentioned that for the case where DPD was applied to the original signal with two-step iteration, it generated a signal with a PAPR higher than 30 dB, which cannot be handled by the driver PA. 2) Error vector magnitude: Distorting the input signal might raise questions regarding the in-band errors in the output signal of the PA. Will the effect of the distortion be eliminated at the output of the PA? An evaluation of the EVM, which is defined in Section II, for
5 45
40
35
PAE (%)
1dB 30
original reduced clipped pre−distorted1 pre−distorted2 reduced+pre−distorted1 reduced+pre−distorted2 clipped+pre−distorted1 clipped+pre−distorted2
25
20
15
10 35
Fig. 4.
24 22 20
PAPR (dB)
18 16
36
37
38
39 40 41 Output power (dBm)
42
43
44
45
Class-AB: Power added efficiency evaluation. original reduced clipped pre−distorted1 pre−distorted2 reduced+pre−distorted1 reduced+pre−distorted2 clipped+pre−distorted1 clipped+pre−distorted2
1dB
14 12 10 8 6 4 35
Fig. 5.
36
37
38
39 40 41 Output power (dBm)
42
43
44
45
Class-AB: Input stage signal PAPR evaluation.
the output signal versus output power, is presented in Fig. 3. It is shown that applying DPD to both PAPR reduced signals will improve the EVM at high power levels up to a point where DPD deteriorates, with some additional improvement when using the two-step DPD. It should be mentioned that both PAPR reduction techniques were optimized to operate near the maximum −19 dB EVM allowed in the WLAN standard for the used modulation type. 3) Power added efficiency: The main reason for applying PAPR reduction and DPD is to increase the operation margin of the PA, achieve an efficient use of the supplied power, while maintaining decent linear performance. Fig. 4 presents the power added efficiency (PAE) as a function of the output power for the different scenarios. PAE represents the ratio of the difference between the output and input power of the PA over its drain supplied DC power. The (output power, PAE) levels for each scenario are chosen in this evaluation with respect to an ACPR performance of −40 dBc and a maximum EVM of −19 dB, which are typically used for WLAN transmitters. Applying DPD to the original signal will give an improvement of 5 %-points in PAE, while reducing the PAPR of the signals gives improvements up to 8 %-points. Combining both
PAPR reduction techniques and DPD offers the possibility to achieve an even higher efficiency with an average increase of 13 %-points in PAE for the best case where two-step DPD is used. It is noticed from Fig. 4 that both PAPR reduction techniques gave similar results, with an additional improvement of 1 %-point for the convex optimization based method. Also, it is noticed that applying the two-step DPD gives an additional improvement of 3 %-points with respect to using one-step DPD. 4) Input stage signal PAPR: From the previous evaluations, it was shown that DPD performs well until a certain compression level is reached where its performance deteriorates rapidly. To investigate this behavior, an evaluation of the PA input signal PAPR as a function of the output power is presented in Fig. 5. It can be seen that when reaching an operating power level where peaks start to clip, DPD attempts to compensate the compression by an expansion, i.e. applying very large amplitudes to the PA, hence a signal with high PAPR. As the PA is in hard compression, this does not yield any performance improvement but can easily lead to overheating, or burning out the power transistor. Two methods for overcoming such behavior, i.e. generation of unrealistic high peaks and achieving higher operating power levels with DPD, hence higher PAE with acceptable ACPR and EVM, were suggested in [9]. One of the methods is to extract the DPD parameters of the cascaded PAPR-DPD blocks, such that the peaks of the DPD output signal are limited. The other is to combine both PAPR reduction and DPD as one optimization problem that extracts the DPD parameters based on reduced signal peaks. B. Doherty Power Amplifier 1) Adjacent channel power ratio: Figure 6 shows the inherent nonlinear behavior of the Doherty PA when using the original signal. Such behavior points out the need for a correction method to improve its linearity and allow operation at higher power levels with increased efficiency. Applying DPD to the original signal significantly improves ACPR by more than 15 dB. This is in line with results reported earlier in [17], and for a general Doherty PA behavior as noted in [1]. In addition, Fig. 6 shows that at a certain power level the DPD performance deteriorates, similarly to what is reported in Section V-A. Considering the use of PAPR-reduced signals, Fig. 6 shows that reducing the PAPR of the signal does not lead to large improvements in linearity, as reported in Section V-A for classAB. This is due to the fact that the Doherty PA has different characteristics compared to the class-AB PA, with stronger nonlinear behavior at low power levels. However, this is easily corrected by DPD, as seen in Fig. 6, where the DPD for the PAPR-reduced signal improves ACPR by more than 12 dB. In addition, it allows achieving higher output power levels as compared to only using DPD, with an extra 4 dB, which is equivalent to the PAPR reduction value. Now considering the use of the two-step DPD, a substantial improvement in ACPR is achieved in the zone where the
6
−28 −30
ACPR (dB)
−32 −34
55
original reduced clipped pre−distorted1 pre−distorted2 reduced+pre−distorted1 reduced+pre−distorted2 clipped+pre−distorted1 clipped+pre−distorted2
50 45 40
1dB
1dB
35 PAE (%)
−26
−36 −38
30 original reduced clipped pre−distorted1 pre−distorted2 reduced+pre−distorted1 reduced+pre−distorted2 clipped+pre−distorted1 clipped+pre−distorted2
25
−40 20 −42 15 −44 10
−46 34
Fig. 6.
36
38
40 42 44 Output power (dBm)
46
48
5 34
50
Doherty: Adjacent channel power ratio evaluation.
Fig. 8.
−15 24 22
−20
20 1dB
−30 original reduced clipped pre−distorted1 pre−distorted2 reduced+pre−distorted1 reduced+pre−distorted2 clipped+pre−distorted1 clipped+pre−distorted2
−35
−40
−45 34
36
38
40 42 44 Output power (dBm)
46
48
50
Fig. 7. Doherty: Error vector magnitude evaluation at the output of the power amplifier.
peaking amplifier starts operating, i.e. 2 dB improvements in ACPR and 0.5 dB in output power. The explanation behind this behavior is the fact that the peaking amplifier is not properly modeled by one-step DPD. 2) Error vector magnitude: The EVM as a function of output power is shown in Fig. 7. Similar to the results reported in Fig. 3, the DPD corrects the in-band errors to maintain the EVM below the specified limit, until the DPD can no longer linearize the PA. It is also shown in Fig. 7 that applying two-step DPD reduces the in-band error. Figure 7 shows that the DPD-PA system does not increase the EVM, which could fail the transmission specifications. Hence, the EVM margin with respect to the standard can be used to relax the constraints on PAPR reduction. 3) Power added efficiency: In Fig. 8 the PAE is shown as a function of output power. As in Fig. 4, the horizontal lines mark the PAE at maximum output power where ACPR and EVM are below the specified limits. A substantial difference in PAE compared to Fig. 4 is observed. In previous sections, it was noted that the Doherty PA exhibits poor linearity at all power levels. However, it can
18 PAPR (dB)
EVM (dB)
−25
16
36
38
40 42 44 Output power (dBm)
46
48
50
Doherty: Power added efficiency evaluation. original reduced clipped pre−distorted1 pre−distorted2 reduced+pre−distorted1 reduced+pre−distorted2 clipped+pre−distorted1 clipped+pre−distorted2
1dB
14 12 10 8 6 4 34
Fig. 9.
36
38
40 42 44 Output power (dBm)
46
48
50
Doherty: Input stage signal PAPR evaluation.
easily be corrected using DPD. The better linearity of the class-AB PA at low power levels means that for such type of amplifiers it is more important to reduce the PAPR than to apply DPD. For the Doherty amplifier the situation is the opposite, hence applying DPD to the original signal results in larger improvement as compared to only applying PAPR reduction. On the other hand, when considering the high power region, the effect of PAPR on DPD is clearly pronounced, with an increase up to 4 dB in output power and 11.2 %-points in PAE, as compared to only using DPD. Figure 8 also shows that applying two-iteration DPD gives an additional improvement of 0.4 dB in output power and 2.8 %-points in efficiency. 4) Input stage signal PAPR: The PAPR of the input signals to the Doherty PA is shown in Fig. 9. As reported in Fig. 5 for class-AB PA, the DPD drastically increases the PAPR until a power level is reached where it is no longer possible to correct for the compression. In such situations, suggestions such as those mentioned in Section V-A4 can give additional improvement. VI. D ISCUSSIONS For the class-AB amplifier, combining both PAPR reduction and DPD gives the ultimate performance in ACPR and PAE,
7
TABLE I I MPROVEMENT IN OUTPUT POWER AND PAE FOR THE CLASS -AB PA RELATIVE TO THE ORIGINAL SIGNAL (38.5 dBm, 21.5%) WHILE SATISFYING ACPR < −40 dB AND EVM < −19 dB Improvement output Improvement Test case power [dB] PAE [%-points] reduced 2.5 8 clipped 2.2 7 pre-distorted1 1.5 5 pre-distorted2 0.5 1.5 reduced+pre-distorted1 4.7 18 reduced+pre-distorted2 5.3 21 clipped+pre-distorted1 4.4 16 clipped+pre-distorted2 5.0 19.5
with additional improvements when two-step DPD is used, as shown in Tab. I. Slight differences in performance were reported between the PAPR reduction methods in favor of the convex optimization reduction, for the signal conditions used, (see Tab. I). Such difference are expected to be more pronounced when a higher order modulation technique with tighter EVM constraints is used, which limits the performance of clipping and filtering. For an ACPR value below −40 dBc as typically used in WLAN, improvements of 8 %points in PAE and 2.5 dB in output power were achieved when using PAPR reduction as compared to only 5 %-points in PAE and 1.5 dB in output power when applying DPD to the original signal. This is due to the early deterioration of the DPD performance caused by the presence of strong peaks in the signal. Combining PAPR reduction and DPD gave impressive improvements of 10 %-points in PAE and 2.2 dB in output power with respect to only applying PAPR reduction techniques, with additional 3 %-points and 0.6 dB improvements when two-step DPD was used. The advantage of using a two-step DPD at strong compression is to better model memory effects in the PA caused by the DPD expansion of the signal, and hence generation of relatively strong peaks, which heat the PA, pushing it into deeper compression, and stress the bias circuit. It should be mentioned that applying a two-step iteration DPD to the original signal at strong compression has led to the generation of strong peaks in order to compensate for the compressive behavior of the amplifier. Such a pre-distorted signal characterized by PAPR larger than 30 dB cannot be handled by the driver PA, and hence could not be transmitted. This explains the limited improvements reported in Tab. I for that specific scenario. For the Doherty PA, a different behavior as compared to the class-AB PA was reported and summarized in Tab. II. Due to the inherent nonlinear behavior of Doherty amplifiers, reducing the PAPR of the signal did not give proportional improvement in ACPR, and hence in the allowed output power. Reducing PAPR by 4 dB only gave improvement up to 1.4 dB in output power and 3.5 %-points in PAE, compared to 7.4 dB in output power and 24 %-points when only using DPD. On the other hand, the effect of combining PAPR reduction and DPD was clearly pronounced with improvement up to 4 dB in output power and 11.2 %-points in PAE compared to only using DPD. Both PAPR reduction techniques gave similar performance, while applying two-step DPD gave additional
TABLE II I MPROVEMENT IN OUTPUT POWER AND PAE FOR THE D OHERTY PA RELATIVE TO THE ORIGINAL SIGNAL (36.7 dBm, 13.5%) WHILE SATISFYING ACPR < −40 dB AND EVM < −19 dB Improvement output Improvement Test case power [dB] PAE [%-points] reduced 1.4 3.5 clipped 1.2 2.5 pre-distorted1 7.3 23.5 pre-distorted2 7.4 24.0 reduced+pre-distorted1 11.3 34.7 reduced+pre-distorted2 11.7 37.5 clipped+pre-distorted1 11.2 34.2 clipped+pre-distorted2 11.6 37.0
improvement of 0.4 dB and 2.8 %-points when combined with PAPR reduction. VII. C ONCLUSIONS Methods for peak-to-average power ratio reduction and digital pre-distortion were experimentally evaluated on two different types of power amplifiers with respect to linearity and efficiency, when OFDM signals are used as excitation. The PAPR reduction techniques were based on a state-of-art convex optimization formulation and a standard clipping-and-filtering. The DPD technique used was based on the indirect learning architecture, and its parameters were extracted in one-step and two-step iterations. The PAs under test were a standard classAB and a Doherty amplifier. Measurement results showed similar performance between the PAPR reduction methods with a slight favor of the convex optimization reduction technique, for the signal conditions used. Such difference is expected to be more pronounced when higher order modulation techniques are used. In addition, the measurement results showed that the classAB and Doherty amplifiers behaved differently when applying the PAPR reduction techniques and DPD separately. For the class-AB PA, applying the PAPR reduction techniques led to better performance in ACPR, PAE and output power when compared to applying only DPD. For the Doherty PA, applying DPD outperformed the PAPR reduction techniques due to the inherent nonlinear behavior of Doherty amplifiers. Nevertheless, combining PAPR reduction and DPD realized the ultimate performance for both amplification techniques, with impressive improvements in achieved output power and efficiency for a low ACPR and EVM. Such improvements were more pronounced when extracting the DPD parameters iteratively in two steps, which compensates for any additional memory effects and distortions caused by the DPD generation of large peaks at strong compression. Digital signal processing is expected to become free; according to Moore’s law it will be cheaper as time progresses. The race for new algorithms that push the devices beyond their hardware limitations continues, with expectation of substantial improvement in linearity, efficiency, and output power without additional requirements on the hardware. Despite the current power dissipation status of the digital signal processing, the achieved results are considered to be significant in a world where every dB is worth a billion.
8
ACKNOWLEDGEMENT This research was funded by a research grant from Ericsson’s Research Foundation (FOSTIFT-10:019), by the Swedish Research Council (VR), by a postdoctoral fellowship of the Research Foundation-Flanders (FWO), the Flemish Government (Methusalem Fund METH1). R EFERENCES [1] S. Cripps, RF Power Amplifiers for Wireless Communications, 2nd ed. Boston, MA: Artech House, 2006. [2] F. Ghannouchi and O. Hammi, “Behavioral modeling and predistortion,” IEEE Microw. Mag., vol. 10, no. 7, pp. 52–64, Dec. 2009. [3] L. Anttila, P. Händel, and M. Valkama, “Joint mitigation of power amplifier and I/Q modulator impairments in broadband direct-conversion transmitters,” IEEE Trans. Microw. Theory Tech., vol. 58, no. 4, pp. 730– 739, Apr. 2010. [4] S. Sen, R. Senguttuvan, and A. Chatterjee, “Concurrent PAR and power amplifier adaptation for power efficient operation of WiMAX OFDM transmitters,” in IEEE Radio and Wireless Symp., Jan. 2008, pp. 21–24. [5] H. Ochiai and H. Imai, “Performance analysis of deliberately clipped OFDM signals,” IEEE Trans. Communi., vol. 50, no. 1, pp. 89 –101, Jan. 2002. [6] A. Aggarwal and T. Meng, “Minimizing the peak-to-average-power ratio of OFDM signals using convex optimization,” IEEE Trans. Signal Process., vol. 54, no. 8, pp. 3099–3110, Aug. 2006. [7] C. Nader, P. Händel, and N. Björsell, “Peak-to-average power reduction of OFDM signals by convex optimization: experimental validation and performance optimization,” IEEE Trans. Instrum. Meas., vol. 60, no. 2, pp. 473–479, Feb. 2011. [8] M. Helaoui, S. Boumaiza, A. Ghazel, and F. Ghannouchi, “On the RF/DSP design for efficiency of OFDM transmitters,” IEEE Trans. Microw. Theory Tech., vol. 53, no. 7, pp. 2355–2361, Jul. 2005. [9] C. Nader, P. N. Landin, W. Van Moer, N. Björsell, P. Händel, and M. Isaksson, “Peak-to-average power ratio reduction versus digital predistortion in OFDM based systems,” in IEEE MTT-S Int. Microw. Symp. Dig., Jun. 2011, pp. 1–4. [10] Wireless LAN Medium Access Control (MAC) and Physical Layer (PHY) Specifications: High-Speed Physical Layer in the 5 GHz Band, IEEE 802.11a Std., 1999. [11] S. Boyd and L. Vandenberghe, Convex Optimization. Cambridge University Press, 2004. [12] J. Armstrong, “Peak-to-average power reduction for OFDM by repeated clipping and frequency domain filtering,” Electron. Lett., vol. 38, no. 5, pp. 246–247, Feb. 2002. [13] W. Xu and S. Yu, “PAR reduction in OFDM systems based on clipped power re-allocation,” in Proc. Int. Conf. Wireless Communi. Signal Process., Nov. 2009, pp. 1–4. [14] H.-G. Ryu, B.-I. Jin, and I.-B. Kim, “PAPR reduction using soft clipping and ACI rejection in OFDM system,” IEEE Trans. Consum. Electron., vol. 48, no. 1, pp. 17–22, Feb. 2002. [15] A. D’Andrea, V. Lottici, and R. Reggiannini, “RF power amplifier linearization through amplitude and phase predistortion,” IEEE Trans. Communi., vol. 44, no. 11, pp. 1477–1484, Nov. 1996. [16] M. Isaksson, D. Wisell, and D. Rönnow, “A comparative analysis of behavioral models for RF power amplifiers,” IEEE Trans. Microw. Theory Tech., vol. 54, no. 1, pp. 348–359, Jan. 2006. [17] D. Wisell, M. Isaksson, N. Keskitalo, and D. Rönnow, “Wideband characterization of a Doherty amplifier using behavioral modeling,” in Proc. ARFTG Conf., Jun. 2006, pp. 190–199. [18] C. Eun and E. Powers, “A new Volterra predistorter based on the indirect learning architecture,” IEEE Trans. Signal Process., vol. 45, no. 1, pp. 223–227, jan. 1997. [19] L. Ding, G. T. Zhou, D. R. Morgan, Z. Ma, J. S. Kenney, J. Kim, and C. R. Giardina, “A robust digital baseband predistorter constructed using memory polynomials,” IEEE Trans. Communi., vol. 52, no. 1, pp. 159–165, Jan. 2004.
Charles Nader (S’08) received an M.E. in electrical engineering from the Lebanese University ULFG2, Lebanon, in 2005 and an M.Sc in EE/Telecommunication from the University of Gävle, Sweden in 2006. In 2008, he joined the University of Gävle, center for RF measurement technology, and the Royal Institute of Technology, signal processing lab, Sweden, where he is currently working toward his Ph.D degree. In 2010, he received the degree of Licentiate of Engineering in Telecommunication/Signal Processing from the Royal Institute of Technology. In 2010, he also joined the Vrije Universiteit Brussel, ELEC Department, Belgium, working toward a double PhD degree. His main research focuses on signal shaping techniques, sampling-based measurement techniques, and compressive sampling.
Per Niklas Landin (S’07) received his M.Sc. degree from the Uppsala University in 2007 and the degree of licentiate in technology from the Royal Institute of Technology, Stockholm, in 2009. He is currently working towards the Ph.D. degree at the University of Gävle and at the Royal Institute of Technology, Stockholm. His main interest is signal processing techniques for modeling and linearization of nonlinear radio frequency devices.
Wendy Van Moer (S’97-M’01-SM’07) received the Engineer and Ph. D. degrees in applied sciences from the Vrije Universiteit Brussel (VUB), Brussels, Belgium, in 1997 and 2001, respectively. She is currently an Associate professor with the Electrical Measurement Department (ELEC), VUB. Her main research interests are nonlinear measurement and modeling techniques for medical and high-frequency applications. She was the recipient of the 2006 Outstanding Young Engineer Award from the IEEE Instrumentation and Measurement. Since 2007 she has been an associate editor for the IEEE Transactions on Instrumentation and Measurement and in 2010 she became an associate editor of the IEEE Transactions on Microwave Theory and Techniques.
Niclas Björsell (S’02-M’08) was born in Falun, Sweden, in 1964. He received his B.Sc. in Electrical Engineering and his Lic. Ph. in Automatic control from Uppsala University, Sweden in 1994 and 1998, respectively. His Ph. D. in Telecommunication was received at the Royal Institute of Technology, Stockholm, Sweden, in 2007. He has several years of experience from research and development projects that fostered collaborations between industry and the academy. He has worked as project manager for some of the R&D projects. Since 2006 he has served as the head of Division of Electronics at the Department of Technology and Built Environment, University of Gävle, Sweden. He has published more than 20 papers in journals and conferences, and his research interests include radio frequency measurement technology and analog-to-digital conversion. Dr. Börsell is a voting member of the IEEE, Instrumentation and Measurement, TC-10.
9
Peter Händel (S’88-M’94-SM’98) received his Ph.D. at Uppsala University in 1993. From 1987 to 1993, he was at Uppsala University. During 19931997, he was with Ericsson AB, Kista, Sweden. During 1996-1997, he was also with Tampere University of Technology, Finland. Since 1997, he has been with the Royal Institute of Technology, Stockholm, Sweden, where he is currently a Professor of signal processing. From 2000 to 2006, he held a part-time position at the Swedish Defense Research Agency. 2007-2010 he was a guest professor at the University of Gävle, Sweden. Currently, he is a visiting professor at the Indian Institute of Science, Bangalore, India. He has served as an Editorial Board Member of the EURASIP Journal of Advances in Signal Processing, and an Editorial Advisory Board Member of Recent Patents on Electrical Engineering. He is a member of the Editorial Board of Hindawi’s Research Letters in Signal Processing, and Journal of Electrical and Computer Engineering. He has served as Associate Editor of the IEEE Transactions on Signal Processing.