XIX IMEKO World Congress Fundamental and Applied Metrology September 611, 2009, Lisbon, Portugal
PERFORMANCE EVALUATION OF PROBING SYSTEMS IN DATA CAPTURE FOR KINEMATIC PARAMETER IDENTIFICATION AND VERIFICATION OF ARTICULATED ARM COORDINATE MEASURING MACHINES Jorge Santolaria 1, Juan José Aguilar 1, Agustín Brau 1, Francisco Javier Brosed 1 1
Design and Manufacturing Engineering Department, C.P.S. University of Zaragoza, Zaragoza, Spain,
[email protected]
Abstract This paper presents a comparison of different techniques to capture nominal data for its use in later verification and kinematic parameter identification procedures for articulated arm coordinate measuring machines (AACMM). By using four different probing systems (passive spherical probe, active spherical probe, self-centering passive probe and self- centering active probe) the accuracy and repeatability of captured points has been evaluated. The nominal points are materialized by a ball-bar gauge distributed in several positions of the measurement volume. By comparing these systems it is possible to characterize the influence of the force over the final results for each of the gauge and probing system configurations. The results with each of the systems studied show the advantages and original accuracy obtained by active probes, and thus their suitability in verification (active probes) and kinematic parameter identification (selfcentering active probes) procedures.
result in the loss of accuracy in the verification procedure or during the process of capturing data for parameter identification. In this work we present a comparison of different data capture techniques and an analysis of the influence of the probing force in each of them, showing the most adequate procedure to capture data for the verification and parameter identification procedures. 2. METHODOLOGY In order to capture the data a ball bar gauge was used to materialize nominal points and distances in the workspace of an AACMM.
Keywords: Articulated arm coordinate measuring machines; Performance evaluation; Probing system comparison. 1. INTRODUCTION One of the key aspects in the procedure of identifying the parameters of a kinematic model of an AACMM or robot arm [1-7] is the process of capturing data. This data will be compared to nominal distance and position data obtained from a gauge or some other measurement instrument which functions as a gauge, thus allowing us to define an error objective function to be minimized by means of a mathematical optimization procedure [8]. Once the parameters have been identified, the best attainable accuracy in this type of equipment will greatly depend on the type and number of positions captured by the AACMM or robot arm [9, 10] and, ultimately, on the extent to which the number of influences on the capture of points can be minimized. Because the AACMM is a manuallyoperated instrument, the results obtained in its verification tests are subject to influences from the operator, mainly materialized through different probing forces during the data capture process. These external probing forces cause deformations to the gauge or to the probe [11, 12] which can
ISBN 978-963-88410-0-1 © 2009 IMEKO
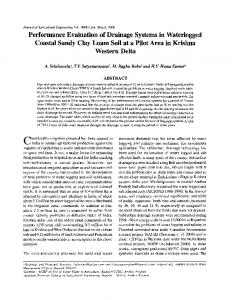
Fig. 1. Evaluated AACMM probing systems.
The ASME B89.4.22-2004 standard, the only existing standard in the field of AACMM verification, establishes verification procedures based solely in the capture of points through passive and active spherical tip probes. In this case, the influence of the probing force over the behavior of the articulated arm has been analyzed, obtaining the
1846
measurement error from the same physical points of the ball bar gauge through four different probing systems: passive spherical probe, active spherical probe, self-centering passive probe based on inverse kinematic coupling [8] and self-centering active probe based on parallel kinematics [13] (Fig. 1). In the Figure, the photos in the first row show the passive spherical probe (left) and active spherical probe (right) and those in the second row correspond to the selfcentering passive probe (left) and self-centering active probe (right). In the process of probing the points, a total of 28 spheres have been probed corresponding to seven different positions of the gauge in a quadrant of the AACMM workspace. From captured data we’ve analyzed the combined influence of the probing force and the probing direction in the final results with each probing system according to the gauge configuration.
Fig. 2. Ball bar gauge test positions and support. Table 1. List of ball bar gauge positions in quadrant 1. Position No. 1 2 3 4 5 6 7
3. DATA CAPTURE SETUP There are two ways to express the configuration of an AACMM as a function of the degrees of freedom of its articulations. The first one is to indicate, by means of three consecutive numbers, the degrees of freedom of the shoulder, elbow and hand articulations, respectively. The second one is by defining through a chain of letters each of the possible rotations of the articulations of the shoulder, elbow and hand. The AACMM used in the present work is a 7 dof Platinum series FARO arm with a typical 2-2-3 configuration or a-b-c-d-e-f-g deg rotation (Fig. 1), with a nominal value of semirange of 0.030 mm obtained in a single-point articulation performance test of the arm manufacturer. A continuous data capture method has been used for the self-centering probes, and discrete capture has been used for active and passive spherical probes. The continuous capture technique allows the massive capture of arm positions corresponding to several points of the workspace. To this end, a ball-bar gauge of 1.5 m long was placed in 7 positions within the workspace of the arm in order to cover the maximum number of possible AACMM positions, to subsequently extrapolate the results obtained throughout the volume. Fig. 2 and Table 1 show the considered positions for the bar in a quadrant of the workspace. The ball-bar comprises a carbon fiber profile and 15 ceramic spheres of 22 mm in diameter, reaching calibrated distances between the centers with an uncertainty, in accordance with its calibration certificate, of (1+0.001L)µm, with L in mm. In this configuration, 4 spheres of the gauge in each of the 7 positions considered are probed, materializing 6 distances between their centers. With passive and active spherical tip probes, around 25 points of the sphere surface have been captured in each measured sphere, while with the self-centering probes around 250 center points have been captured for each sphere (Fig. 3a). For these probes, besides characterizing the performance of the arm relative to error in distances, its capacity to repeat measurements of a same point is also tested.
Quadrants C1-C2-C4 C1-C4 C1-C2 C1 C1-C2-C4 C1-C2-C4 C1
Tilt Horizontal Horizontal Horizontal Horizontal +45º -45º Vertical
Distance B1 Medium Near Far Near Medium Medium Medium
Direction Tangential Tangential Tangential Radial Tangential Tangential Tangential
Hence, automatic arm position capture software has been developed to probe each considered sphere of the gauge and to replicate the arm behavior in the single-point articulation performance test, but in this case, to evaluate its repeatability. The rotation angle values of the arm joints for each position, reached in the continuous probing of each sphere, are stored to obtain the coordinates of the measured point with respect to the global reference system for any set of parameters considered. In this way, with the selfcentering probes in contact with the sphere, it is possible to capture the maximum possible number of arm positions, thus covering a large number of arm configurations for each sphere considered. The centering of the probe direction with regards to the sphere center is ensured with the selfcentering probes, making this direction cross it (Fig. 3b) for any orientation of the probe. Thus, it is possible to define in this case a probe with zero probe sphere radius and with a distance of 22 mm from the position of the housing to the center of the probed sphere, allowing direct probing of the sphere center when the three spheres or planes of the probes and the sphere of the gauge are in contact. 4. TEST AND RESULTS 4.1 Self-Centering Probes In the configuration presented for both groups of probes, results of distance errors between centers have been obtained for each of the 6 distances materialized in each of the 7 ball bar positions. In the case of the self-centering probes, the mean point of all the captured data for each sphere was considered as the center of the sphere probed (Fig. 3a). Measured distances for each sphere in the 7 different positions were compared with the distances obtained with the ball bar gauge thus obtaining the error in distance (Fig. 4), as well as the differences between the
1847
distance errors of the active spherical probe and the passive spherical probe in all 42 positions that were considered (Fig. 5).
possible to calculate the error in distance between spheres j and k in location i given by Ei jk Di jk D0ik POS1
POS2
POS3
POS4
(3)
POS5
POS6
POS7
Pasive Active
Error in Distance (mm)
0.14 0.12 0.1 0.08 0.06 0.04 0.02 0
5
10
15
20
25
30
35
40
Position
Fig. 3. a) Center points considered for distance error with selfcentering probes; b) Probing the center of a sphere with passive and active self-centering probes.
Fig. 4. Error in distance of the centers measured. POS1
A positive difference represents a smaller error in the active spherical probe and in that case this probe is considered better than the passive one. In the case of positions 3, 4 and 7, three spheres were not measured, so a value of zero was assigned in the graphs. From Fig. 4, we can observe that on average, the error made by the selfcentering active probe was less than the one corresponding to the self-centering passive probe; the errors obtained with the active probe, when greater than those corresponding to the passive probe, can be associated to AACMM as it approaches its workspace frontier. The three-dimensional distances between spheres were obtained from the mean centers calculated for each sphere; so that the distance Di jk
Di jk
X
ij
- X ik Yij - Yik Z ij - Z ik 2
2
X ij
nij m 1
X (m)ij
nij
for sphere j in identification position i of the gauge), and analogously for the coordinates Y and Z . In this manner, considering D0 jk as the nominal distance between spheres
POS6
POS7
Pasive Active
Difference in Distance Error
0.04 0.02 0 -0.02 -0.04 -0.06
5
10
15
20
25
30
35
40
Position
(1)
(nij represents the number of angle combinations captured
POS5
0.06
-0.08 0
(2)
POS4
0.08
Fig. 5. Difference in distance errors between active probe and passive probe.
which is the euclidean distance between the points X ij , Yij , Zij and X ik , Yik , Zik , where
POS3
0.1
from sphere j to sphere k of position i is given by 2
POS2
The repeatability error values for all measured points are shown in Fig. 6a and 6b, for the self-centering active probe and self-centering passive probe respectively. These values represent the errors made in X , Y and Z coordinates of each one of the approximately 10000 points obtained, corresponding to the 7 positions of the ball-bar gauge with regards to the mean obtained for each sphere. The repeatability error value for each coordinate as a function of the 6 joint rotation angles is given by
j and k obtained in the gauge calibration table, it is
1848
Xijk (1 , 2 , 3 , 4 , 5 , 6 ) X ij X ij
(4)
Zijk (1 , 2 ,3 , 4 ,5 , 6 ) Z ij Z ij
POS1 0.15 0.1 0.05 0 -0.05 -0.1 -0.15
POS2
POS3
POS4
POS5
POS6
POS1 0.2 0.15 0.1 0.05 0
POS2
POS3
POS7
5
10
15
20
25
20
25
20
25
B1 B6 B10 B14 1000 2000 3000 4000 5000 6000 7000 8000 9000100001100012000
0.2 0.15 0.1 0.05 0
5
10
15
Position Repetability Z (mm)
Repeatability Error Y (mm)
POS6
Position
1000 2000 3000 4000 5000 6000 7000 8000 9000100001100012000
Position Repeatability Error Z (mm)
POS5
Active
Position 0.13 0.08 0.03 -0.02 -0.07 -0.12 -0.17
POS4
Pasive
POS7
Repetability Y (mm)
Repeatability Error X (mm)
It can be observed that the error made by the self-center active probe is a lot smaller than the error made by the selfcenter passive probe and that in both graphs the error shows an increment in the z coordinate. This behavior in the z coordinate, could be explained by the fact that, unlike what happens in the x and y coordinates, there is no selfcompensation effect in the gauge deformation due to the probing force in this coordinate.
In Fig. 7 we can observe the standard deviation corresponding to the 7 different positions in x, y and z for both types of probes. As expected, the standard deviation in the self-centering active probe is smaller than the one obtained with the self-centering passive probe, except as mentioned earlier, in the positions were spheres were not measured and a value of zero was assigned in the graph.
Repetability X (mm)
Yijk (1 , 2 ,3 , 4 ,5 , 6 ) Y ij Yij
0.6 0.5 0.4 0.3 0.2 0.1 0
5
10
15
Position
0.25 0.15
Fig. 7. Standard deviation of the center spheres.
0.05 -0.05 -0.15 -0.25
1000 2000 3000 4000 5000 6000 7000 8000 9000100001100012000
Position
Fig. 6a. Point repeatability errors for the 7 AACMM positions using the active self-centering probe.
Fig. 6b. Point repeatability errors for the 7 AACMM positions using the passive self-centering probe.
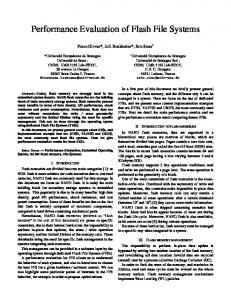
4.2 Spherical tip probes In the case of passive and active spherical probes, the centers of the spheres were obtained by means of the least squares method, using the captured surface points. This also allowed us to obtain both the distance from each probed point to the surface of the sphere and the standard deviation of this distance. In Fig. 8 the graph shows the error in distance between the centers of the gauge spheres obtained with the active spherical probe against the error in distance between the centers obtained with the passive spherical probe, relative to the distances calculated with the gauge bar. With regard to the error in distance, we can observe that the error made with the active probe is slightly smaller than that made with the passive probe, except in positions 5 and 6. However, it is important to mention that the errors are almost equal in all positions. Fig. 8 shows that most of the final error obtained with the AACMM in the probing of the spheres is due to the measuring instrument itself with a very low influence of the probing system chosen in each case. The fact that we get almost the same error values in the same positions of the gauge ball bar with different probing systems strongly suggests that the error map shown in this figure is mainly associated to inadequate values of the kinematic model parameters, which leads to similar errors in the same positions of the measured sphere. On the other hand, it is noteworthy that the expected benefit a priori derived from the use of active probes is not associated with a lesser influence of probing force, but simply with a more comfortable capture process. This makes the cost of the active probing system unjustifiable, compared to the traditional passive probing systems.
1849
POS1
POS2
POS3
POS4
POS5
POS6
POS7
Pasive Active
Error in Distance (mm)
0.15 0.1 0.05 0 -0.05 -0.1 -0.15 -0.2
5
10
15
20
25
30
35
40
Position
identification, because they drastically reduce the capture time and the required number of positions of the gauge as compared to the usual standard and manufacturer methods. These systems are also very suitable for their capacity of capturing multiple positions of the AACMM for a single gauge position, so that the accuracy results obtained after a procedure of identification or verification are more generalizable than those obtained with the traditional probing systems. The effect of auto compensation of the gauge deformation has been shown by properly defining the trajectories of capture or the direction of probing during the process of capturing data. Moreover, it has been demonstrated that the smallest influence of the probing force is obtained in the case of the self-centering active probe, this being the most adequate system in tasks of verification or capturing data for the identification of kinematic parameters if no configuration or application restrictions are imposed.
Fig. 8. Error in distance of the centers measured.
Difference of Error in Distances - Pasive Vs Active (mm)
Figure 9 shows the difference between the distance errors of active spherical probe and those of the passive spherical probe in all 42 positions that were used. When a positive difference is obtained, the active spherical probe error is smaller and thus better than the active spherical probe, and vice versa when the difference is negative. 0.03
POS1
POS2
POS3
POS4
POS5
POS6
POS7
Active Pasive
0.02 0.01 0 -0.01 -0.02 -0.03 -0.04 -0.05 -0.06 -0.07
5
10
15
20
25
30
35
40
Position
Fig. 9. Difference of distance error between active probe and passive probe. 5. CONCLUSIONS In this work, a comparison between four different probing systems applied to capturing data for parameter identification and verification of AACMM is presented. Besides the probing systems traditionally used in the verification of AACMM, self-centering probing systems with kinematic coupling configuration and self-center active probing systems have also been used for the same purpose. Such probing systems are very suitable for use in verification procedures and capturing data for parameter
REFERENCES [1]
J. Denavit, R.S. Hartenberg, A kinematic notation for lowerpair mechanisms based on matrices, Journal of Applied Mechanics, Transactions of the ASME 77 (1955) 215-221. [2] S. Hayati, M. Mirmirani, Improving the absolute positioning accuracy of robot manipulators, Journal of Robotic Systems 2(4) (1985) 397-413. [3] T.W. Hsu , L.J. Everett, Identification of the kinematic parameters of a robot manipulator for positional accuracy improvement, Computers in Engineering, Proceedings of the International Computers in Engineering Conference and exhibition (1) (1985) 263-267. [4] L.J. Everett, M. Driels, B.W. Mooring, Kinematic modelling for robot calibration IEEE International Conference on Robotics and Automation 1 (1987) 183-189. [5] P.N. Sheth, J.J. Uicket, A generalized symbolic notation of mechanism, ASME Journal of engineering for industrial (1971) 102-112. [6] H.W. Stone, A.C. Sanderson, C.F. Neumann, Arm signature identification, IEEE International Conference On Robotics And Automation 1 (1986) 41-48. [7] H. Zhuang, Z.S. Roth, Robot calibration using the CPC error model, Journal of Robotics and Computer Integrated Manufacturing 9(3) (1992) 227-237. [8] J. Santolaria, J.J. Aguilar, J.A. Yagüe, J. Pastor, Kinematic parameter estimation technique for calibration and repeatability improvement of articulated arm coordinate measuring machines, Precis. Eng., 32(4) (2008) 251-268. [9] G. Alici, B. Shirinzadeh, A systematic technique to estimate positioning errors for robot accuracy improvement using laser interferometry based sensing, Mechanism and Machine Theory 40 (2005) 879–906. [10] G. Chunhe, Y. Jingxia, N. Jun, Nongeometric error identification and compensation for robotic system by inverse calibration, International Journal of Machine Tools and Manufacture 40 (2000) 2119-2137. [11] A. Weckenmann, T. Estler, G. Peggs, D. McMurtry, Probing Systems in Dimensional Metrology, CIRP Annals Manufacturing Technology, 53(2), 2004, 657-684. [12] Puttock, M.J., Thwaite, E.G., Elastic compression of spheres and cylinders at point and line contact, Nat. Stds. Lab. Tech. Paper No. 25, CSIRO (1969).
1850
[13] E. Trapet, J.J. Aguilar, J.A. Yagüe, H. Spaan, H., V. Zelený, Self-Centering Probes with Parallel Kinematics to Verify Machine-Tools, Precis. Eng., 30(2) (2006) 165-179.
1851