İşletme Fakültesi Dergisi, Cilt 18, Sayı 1, 2017, 1-28 doi: 10.24889/ifede.320037
Gönderilme Tarihi: 02.11.2016 Kabul Tarihi: 08.05.2017
PERFORMANCE EVALUATION OF TURKISH BANKING SECTOR WITH DATA ENVELOPMENT ANALYSIS USING ENTROPIC WEIGHTS Aşkın Özdağoğlu*, Enis Yakut**, Sezai Bahar*** ABSTRACT Data envelopment analysis is one of the tools that has been used frequently on evaluating the performance of the firms. Particularly in today's competitive conditions, since the firms have been facing many external and/or internal factors closely, data envelopment anaysis (DEA) method is used for measuring inputs and outputs on the relative efficiency of operational processes. When the banking sector is analysed in Republic of Turkey, the degree of competition among the banks has shown that it is necessary for them to use their resources more efficiently. Hence, in terms of financial performance of banks, defining the efficiency limitations would be easier and more efficient with some statistical tools. The purpose of this study is to analyze the performance of all deposit banks in Turkey by using data envelopment anaysis with entropic weights. Keywords: Data Envelopment Analysis, Banking Sector, Banking Performance,
Entropic Weights
TÜRK BANKACILIK SEKTÖRÜNÜN PERFORMANS DEĞERLENDİRMESİNDE ENTROPİK AĞIRLIKLARLA VERİ ZARFLAMA ANALİZİ ÖZ Veri zarflama analizi firmaların performansını değerlendirmede sıklıkla kullanılan araçlardan birisidir. Özellikle günümüz rekabet şartlarında işletmelerin gerek dış gerekse iç faktörlere yakından maruz kalması ve bunun sonucunda girdi ve çıktıların operasyonel süreçlere göreli etkinliklerinin ölçülmesi için kullanılan bir yöntemdir. Türkiye’de bankacılık sektörü incelendiğinde bankalar arasındaki rekabetin düzeyi bankaların kaynak kullanımını en etkin şekilde kullanması gerektiğini göstermiştir. Bu yüzden bankaların finansal performansları açısından takip etmesi gereken etkinlik sınırlamalarının belirlenmesi bazı istatistiksel araçlarla daha kolay ve etkin olmaktadır. Bu çalışmanın amacı, entropik ağırlıkları içeren veri zarflama analizi ile Türkiye’de faaliyet gösteren tüm mevduat bankalarının performanslarının incelenmesidir. Anahtar Sözcükler: Veri Zarflama Analizi, Bankacılık Sektörü, Bankacılık
Performansı, Entropik Ağırlıklar *
Dokuz Eylül Üniversitesi, İşletme Fakültesi, İşletme Bölümü, İzmir, E-posta:
[email protected] ** Celal Bayar Üniversitesi, İşletme Fakültesi, İşletme Bölümü, Manisa, E-posta:
[email protected] *** Celal Bayar Üniversitesi, Kırkağaç Meslek Yüksekokulu, Manisa, E-posta:
[email protected]
Aşkın Özdağoğlu, Enis Yakut ve Sezai Bahar
INTRODUCTION When it is analyzed with detail, it can be easily realized that among the other sectors, banking sector has crucial role on the allocation of resources. Therefore, in this study, we decided to choose banking sector as it is very significant for the development of the most of the fields economically (Atan and Karpat, 2005). In today’s business world, “performance” is the key point for all operations of the firms, and the information is obtained through the performance of the firm. Without the information obtained from the performance evaluation, it is quite difficult for the firms to make decisions for the future. In this point, in order to ensure financial efficiency, banks place more emphasis on the measurement methods for the efficiency analysis, since both efficiency and profit are interrelated positively for the organization in the long term. Therefore, specifying the efficiency criteria from the point of banking performance is quite important for the banking sector, as it leads to estimate the financial performance indicators affecting the banking efficiency by using several statistical methods. Data Envelopment Analysis (DEA) is a mathematical programming based method which is used for measuring the efficiency criteria of the decision making unit. It is a nonparametric efficiency scale which is improved for measuring the relative efficiency of similar economic decisionmaking units in terms of produced goods or services. Especially, by using DEA, it is quite possible to define the inefficiency level of decision-making units for resource allocation. Accordingly, it guides managers what needs to be done on inefficient units for achieving the organization’s long term goals. Data Envelopment Analysis (DEA) is a popular and effective way of analyzing the private sector and public organizations and benchmarking the successful applications. In this study, we compare all deposit banks in Turkey, by considering the inputs (number of branches, number of personnel, interest expenses and provision for loan losses and other receivables) and identify the most effective service units by reviewing the outputs (financial assets available for sale and interest income). It is expected that, if an efficient producer (Bank A), is producing Y (A) units of output (interest income) with X (A) inputs (number of personnel), then other Banks should also do the same if they were to operate efficiently. The aim of the analysis is finding the best performer throughout the all producers. If a producer (Bank A) is achieving more output with the same amount of input, or achieving same amount of output with less input, then it can be concluded that this producer performs more efficient than 2
Türk Bankacılık Sektörünün Performans Değerlendirmesinde Entropik Ağırlıklarla Veri Zarflama Analizi
other producers (banks). The performance results will be presented in this paper with the application of a mathematical model to the input and output numbers of banks. This paper is organized as follows: In the second section, a brief review of Data Envelopment Analysis on evaluating the effectiveness of the banks will be presented. Then, in the third section, Data Envelopment Analysis and its common uses will be explained. In the fourth section, the calculation process of the entropic weights will be explained with the equations. Then a step by step explanation of mathematical model will be introduced. The Input and Output variable table will also be provided at the end of this section. In the fifth section, application of DEA with entropic weights will be presented and efficiency results will be discussed. The fifth Section will conclude the paper and will give managerial and theoretical insights about the performance analysis. LITERATURE REVIEW There were several studies about the usage of Data Envelopment Analysis (DEA) in financial studies. However, in banking sector, the methods used measuring the efficiency were separated into three categorizations; ratio analysis, parametric methods, and non-parametric methods. When the literature was analyzed, several types of inputs and outputs had been conducted in financial studies for measuring the efficiency. The influence of subprime crisis on the efficiency of Islamic banks in the Gulf Cooperation Council region using data envelopment analysis was investigated by extracting from either annual reports or official websites of banks. In the study, there were 30 Islamic banks that belong to the Gulf Cooperation Council region for the period that spans from 2005 to 2011. These countries were Saudi Arabia, Bahrain, Qatar, United Arab Emirates and Kuwait (Belanès, Ftiti and Regaïeg, 2015). A two-stage analysis to measure Islamic microfinance institutions’ performance by comparing them to conventional microfinance institutions was proposed. In the first stage of the study, a Data Envelopment Analysis framework was used for measuring Microfinance institutions’ efficiency from the viewpoint of social and financial efficiency. Input variables in the model are assets, employees, operating expenses, and portfolio at risk 30 days. Output variables in the study are inverse average loan borrower, 3
Aşkın Özdağoğlu, Enis Yakut ve Sezai Bahar
financial revenue and number of borrowers (Widiarto and Emrouznejad, 2015). Data envelopment analysis based on Malmquist productivity index was used for analyzing the productivity of 20 Kenyan microfinance institutions. Total assets, operating expenses, labor, financial revenue and number of active borrowers were used as the input and output variables in the study (Wijesiri and Meoli, 2015). Technical efficiencies of 36 microfinance institutions in Sri Lanka were examined with bias-corrected Data Envelopment Analysis. Two different Data Envelopment Analysis models were designed for finding the financial and social scores in the study. There were three different input variables as total assets, number of credit officers and cost per borrower. There were two different output variables as financial revenue for financial model and total number of female borrowers for social model in the study. (Wijesiri, Viganò and Meoli, 2015). New Fuzzy-DEA α-level models to assess underlying uncertainty were proposed with an application in Mozambican banks to handle the underlying uncertainty. In the study, 13 Mozambican banks (decision making units) were analyzed for 9 years (Wanke, Barros and Emrouznejad, 2015). In their studies, Puri and Yadav (2015) proposed that a hybrid intuitionistic fuzzy data envelopment analysis performance decision model which has some inputs and outputs such as subjective, linguistic and vague. Triangular intuitionistic fuzzy numbers were used in the model. Another distinctive point of the model was optimistic and pessimistic fuzzy efficiencies. 16 branches of State Bank of Patiala in India, in Amritsar district of the Punjab State were evaluated in terms of three inputs and two outputs, after explanation of hybrid model. The inputs used in their study are labor, operating expenses and interest expenses. The outputs used in the study are interest income and other income (Puriand Yadav, 2015). A new data envelopment analysis model called two-level data envelopment analysis was proposed for corporate financial failure prediction. The super-efficiency data envelopment analysis and the grey relational analysis were integrated for selecting financial indicators. The study has used companies listed in the Shenzhen Stock Exchange Market for validating the efficiency of the method (Huang, Dai and Guo, 2015). A two-stage methodology using the Slack-Based Measures Data Envelopment Analysis were adopted for examining bank efficiency in the Association of Southeast Asian Nations-5 which includes Indonesia, 4
Türk Bankacılık Sektörünün Performans Değerlendirmesinde Entropik Ağırlıklarla Veri Zarflama Analizi
Malaysia, the Philippines, Singapore and Thailand (Chan, Koh, Zainir and Yong, 2015). Data envelopment analysis were used for finding the managerial and profitability efficiencies of the banks in the Association of Southeast Asian Nations which includes Brunei Darussalam, Cambodia, Indonesia, Lao People’s Democratic Republic, Malaysia, the Philippines, Singapore, Thailand, and Vietnam. A data set included 138 commercial banks (Wu, Ting, Wei, Lu, Nourani and Kweh, 2016). The performance of Indian banking sector was analyzed with data envelopment analysis (Kaur and Gupta, 2015). Internet banking services’ efficiency of Romanian banks was computed with data envelopment analysis. There were three financial input variables which were deposits, total deposits and remittances; total operating costs and number of employees. There was only one internet banking input variable as the value of owned equipment and software programs. There was one financial output variable as net total revenues. There was one internet banking output variable as daily “reach” average rate in the model. (Stoica, Mehdian and Sargua, 2015). Efficiency values of the Czech commercial banks were found with Data Envelopment Analysis and determinants of efficiency in the Czech banking sector was analyzed (Repkova, 2015). Technical efficiency assessments of Slovak commercial banks were measured with data envelopment analysis (Bod’a and Zimkova, 2015). Efficiency profile of the Greek banking industry was measured with data envelopment analysis model. Due to the fact that the ability to discriminate between the decision making units decreases when the number of variables increase, only three input variables and one output variable was selected in the study. The input variables of the model were operating expenses, loan loss provisions and haircut on Greek bonds held by the banks. The output variable of the model was total loans (Tsolas and Charles, 2015). The literature review was made in order to evaluate the efficiency of DMU number and there were also a number of studies that couldn’t fulfill the condition of the total number which should be at least 2 or 3 times more than the output and input numbers of DMU. For example, in the study of Dotoli et al. (2015), there were fifteen DMUs (hospital), four input factors (the number of doctors, the number of nurses, the number of other personnel, the number of lavers) and three output factors (the number of discharges from hospital, the number of surgery, the number of hospital 5
Aşkın Özdağoğlu, Enis Yakut ve Sezai Bahar
treatments). There were also nine DMUs (automotive firms), three input factors (net assets, equity, the number of employees) and three input factors (turnover, pre-tax profit, export) in the study of Yılmaz et al. (2002). Survival probabilities of Greek banks in the debt crisis were analyzed with Data Envelopment Analysis and simulation. Taxes/assets and standard deviation of the assets annual percentage change were used as the input variables. Percentage of equities in the assets and percentage of profits in assets were used as the output variables in the study (Kyritsis, Rekleitis and Trivelas, 2015). A directional data envelopment analysis model was used for analyzing the impact of the 2008 financial crisis in a sample of Italian local banks. Customer loans, securities and bad loans were used as the output variables. Number of branches, number of workers and fundraising were used as the input variables in the study (Barra, Destefanis and Lavadera, 2016). Convergence of commercial, savings, and cooperative banks in the Eurozone was analyzed by calculating data envelopment analysis and stochastic frontier analysis. The data set was collected from the Bankscope database of Bureau van Dijk. Owing to the fact that a data envelopment analysis model with a higher number of variables would have higher efficiency estimates, three inputs and three outputs were used only. The input variables were personnel expenses, fixed assets, and deposits. The output variables were loans, other earning assets, and fee income in the study (Wild, 2016). The technical and scale efficiencies of Participation (Islamic) Banks and Conventional Deposit Banks in Turkey were compared with Data Envelopment Analysis. There were 4 Participation (Islamic) Banks and 28 Conventional Deposit Banks for the period of 2007-2013 in the data set. Total deposits and capital were used as the input variables. Total loan, income and investments were used as the output variables in the study (Yılmaz and Güneş, 2015). Technical efficiencies of commercial banks in Turkey were measured with data envelopment analysis (Ulaş and Keskin, 2015). A method for bank efficiency assessment was proposed based on weight restricted data envelopment analysis. Two different efficiency models which are banks’ funding mix and asset mix were illustrated. The data set included the 71 European banks in 20 different member states. The first data envelopment analysis model was depicted the transformation from funding to asset. The second data envelopment analysis model was 6
Türk Bankacılık Sektörünün Performans Değerlendirmesinde Entropik Ağırlıklarla Veri Zarflama Analizi
depicted the transformation from asset to income. The input variables of the first model were retail funding expenses, wholesale funding expenses, physical capital expenses, personnel expenses and impaired loan. The output variables of the first model were loans and financial assets. The input variables of the second model were property loan, non-property loan, trading financial assets, non-trading financial assets and impaired loan. The output variables of the second model were income and provision for impaired loan loss (Asmilda and Zhu, 2016). Data envelopment analysis and neural network were combined. For this purpose, an empirical application was made with 181 large U.S. banks. The variables in the study were the number of employees, equity, expenses, loans, deposits and investments (Kwon and Lee, 2015). The data envelopment analysis approach was used for estimating the efficiency of banks. The dataset in the study was included 960 observations between 2002 and 2009. There were 120 banks in six different countries which are China, India, Indonesia, Malaysia, Russia, and Thailand. According to the authors of the study, due to the fact that the data envelopment analysis approach would not handle missing data well, these countries were selected with similar levels of development and they would have more complete bank-level information. Three input variables which were fixed assets, total non-interest operating expense, and interest expense were used. Two output variables which were net interest income and other operating income would have been used for estimating the bank efficiency (Du and Sim, 2016). A slack-based measure network data envelopment analysis model was applied for evaluating overall and divisional efficiencies of Japanese regional banks (Ohsato and Takahashi, 2015). The efficiency levels of major Australian banks before, during and after the Global Financial Crisis were measured with the bootstrap Data Envelopment Analysis. The data set was included eight domestically owned Australian banks listed on the Australian Securities Exchange over the period 2006–2012 (MoradiMotlagh and Babacan, 2015). The dynamic network data envelopment analysis was explained in commercial banking with emphasis on testing robustness. Efficiency estimates for sub-decision making unit 1 according to interest-bearing operations and efficiency estimates for sub-decision making unit 2 according to non-interest operations with different weights were made in the study (Avkıran, 2015). 7
Aşkın Özdağoğlu, Enis Yakut ve Sezai Bahar
Time series data envelopment analysis method were proposed for measuring the relative efficiency of decision making units in multiple periods. According to the authors, there were negative impacts of data accumulation. A two-stage approach on the basis of Chebyshev inequality bounds should be used for minimizing the negative impacts of data accumulation. The proposed method was applied in a real case with 115 bank branches. The input variables of the proposed model were personnel costs, current and administrative costs, cost accounts, renting cost and the ratio of non-current to total receivables. The output variables of the proposed model were sum of deposits, loans, securities and branch income (Hajiagha, Hashemi, Mahdiraji and Azaddel, 2015). Robust methods, clustering analysis and data envelopment analysis were integrated for identifying bank branch managerial clusters and for finding efficiency values (Herrera-Restrepo, Triantisa, Seaver, Paradi and Zhu, 2016). Nonparametric input-oriented data envelopment analysis model was used for measuring bank efficiency. 75 countries were categorized from the viewpoint of economic development and geographic region. Data were collected from the International Monetary Fund and the European Bank for Reconstruction and Development. Customer deposits and short-term funding; total costs and equity capital were chosen as the input variables. Loans, other earning assets and noninterest income were chosen as the output variables in the study (Ayadi, Naceur, Casu and Quinn, 2015). Even though Data Envelopment Analysis (DEA) was developed in 1978, as it can be seen from above studies, it is still an important part of the literature and many different models are still being presented. In the following section, a more detailed description of DEA, a mathematical model and its applications on Turkish banks will be explained. DATA ENVELOPMENT ANALYSIS Data Envelopment Analysis (DEA) has been used in evaluating and measuring the performances in operations and management sciences. This technique was developed by Charnes, Cooper and Rhodes (1978), extended by Banker, Charnes, Cooper (1984) and is used to measure the efficiency of Decision Making Units (DMU) in many private and public sector organizations such as banks, hospitals, universities and sport teams (Sherman and Zhu, 2006). DEA is an effective method especially where there are varying level of inputs (resources) and outputs (products) (Wei, 2001). In this method, inputs and outputs are being observed and efficiency of the DMUs is being measured by using linear programming 8
Türk Bankacılık Sektörünün Performans Değerlendirmesinde Entropik Ağırlıklarla Veri Zarflama Analizi
techniques. By estimating the proportional change in inputs and outputs, efficiency of every DMU is being calculated (Ji and Lee, 2010). DEA is also an alternative way of identifying ineffective practices in some of the most profitable organizations (Cooper, Seiford, and Zhu, 2004). After DEA was introduced, many empirical works were implemented and many studies were published in order to gain insights about the efficiency of the production and service firms from managerial point of view. The very first step; when using DEA in the evaluation of DMUs is to decide on which inputs and outputs are relevant (Molinero and Woracker, 1996). In our case, our basis for choosing ‘All Deposit Banks’ is to be able to use the relevant inputs and outputs when performing our evaluation. By using standardized DMUs (All Deposit Banks) - bank for the development of industry was removed, since it affects the homogeneity negatively – it was tried to minimize the possible inconsistencies in our analysis. When using DEA for performance analysis, efficiency scores are being assigned for every unit. Inefficient units get a score of less than one, where efficient units get one. Getting a score of less than one means that, the combination of other units could give us the same outputs by using fewer inputs. This efficiency score also shows the distance between the effective and ineffective units (Andersen and Petersen, 1993). Several models have been developed over time for data envelopment analysis. Commonly used models are CCR model and BCC model (Yıldırım et al., 2015, 209; Banker et al., 1984). In this study, BCC model was used as it was used widely. In the BCC model, there is a convexity limitation which is the sum of lambda values is equal to 1 unlike the CCR model (Yıldırım et al., 2015, 215). Data envelopment analysis model aims at calculating efficiency values for decision making units by utilizing from linear programming. (Costa, Lopes and Matos2015: 49; Yılmaz, Özdil and Akdoğan, 2002: 177; Banker et al., 1984, 1084). The symbols which are used for constructing linear programming model have been explained as follows respectively. 𝑗: 𝑑𝑒𝑐𝑖𝑠𝑖𝑜𝑛 𝑚𝑎𝑘𝑖𝑛𝑔 𝑢𝑛𝑖𝑡, 𝑗 = 1,2,3, … , 𝐽 𝑖: 𝑖𝑛𝑝𝑢𝑡 𝑓𝑎𝑐𝑡𝑜𝑟, 𝑖 = 1,2,3, … , 𝐼 𝑟: 𝑜𝑢𝑡𝑝𝑢𝑡 𝑓𝑎𝑐𝑡𝑜𝑟, 𝑟 = 1,2,3, … , 𝑅 𝑘: 𝑑𝑒𝑐𝑖𝑠𝑖𝑜𝑛 𝑚𝑎𝑘𝑖𝑛𝑔 𝑢𝑛𝑖𝑡, 𝑘 = 1,2,3, … , 𝐾 According to these symbols, 𝐼 shows number of input factor, 𝑅 shows number of output factor, 𝐽 and 𝐾 show number of decision making units. The variables in the model can be explained as follows. 9
Aşkın Özdağoğlu, Enis Yakut ve Sezai Bahar
𝑒𝑗 : 𝑡ℎ𝑒 𝑒𝑓𝑓𝑖𝑐𝑖𝑒𝑛𝑐𝑦 𝑣𝑎𝑙𝑢𝑒 𝑜𝑓 𝑡ℎ𝑒 𝑑𝑒𝑐𝑖𝑠𝑖𝑜𝑛 𝑚𝑎𝑘𝑖𝑛𝑔 𝑢𝑛𝑖𝑡 𝑗 𝑥𝑖𝑘 : 𝑡ℎ𝑒 𝑣𝑎𝑙𝑢𝑒 𝑜𝑓 𝑡ℎ𝑒 𝑑𝑒𝑐𝑖𝑠𝑖𝑜𝑛 𝑚𝑎𝑘𝑖𝑛𝑔 𝑢𝑛𝑖𝑡 𝑘 𝑤𝑖𝑡ℎ 𝑟𝑒𝑠𝑝𝑒𝑐𝑡 𝑡𝑜 𝑡ℎ𝑒 𝑖𝑛𝑝𝑢𝑡 𝑓𝑎𝑐𝑡𝑜𝑟 𝑖 𝑦𝑟𝑘 : 𝑡ℎ𝑒 𝑣𝑎𝑙𝑢𝑒 𝑜𝑓 𝑡ℎ𝑒 𝑑𝑒𝑐𝑖𝑠𝑖𝑜𝑛 𝑚𝑎𝑘𝑖𝑛𝑔 𝑢𝑛𝑖𝑡 𝑘 𝑤𝑖𝑡ℎ 𝑟𝑒𝑠𝑝𝑒𝑐𝑡 𝑡𝑜 , 𝑡ℎ𝑒 𝑜𝑢𝑡𝑝𝑢𝑡 𝑓𝑎𝑐𝑡𝑜𝑟 𝑟 𝜆𝑘 : 𝑡ℎ𝑒 𝑤𝑒𝑖𝑔ℎ𝑡 𝑜𝑓 𝑡ℎ𝑒 𝑑𝑒𝑐𝑖𝑠𝑖𝑜𝑛 𝑚𝑎𝑘𝑖𝑛𝑔 𝑢𝑛𝑖𝑡 𝑘 𝑖𝑛 𝑡ℎ𝑒 𝑑𝑎𝑡𝑎 𝑒𝑛𝑣𝑒𝑙𝑜𝑝𝑚𝑒𝑛𝑡 𝑎𝑛𝑎𝑙𝑦𝑠𝑖𝑠 𝑚𝑜𝑑𝑒𝑙 The objective function for the linear programming model which depends upon these variables can be defined as in Equation 1. 𝑧𝑚𝑖𝑛(𝑗) = 𝑒𝑗 (1) The output constraints which affect every decision making unit can be written as in Equation 2. ∑𝐾 (2) 𝑘=1 𝜆𝑘 𝑦𝑟𝑘 ≥ 𝑦𝑟𝑗 , ∀ 𝑟 = 1,2,3, … , 𝑅 The input constraints which affect every decision making unit can be defined as in Equation 3. ∑𝐾 (3) 𝑘=1 𝜆𝑘 𝑥𝑖𝑘 ≥ 𝑒𝑗 𝑥𝑖𝑗 , ∀ 𝑖 = 1,2,3, … , 𝐼 Convexity constraint of the model can be defined as in Equation 4. ∑𝐾 (4) 𝑘=1 𝜆𝑘 = 1 The non-negativity constraint should be written at the last step of the linear programming model. The non-negativity constraint with respect to the weights of the decision making units has been explained in Equation 5. 𝜆𝑘 ≥ 0, ∀ 𝑘 = 1,2,3, … , 𝐾 (5) The non-negativity constraint with respect to the efficiency values of the firms can be defined as in Equation 6. 𝑒𝑗 ≥ 0 (6) Both 𝑗 and 𝑘 symbols have been used for exhibiting the decision making unit. The reason is to need 𝐽 different linear programming models.(∀ 𝑗 = 1,2,3, … , 𝐽 ) ENTROPY METHOD The Entropy method can be used for finding the weights of the criteria in a multi criteria decision making problem owing to the fact that there is no need to assess for the criteria weights. The decision matrix will be necessary for evaluating the weights of the criteria. The procedure of entropy method can be explained as follows (Erol, 2004: 7-8; Erol and Ferrell, 2009: 1196-1197). 𝑎𝑖 : 𝑎𝑙𝑡𝑒𝑟𝑛𝑎𝑡𝑖𝑣𝑒 𝑖; 𝑖 = 1,2,3, … , 𝑚 𝑐𝑗 : 𝑐𝑟𝑖𝑡𝑒𝑟𝑖𝑜𝑛 𝑗; 𝑗 = 1,2,3, … , 𝑛 10
Türk Bankacılık Sektörünün Performans Değerlendirmesinde Entropik Ağırlıklarla Veri Zarflama Analizi
𝑥𝑖𝑗 : 𝑝𝑒𝑟𝑓𝑜𝑟𝑚𝑎𝑛𝑐𝑒 𝑣𝑎𝑙𝑢𝑒 𝑜𝑓 𝑡ℎ𝑒 𝑎𝑙𝑡𝑒𝑟𝑛𝑎𝑡𝑖𝑣𝑒 𝑖 𝑓𝑟𝑜𝑚 𝑡ℎ𝑒 𝑣𝑖𝑒𝑤𝑝𝑜𝑖𝑛𝑡 𝑜𝑓 𝑐𝑟𝑖𝑡𝑒𝑟𝑖𝑜𝑛 𝑗 𝐷: 𝑡ℎ𝑒 𝑑𝑒𝑐𝑖𝑠𝑖𝑜𝑛 𝑚𝑎𝑡𝑟𝑖𝑥 The decision matrix values are the input factors of the decision making units in the study. Alternatives are decision making units. Criteria are the input factors. The decision matrix can be constructed as in Equation 7. 𝑥11 𝑥12 … 𝑥1𝑛 𝑥21 𝑥22 … 𝑥2𝑛 𝐷=[ … (7) … … … ] 𝑥𝑚1 𝑥𝑚2 … 𝑥𝑚𝑛 𝑝𝑖𝑗 : 𝑛𝑜𝑟𝑚𝑎𝑙𝑖𝑧𝑒𝑑 𝑝𝑒𝑟𝑓𝑜𝑟𝑚𝑎𝑛𝑐𝑒 𝑣𝑎𝑙𝑢𝑒 𝑜𝑓 𝑡ℎ𝑒 𝑎𝑙𝑡𝑒𝑟𝑛𝑎𝑡𝑖𝑣𝑒 𝑖 𝑓𝑟𝑜𝑚 𝑡ℎ𝑒 𝑣𝑖𝑒𝑤𝑝𝑜𝑖𝑛𝑡 𝑜𝑓 𝑐𝑟𝑖𝑡𝑒𝑟𝑖𝑜𝑛 𝑗 The decision matrix is used for finding the normalized performance values. The normalized performance values can be calculated as in Equation 8. 𝑥𝑖𝑗
𝑝𝑖𝑗 = ∑𝑚
𝑖=1 𝑥𝑖𝑗
(8)
∀ 𝑖, 𝑗
𝑁𝐷: 𝑡ℎ𝑒 𝑛𝑜𝑟𝑚𝑎𝑙𝑖𝑧𝑒𝑑 𝑑𝑒𝑐𝑖𝑠𝑖𝑜𝑛 𝑚𝑎𝑡𝑟𝑖𝑥 The normalized performance values construct the normalized decision matrix. The normalized decision matrix can be constructed as in Equation 9. 𝑝11 𝑝12 … 𝑝1𝑛 𝑝21 𝑝22 … 𝑝2𝑛 𝑁𝐷 = [ … (9) … … … ] 𝑝𝑚1 𝑝𝑚2 … 𝑝𝑚𝑛 𝐸𝑗 : 𝑒𝑛𝑡𝑟𝑜𝑝𝑦 𝑣𝑎𝑙𝑢𝑒 𝑓𝑜𝑟 𝑐𝑟𝑖𝑡𝑒𝑟𝑖𝑜𝑛 𝑗; 𝑗 = 1,2,3, … , 𝑛 𝑘: 𝑐𝑜𝑛𝑠𝑡𝑎𝑛𝑡 Entropy values can be calculated as in Equation 10 by using the normalized decision matrix. 𝐸𝑗 = −𝑘 ∑𝑚 𝑖=1 [(𝑝𝑖𝑗 ) (𝑙𝑛(𝑝𝑖𝑗 ))] ∀ 𝑗
(10)
The number of the decision making units is used for finding the constant value. The constant value in the method can be calculated as in Equation 11. 𝑘=
1
(11)
𝑙𝑛(𝑚)
𝑑𝑗 : 𝑡ℎ𝑒 𝑑𝑒𝑔𝑟𝑒𝑒 𝑜𝑓 𝑑𝑖𝑣𝑒𝑟𝑠𝑖𝑓𝑖𝑐𝑎𝑡𝑖𝑜𝑛 𝑓𝑜𝑟 𝑐𝑟𝑖𝑡𝑒𝑟𝑖𝑜𝑛 𝑗; 𝑗 = 1,2,3, … , 𝑛 Entropy values are used for finding the degrees of diversification for each input factors. The degree of diversification can be calculated as in Equation 12. 11
Aşkın Özdağoğlu, Enis Yakut ve Sezai Bahar
(12)
𝑑𝑗 = 1 − 𝐸𝑗 𝑤𝑗 : 𝑡ℎ𝑒 𝑤𝑒𝑖𝑔ℎ𝑡 𝑣𝑎𝑙𝑢𝑒 𝑜𝑓 𝑐𝑟𝑖𝑡𝑒𝑟𝑖𝑜𝑛 𝑗; 𝑗 = 1,2,3, … , 𝑛
The degree of diversification is used for the weight value of the input factor. The weight values can be calculated as in Equation 13. 𝑑𝑗
(13)
𝑤𝑗 = ∑𝑛
𝑗=1 𝑑𝑗
APPLICATION In this study, the efficiency values of all deposit banks in Turkey, officially announced balance sheets and income statements have been reviewed for comparative evaluation. For the analysis, 2015 annual values of the banks have been collected. The input data is obtained through the 2015 statistical report of the Banks Association of Turkey and and Data Query System on the Bank Association of Turkey website (Türkiye Bankalar Birliği, 2017). Then, the main input and output elements have been determined. There have been four input items in the study. The input items are the number of branches, number of personnel, interest expenses and provision for loan losses and other receivables. There have been two output items in the study. The output items from the balance sheets is financial assets available for sale and interest income. Within the constraint precision: 0,01, iteration number: 100 and maximum time: 100 second limits, various combinations are tested in view of the significant impact on the separation power of the model's active and non-active ones and satisfactory results have been achieved in the mentioned combination of input and output. There have been thirty-four decision making units in the study. The input values of the decision making units can be seen in Table 1. Table 1: Input Values of the Decision Making Units Input 1
Input 2
Input 3
Number of Branches
Number of Personnel
Interest Expenses (million TL)
Input 4 Provision for Loan Losses and Other Receivables () (million TL)
Bank 1
1
30
0,19
0,01
Bank 2
902
14.050
7.909,94
2.322,20
Bank 3
59
1.073
559,42
207,97
Bank 4
106
1.711
539,33
93,67
Bank 5
7
291
30,06
8,33
Bank 6
3
48
0,42
0,29
12
Türk Bankacılık Sektörünün Performans Değerlendirmesinde Entropik Ağırlıklarla Veri Zarflama Analizi
Bank 7
Input 1
Input 2
Input 3
Number of Branches
Number of Personnel
Interest Expenses (million TL)
1
Input 4 Provision for Loan Losses and Other Receivables () (million TL)
63
18,10
7,80
Bank 8
1
225
113,47
20,89
Bank 9
56
1.022
526,29
86,64
Bank 10
8
517
294,44
11,60
Bank 11
692
12.923
3.650,77
1.217,58
Bank 12
1
123
63,93
0,33
Bank 13
67
1.290
494,21
102,82
Bank 14
642
12.950
3.650,14
1.170,11
Bank 15
1
15
0,75
0,21
Bank 16
284
4.997
1.278,17
700,92
Bank 17
44
841
171,66
46,67
Bank 18
298
5.603
1.699,90
573,58
Bank 19
1
27
13,73
25,28
Bank 20
1
56
5,62
1,26
Bank 21
55
1.538
1.376,09
258,64
Bank 22
1
38
0,52
1,30
Bank 23
1
110
17,73
16,39
Bank 24
301
4.078
1.226,92
431,13
Bank 25
1
57
13,54
0,29
Bank 26
13
252
49,34
4,36
Bank 27
34
662
326,41
50,18
Bank 28
532
9.927
3.145,29
923,52
Bank 29
1.812
25.697
11.541,57
1.420,55
Bank 30
980
19.692
8.178,67
2.218,19
Bank 31
949
17.104
7.994,10
1.301,88
Bank 32
1.377
25.157
10.214,81
2.058,18
Bank 33
920
15.410
8.143,57
1.537,06
Bank 34
1.000
18.261
8.450,24
2.521,50
Source: https://www.tbb.org.tr/tr/bankacilik/banka-ve-sektor-bilgileri/veri-sorgulamasistemi/mali-tablolar/71 , Download Date: 27 March 2017; https://www.tbb.org.tr/en/banksand-banking-sector-information/statistical-reports/20 , Download Date: 27 March 2017
13
Aşkın Özdağoğlu, Enis Yakut ve Sezai Bahar
The output values of the decision making units can be seen in Table 2. Table 2: Output Values of the Decision Making Units Output 1 Financial Assets Available for Sale (net) (million TL)
Output 2 Interest Incomes (million TL)
Bank 1
0,00
6,04
Bank 2
41.459,71
15.247,39
Bank 3
815,94
1.071,06
Bank 4
1.267,21
959,21
Bank 5
1,39
137,84
Bank 6
152,22
19,95
Bank 7
0,00
128,86
Bank 8
0,00
189,74
Bank 9
649,51
845,78
Bank 10
1.007,58
738,39
Bank 11
8.524,48
6.804,78
Bank 12
0,00
187,77
Bank 13
613,77
891,48
Bank 14
5.295,49
7.597,38
Bank 15
5,99
7,42
Bank 16
654,12
2.402,38
Bank 17
1.084,48
343,67
Bank 18
3.082,46
3.726,15
Bank 19
0,00
116,31
Bank 20
0,00
56,42
Bank 21
1.097,18
2.352,47
Bank 22
535,80
68,76
Bank 23
0,00
90,88
Bank 24
1.723,77
2.283,31
Bank 25
166,33
191,68
Bank 26
64,14
98,38
Bank 27
669,36
510,21
Bank 28
4.128,55
6.219,45
Bank 29
53.782,31
22.050,50
Bank 30
20.519,80
17.420,01
Bank 31
11.208,99
13.656,91
14
Türk Bankacılık Sektörünün Performans Değerlendirmesinde Entropik Ağırlıklarla Veri Zarflama Analizi
Output 1 Financial Assets Available for Sale (net) (million TL)
Output 2 Interest Incomes (million TL)
Bank 32
40.860,36
19.200,36
Bank 33
16.773,97
13.630,05
Bank 34
22.748,43
15.292,46
Source: https://www.tbb.org.tr/tr/bankacilik/banka-ve-sektor-bilgileri/veri-sorgulamasistemi/mali-tablolar/71 , Download Date: 27 March 2017
In the first phase of the study, DEA model has been constructed without weights. Thirty-four different linear programming models have been constructed for finding the efficiency values of the deposit banks after compilation of the input and the output values. The first linear programming model for finding the efficiency value of Bank 1 has been written as an example. First of all, the objective function of the linear programming model must be defined. 𝑧min(1) = 𝑒1 After defining the objective function of the linear programming model, input constraints can be constructed as follows. The constraint for the first input factor which is the number of branches is as indicated below. 1𝜆1 + 902𝜆2 + 59𝜆3 + ⋯ + 1377𝜆32 + 920𝜆33 + 1000𝜆34 − 1𝑒1 ≤ 0 The constraint for the second input factor which is the number of personnel has been written as follows. 30𝜆1 + 14050𝜆2 + 1073𝜆3 + ⋯ + 25157𝜆32 + 15410𝜆33 + 18261𝜆34 − 30𝑒1 ≤0 The constraint for the third input factor which is the interest expenses has been written as follows. 0,19𝜆1 + 7909,94𝜆2 + 559,42𝜆3 + ⋯ + 10214,81𝜆32 + 8143,57𝜆33 + 8450,24𝜆34 − 0,19𝑒1 ≤ 0 The constraint for the last input factor which is the provision for loan losses and other receivables has been written as follows. 0,01𝜆1 + 2322,20𝜆2 + 207,97𝜆3 + ⋯ + 2058,18𝜆32 + 1537,06𝜆33 + 2521,50𝜆34 − 0,01𝑒1 ≤ 0 The output constraints must be constructed after the input constraints for the linear programming model. The first output constraint for the financial assets available for sale has been written as follows. 0,00𝜆1 + 41459,71𝜆2 + 815,94𝜆3 + ⋯ + 40860,36𝜆32 + 16773,97𝜆33 + 22748,43𝜆34 ≥ 0,00 15
Aşkın Özdağoğlu, Enis Yakut ve Sezai Bahar
The second output constraint for the interest income has been written as follows. 6,04𝜆1 + 15247,39𝜆2 + 1071,06𝜆3 + ⋯ + 19200,36𝜆32 + 13630,05𝜆33 + 15292,46𝜆34 ≥ 6,04 Sum of the weights of the decision making units must be equal to 1 in this linear programming model. The constraint about the sum of the weights of the decision making units has been written as follows. 𝜆1 + 𝜆2 + 𝜆3 + ⋯ + 𝜆32 + 𝜆33 + 𝜆34 = 1 Non-negativity constraint must be written at the last phase of the linear programming model. The non-negativity constraint with respect to the weights of the decision making units has been pointed out below. 𝜆𝑘 ≥ 0, ∀ 𝑘 = 1,2,3, … ,34 The non-negativity constraint with regard to the efficiency values of the banks has been explained as follows. 𝑒1 ≥ 0 The normalized performance values of the inputs have been calculated as in Equation 8. The results can be seen in Table 3. Table 3: The Normalized Performance Values of The Inputs Input 1
Bank 1
Input 2
Input 3
Input 4 Provision for Loan Losses Interest and Other Number of Number of Expenses Receivables (Branches Personnel (million TL) ) (million TL) 0,000090 0,000153 0,000002 0,000001
Bank 2
0,080890
0,071743
0,096818
0,120064
Bank 3
0,005291
0,005479
0,006847
0,010753
Bank 4
0,009506
0,008737
0,006601
0,004843
Bank 5
0,000628
0,001486
0,000368
0,000431
Bank 6
0,000269
0,000245
0,000005
0,000015
Bank 7
0,000090
0,000322
0,000222
0,000403
Bank 8
0,000090
0,001149
0,001389
0,001080
Bank 9
0,005022
0,005219
0,006442
0,004480
Bank 10
0,000717
0,002640
0,003604
0,000600
Bank 11
0,062057
0,065988
0,044685
0,062952
Bank 12
0,000090
0,000628
0,000783
0,000017
Bank 13
0,006008
0,006587
0,006049
0,005316
Bank 14
0,057573
0,066126
0,044678
0,060498
Bank 15
0,000090
0,000077
0,000009
0,000011
16
Türk Bankacılık Sektörünün Performans Değerlendirmesinde Entropik Ağırlıklarla Veri Zarflama Analizi Input 1
Bank 16
Input 2
Input 3
Input 4 Provision for Loan Losses Interest and Other Number of Number of Expenses Receivables (Branches Personnel (million TL) ) (million TL) 0,025469 0,025516 0,015645 0,036239
Bank 17
0,003946
0,004294
0,002101
0,002413
Bank 18
0,026724
0,028610
0,020807
0,029656
Bank 19
0,000090
0,000138
0,000168
0,001307
Bank 20
0,000090
0,000286
0,000069
0,000065
Bank 21
0,004932
0,007853
0,016843
0,013372
Bank 22
0,000090
0,000194
0,000006
0,000067
Bank 23
0,000090
0,000562
0,000217
0,000847
Bank 24
0,026993
0,020823
0,015018
0,022291
Bank 25
0,000090
0,000291
0,000166
0,000015
Bank 26
0,001166
0,001287
0,000604
0,000225
Bank 27
0,003049
0,003380
0,003995
0,002594
Bank 28
0,047709
0,050690
0,038498
0,047749
Bank 29
0,162497
0,131216
0,141269
0,073446
Bank 30
0,087884
0,100552
0,100107
0,114687
Bank 31
0,085104
0,087337
0,097848
0,067311
Bank 32
0,123487
0,128458
0,125029
0,106414
Bank 33
0,082504
0,078687
0,099677
0,079470
Bank 34
0,089678
0,093245
0,103431
0,130368
Natural logarithm transformation of these values can be seen in Table 4. Table 4: The Natural Logarithm Transformation Input 1
Bank 1 Bank 2
Input 2
Input 4 Provision for Loan Losses Interest and Other Number of Number of Expenses Receivables (Branches Personnel (million TL) ) (million TL) -9,319284 -8,783846 -12,971532 -14,475170 -2,514670
-2,634665
17
Input 3
-2,334926
-2,119729
Aşkın Özdağoğlu, Enis Yakut ve Sezai Bahar Input 1
Bank 3
Input 2
Input 3
Input 4 Provision for Loan Losses Interest and Other Number of Number of Expenses Receivables (Branches Personnel (million TL) ) (million TL) -5,241747 -5,206829 -4,983901 -4,532606
Bank 4
-4,655845
-4,740210
-5,020474
-5,330222
Bank 5
-7,373374
-6,511720
-7,907606
-7,750136
Bank 6
-8,220672
-8,313842
-12,178302
-11,107874
Bank 7
-9,319284
-8,041908
-8,414889
-7,815876
Bank 8
-9,319284
-6,768943
-6,579263
-6,830729
Bank 9
-5,293933
-5,255526
-5,044949
-5,408238
Bank 10
-7,239843
-5,937000
-5,625726
-7,418994
Bank 11
-2,779699
-2,718279
-3,108108
-2,765379
Bank 12
-9,319284
-7,372859
-7,153012
-10,978662
Bank 13
-5,114592
-5,022646
-5,107841
-5,237020
Bank 14
-2,854696
-2,716192
-3,108280
-2,805146
Bank 15
-9,319284
-9,476993
-11,598483
-11,430647
Bank 16
-3,670310
-3,668450
-4,157617
-3,317606
Bank 17
-5,535095
-5,450451
-6,165285
-6,026898
Bank 18
-3,622191
-3,553986
-3,872476
-3,518102
Bank 19
-9,319284
-8,889206
-8,691218
-6,639986
Bank 20
-9,319284
-8,159691
-9,584470
-9,638888
Bank 21
-5,311951
-4,846805
-4,083800
-4,314562
Bank 22
-9,319284
-8,547457
-11,964728
-9,607635
Bank 23
-9,319284
-7,484563
-8,435543
-7,073328
Bank 24
-3,612174
-3,871681
-4,198539
-3,803590
Bank 25
-9,319284
-8,141992
-8,705153
-11,107874
Bank 26
-6,754335
-6,655614
-7,412066
-8,397527
Bank 27
-5,792924
-5,689778
-5,522647
-5,954383
Bank 28
-3,042641
-2,982029
-3,257140
-3,041807
Bank 29
-1,817098
-2,030914
-1,957091
-2,611200
Bank 30
-2,431732
-2,297075
-2,301516
-2,165553
Bank 31
-2,463876
-2,437975
-2,324342
-2,698435
Bank 32
-2,091622
-2,052152
-2,079207
-2,240422
Bank 33
-2,494911
-2,542271
-2,305817
-2,532373
Bank 34
-2,411529
-2,372520
-2,268851
-2,037390
18
Türk Bankacılık Sektörünün Performans Değerlendirmesinde Entropik Ağırlıklarla Veri Zarflama Analizi
Entropy values have been calculated as in Equation 10. The degree of diversification has been calculated as in Equation 12. The weight values have been calculated as in Equation 13. All these results can be seen in Table 5 respectively. Table 5: Entropy Values, the Degree of Diversification and Weight Values Input 1
Input 4 Provision for Loan Losses and Other Interest Receivables Number of Number of Expenses (-) (million Branches Personnel (million TL) TL) 0,736040 0,750438 0,731932 0,746107
Entropy value The degree of diversification The weight value
Input 2
Input 3
0,263960
0,249562
0,268068
0,253893
0,254914
0,241011
0,258882
0,245193
Since the weights of the input and output of the model have different effects on the company performance, the weights were calculated with the entropy method and these weights were multiplied by the original data in the model and new coefficients are found to be used in linear programming models. The efficiency values of the banks have been found without weights and with entropic weights in DEA model. For entropy and DEA integration entropic weights and input values of the DMU’s must be multiplied. New input values of the DMU’s can be seen in Table 6. Table 6: New Input Values of the DMU’s According to Entropic Weights Input 1
Input 2
Input 3
Number of Branches
Number of Personnel
Interest Expenses (million TL)
Input 4 Provision for Loan Losses and Other Receivables () (million TL)
Bank 1
0,254914
7,230323
0,049188
0,002452
Bank 2
229,932862
3386,201411
2047,742692
569,386114
19
Aşkın Özdağoğlu, Enis Yakut ve Sezai Bahar Input 1
Input 2
Input 3
Number of Branches
Number of Personnel
Interest Expenses (million TL)
Input 4 Provision for Loan Losses and Other Receivables () (million TL)
Bank 3
15,039954
258,604563
144,823882
50,992692
Bank 4
27,020935
412,369439
139,622939
22,967185
Bank 5
1,784401
70,134136
7,781999
2,042454
Bank 6
0,764743
11,568517
0,108731
0,071106
Bank 7
0,254914
15,183679
4,685768
1,912502
Bank 8
0,254914
54,227425
29,375364
5,122072
Bank 9
14,275211
246,313014
136,247115
21,243482
Bank 10
2,039316
124,602572
76,225276
2,844233
Bank 11
176,400821
3114,582266
945,119380
298,541532
Bank 12
0,254914
29,644326
16,550339
0,080914
Bank 13
17,079270
310,903902
127,942174
25,210697
Bank 14
163,655097
3121,089557
944,956284
286,902242
Bank 15
0,254914
3,615162
0,194162
0,051490
Bank 16
72,395713
1204,330851
330,895465
171,860355
Bank 17
11,216237
202,690063
44,439719
11,443136
Bank 18
75,964515
1350,383381
440,073857
140,637537
Bank 19
0,254914
6,507291
3,554453
6,198467
Bank 20
0,254914
13,496603
1,454918
0,308943
Bank 21
14,020296
370,674574
356,245211
63,416598
Bank 22
0,254914
9,158410
0,134619
0,318750
Bank 23
0,254914
26,511185
4,589981
4,018706
Bank 24
76,729259
982,841947
317,627752
105,709859
Bank 25
0,254914
13,737614
3,505265
0,071106
Bank 26
3,313888
60,734716
12,773248
1,069039
Bank 27
8,667092
159,549134
84,501740
12,303762
Bank 28
135,614504
2392,513979
814,259604
226,440214
Bank 29
461,905040
6193,253926
2987,907067
348,308261
Bank 30
249,816192
4745,984213
2117,312107
543,883638
Bank 31
241,913843
4122,248323
2069,530219
319,211263
Bank 32
351,017241
6063,108107
2644,432515
504,650380
Bank 33
234,521323
3713,976067
2108,225341
376,875644
Bank 34
254,914481
4401,097791
2187,616747
618,252987
20
Türk Bankacılık Sektörünün Performans Değerlendirmesinde Entropik Ağırlıklarla Veri Zarflama Analizi
Efficiency values of all deposit banks in Turkey have been calculated again with these new coefficients. The results can be compared in Table 7. Table 7: The Efficiency Values of the Banks with and without Entropic Weights Efficiency Value without Entropic Weights
Efficiency Value with Entropic Weights
Bank 1
1,000000
1,000000
Bank 2
1,000000
1,000000
Bank 3
0,817133
0,817133
Bank 4
0,725636
0,725636
Bank 5
0,260716
0,260716
Bank 6
1,000000
1,000000
Bank 7
1,000000
1,000000
Bank 8
1,000000
1,000000
Bank 9
0,649877
0,649877
Bank 10
1,000000
1,000000
Bank 11
0,867046
0,867046
Bank 12
1,000000
1,000000
Bank 13
0,711358
0,711358
Bank 14
0,965270
0,965270
Bank 15
1,000000
1,000000
Bank 16
0,830305
0,830305
Bank 17
0,760065
0,760065
Bank 18
1,000000
0,993384
Bank 19
1,000000
1,000000
Bank 20
1,000000
1,000000
Bank 21
1,000000
1,000000
Bank 22
1,000000
1,000000
Bank 23
1,000000
1,000000
Bank 24
0,818993
0,818993
Bank 25
1,000000
1,000000
Bank 26
0,142110
0,142110
Bank 27
0,533740
0,533740
Bank 28
0,912577
0,912577
21
Aşkın Özdağoğlu, Enis Yakut ve Sezai Bahar
Table 7: The Efficiency Values of the Banks with and without Entropic Weights Efficiency Value without Entropic Weights
Efficiency Value with Entropic Weights
Bank 29
1,000000
1,000000
Bank 30
1,000000
1,000000
Bank 31
0,977391
0,977391
Bank 32
0,990876
0,990876
Bank 33
0,956550
0,956550
Bank 34
0,903311
0,903311
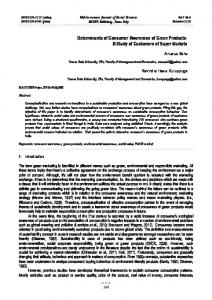
In order to test whether entropic weights make a meaningful difference or not, nonparametric test was employed as the number of data is few, and the results were not noticeably different, and also statistically, this difference was not significant. (p=0,317). The results are given in Figure 1.
Figure 1: Non-Parametric Test Results Having an efficiency value of ‘1’ means that, service unit (the bank) is operating efficiently. On the contrary, efficiency values closer to ‘0’ indicate the inefficiency of the service units. After reviewing the Table 7, we see that introducing the entropic weights didn’t affect the efficiency scores of the banks, and efficiency values remained the same with the exception of Bank 18 (1 without entropic weights; 0,993384 with entropic weights). Even though entropic weights were expected to change the efficiency values, approximately same entropic weights eliminated the effect of entropic weights. Using another data set could have demonstrate the effect of entropic weights. According to Table 7, Bank 26 has the lowest efficiency score which is 0,142110. The reason for having the lowest score is, Bank 26’s inefficient use of its resources. When we compare the input and output values of Bank 26 with Bank 23 in Table 1 and Table 2, we see that they have very close interest income but Bank 23 has less employees (fifty five percent) 22
Türk Bankacılık Sektörünün Performans Değerlendirmesinde Entropik Ağırlıklarla Veri Zarflama Analizi
and less interest expenses (sixty percent) than Bank 26 and generates the interest income in one branch (compared to 13 branches of Bank 26). Another comparison can be made with Bank 10 which has half the number of branches of Bank 26, but we see that it operates efficiently as a result of having more financial assets available for sale (fifteen times) and more interest income (seven times). Bank 5 has also a low efficiency score (0, 260716), but its interest income is more than Bank 26, with less interest expenses and half number of branches. In our study, Bank 1, Bank 2, Bank 6, Bank 7, Bank 8, Bank 10, Bank 12, Bank 15, Bank 19, Bank 20, Bank 21, Bank 22, Bank 23, Bank 25, Bank 29 and Bank 30 all have efficiency values of 1. On the other hand, when we examine the input values of the decision making units on Table 1, we see that Bank 1 and Bank 15 have got very limited resources, but according to our results, it operates efficiently. At first, this result may sound unreasonable, but after examining the input values on Table 1, it can be seen that input values of both Bank 1 and Bank 15 are very low compared to other banks. For the Bank 29 and Bank 32, the input values can be considered high, but both banks’ interest incomes and financial assets available for sale are also higher than other banks correspondingly. CONCLUSION Today’s harsh competitive environment is one of the biggest issues for the organizations, especially for the financial sector. Using the resources in an efficient way is the key factor for the organizations’ longterm productivity and for the national economy. For all the stakeholders and interested parties, such as investors, clients and bank owners; measuring the banking efficiency is an important aspect. On the other hand, in order to monitor the operating performance of the banks, the developments in the banking sector and the impact of globalization in finance sector require various analyses regularly at certain intervals. It is necessary for the organizations to measure how the resources are allocated efficiently with the results obtained in a certain period of time. Accordingly, Data Envelopment Analysis (DEA) is a linear programming model which is used to measure the relative performance of the firms. Data Envelopment Analysis (DEA) is one of the most proper methods to measure the performance of the organizations. With the assistance of this method, organizations can evaluate their efficiency level and take necessary precautions on the factors which obstruct the efficiency level. 23
Aşkın Özdağoğlu, Enis Yakut ve Sezai Bahar
On this process, organizations try to find ways to decrease the costs and increase their organizational quality for being in the market on the long term. Implementing Data Envelopment Analysis (DEA) method necessitate that organizations have similar or same input – output structure to achieve the goals of their decision making units, by doing so they will compete in similar economical environmental conditions. These similar economical environmental conditions will assist organizations in the comparison of their operating process. On the other hand, another important aspect of the evaluation process is the assessing the importance levels-weights- of the input values. Since there are more than one evaluating objects, in our case input values, the weighted values of every single input value should be calculated and introduced into the model. To solve this problem, we used entropy method, and recalculated efficiency scores with entropic weights. As a result of this, the efficiency scores of the banks calculated again because the resources were allocated to different input values. After using entropy method, the importance level of every input value did not cause to a change in the efficiency scores. In this study, findings are obtained from 34 Turkish deposit banks. By using Data Envelopment Analysis (DEA) method, 34 banks are compared in terms of their number of branches, number of personnel, interest expenses and provision for loan losses and other receivables, financial assets available for sale and interest incomes; and efficiency levels of the banks are identified via analysis results. It is clearly seen that few banks operate more efficiently although they have less input factors. Therefore, it reveals that some banks are less efficient compared to the efficient ones which show extra performance to obtain optimum output values. When the findings are interpreted, the relative efficiency of banks reveal by comparing inputs and outputs of each banks. In the future studies, more input and output values and decision making units can be added which will provide different perspectives to the study, and different assessments can be reached with the new findings.
REFERENCES Andersen, P. and Petersen, N. C. (1993). A procedure for ranking efficient units in data envelopment analysis, Management science, 39(10), 1261-1264. 24
Türk Bankacılık Sektörünün Performans Değerlendirmesinde Entropik Ağırlıklarla Veri Zarflama Analizi
Asmilda, M. and Zhub, M. (2016). Controlling for the use of extreme weights in bank efficiency assessments during the financial crisis, European Journal of Operational Research, 251(3), 999-1015. Atan, M. and Karpat, G. (2005). Bankacılıkta Etkinlik Ve Sermaye Yapısının Bankaların Etkinligine Etkisi, VII.Ulusal Ekonometri ve İstatistik Sempozyumu, 27-28 Mayıs, İnönü Üniversitesi, Malatya. Avkıran, N.K. (2015). An illustration of dynamic network DEA in commercial banking including robustness tests, Omega, 55, 141-150. Ayadi, R., Naceur, S.B., Casu, B. and Quinn, B. (2015). Does Basel Compliance Matter for Bank Performance? Journal of Financial Stability, 23, 15-32. Banker, R.D. Charnes, A. and Cooper, W.W. (1984). Some Models for Estimating Technical and Scale Inefficiencies in Data Envelopment Analysis, Management Science, 30(9), 1078-1092. Barra, C., Destefanis, S. and Lavadera, G.L. (2016). Risk and Regulation: A Difference-in-Differences Analysis for Italian Local Banks, Finance Research Letters, 17, 25-32. Belanès, A., Ftiti, Z. and Regaïeg, R. (2015). What can we learn about Islamic banks efficiency under the subprime crisis? Evidence from GCC Region, Pacific-Basin Finance Journal, 33, 81-92. Bod’a, M. and Zimková, E. (2015). How non-radiality matters – ParetoKoopmans technical efficiency in production of branches of a Slovak commercial bank, Procedia Economics and Finance, 30, 100-110. Chan, S-G., Koh, E. H.Y., Zainir, F. and Yong, C-C. (2015). Market structure, institutional framework and bank efficiency in ASEAN 5. Journal of Economics and Business, 82, 84-112. Cooper, W.W., Seiford, L.M., and Zhu, J. (2004). Data envelopment analysis, In Handbook on data envelopment analysis, Springer US, 1-39. Costa, M.A., Lopes, A.L.M. and Matos, G.B.B.P. (2015). Statistical evaluation of Data Envelopment Analysis versus COLS CobbeDouglas benchmarking models for the 2011 Brazilian tariff revision. Socio-Economic Planning Sciences, 49, 47-60. Dotoli, M. Epicoco, N., Falagario, M. and Sciancalepore, F. (2015). A CrossEfficiency Fuzzy Data Envelopment Analysis Technique For Performance Evaluation of Decision Making Units Under Uncertainty. Computers and Industrial Engineering, 79, 103-114.
25
Aşkın Özdağoğlu, Enis Yakut ve Sezai Bahar
Du, K. and Sim, N., (2016). Mergers, acquisitions, and bank efficiency: Cross-country evidence from emerging markets. Research in International Business and Finance, 36, 499-510. Erol, İ. (2004), Toplam Kalite Yönetimi ve Tam Zamanında Üretim Yaklaşımlarının Satınalma İşlevi ile İlişkilendirilmesi, Bütünsel Bir Yaklaşım Önerisi ve Örnek Olay Analizi. Endüstri Mühendisliği Dergisi, 15(4), 2-18. Erol, İ. and Ferrell Jr., W.G. (2009). Integrated approach for reorganizing purchasing: Theory and a case analysis on a Turkish company. Computers and Industrial Engineering, 56, 1192-1204. Hajiagha, S.H.R., Hashemi, S.S., Mahdiraji, H.A. and Azaddel, J. (2015). Multi-period data envelopment analysis based on Chebyshev inequality bounds. Expert Systems with Applications, 42, 7759-7767. Herrera-Restrepo, O., Triantisa, K., Seaver, W.L., Paradi, J.C. and Zhu, H. (2016). Bank branch operational performance: A robust multivariate and clustering approach. Expert Systems with Applications, 50, 107119. Huang, C., Dai, C. and Guo, M. (2015). A hybrid approach using two-level DEA for financial failure prediction and integrated SE-DEA and GCA for indicators selection, Applied Mathematics and Computation, 251, 431–441. Ji, Y. B. and Lee, C. (2010). Data envelopment analysis. The Stata Journal, 10(2), 267-280. Kaur, S. and Gupta, P.K. (2015). Productive efficiency mapping of the Indian banking system using data envelopment analysis. Procedia Economics and Finance, 25, 227-238. Kwon, H-B. and Lee, J. (2015). Two-stage production modeling of large U.S. banks: A DEA-neural network approach. Expert Systems with Applications, 42, 6758-6766. Kyritsis, C., Rekleitis, P. and Trivelas, P. (2015). Simulation for the stability and DEA risk analysis of Greek banks within a prolonged duration of the debt crisis. Procedia Economics and Finance, 33, 376-387. Molinero, C.M. and Woracker, D. (1996). Data Envelopment Analysis. OR Insight, 9(4), 22-28. Moradi-Motlagh, A. and Babacan, A. (2015). The impact of the global financial crisis on the efficiency of Australian banks. Economic Modelling, 46, 397-406. Ohsato, S. and Takahashi, M. (2015). Management Efficiency in Japanese Regional Banks: A Network DEA. Procedia - Social and Behavioral Sciences, 172, 511-518. 26
Türk Bankacılık Sektörünün Performans Değerlendirmesinde Entropik Ağırlıklarla Veri Zarflama Analizi
Puri, J. and Yadav, S.P. (2015). Intuitionistic fuzzy data envelopment analysis: An application to the banking sector in India. Expert Systems with Applications, 42, 4982-4998. Řepková, I. (2015). Banking Efficiency Determinants in the Czech Banking Sector. Procedia Economics and Finance, 23, 191-196. Sherman, H.D. and Zhu, J. (2006). Service Productivity Management: Improving Service Performance using Data Envelopment Analysis (DEA). US: Springer. 1st ed. Stoica, O., Mehdian, S. and Sargua, A. (2015). The impact of internet banking on the performance of Romanian banks: DEA and PCA approach. Procedia Economics and Finance, 20, 610-622. Tsolas, I. E. and Charles, V. (2015). Incorporating risk into bank efficiency: A satisficing DEA approach to assess the Greek banking crisis. Expert Systems with Applications, 42, 3491-3500. Türkiye Bankalar Birliği (2017). https://www.tbb.org.tr/en/banks-andbanking-sector-information/statistical-reports/20 (27 March 2017) Türkiye Bankalar Birliği (2017). https://www.tbb.org.tr/tr/bankacilik/ banka-ve-sektor-bilgileri/veri-sorgulama-sistemi/mali-tablolar/71 (27 March 2017) Ulaş, E. and Keskin, B. (2015). Performance evaluation and ranking of Turkish banking sector. Procedia Economics and Finance, 25, 297307. Wanke, P., Barros, C.P. and Emrouznejad, A. (2016). Assessing productive efficiency of banks using integrated Fuzzy-DEA and bootstrapping: A case of Mozambican banks. European Journal of Operational Research, 249, 378-389. Wei, Q. (2001). Data envelopment analysis, Chinese Science Bulletin, 46(16), 1321-1332. Widiarto, I. and Emrouznejad, A. (2015). Social and financial efficiency of Islamic microfinance institutions: A Data Envelopment Analysis application. Socio-Economic Planning Sciences, 50, 1-17. Wijesiri, M. and Meoli, M. (2015). Productivity change of microfinance institutions in Kenya: A bootstrap Malmquist approach. Journal of Retailing and Consumer Services, 25, 115-121. Wijesiri, M., Viganò, L. and Meoli, M. (2015). Efficiency of microfinance institutions in Sri Lanka: a two-stage double bootstrap DEA approach. Economic Modelling, 47, 74–83.
27
Aşkın Özdağoğlu, Enis Yakut ve Sezai Bahar
Wild, J. (2016). Efficiency and risk convergence of Eurozone financial markets. Research in International Business and Finance, 36, 196211. Wu, Y-C., Ting, I., Wei, K., Lu, W-M., Nourani, M. and Kweh, Q. L. (2016). The impact of earnings management on the performance of ASEAN banks. Economic Modelling, 53, 156-165. Yıldırım, Bahattin Fatih, Önder, Emrah (Ed.). Veri Zarflama Analizi (Bölüm Yazarı: Savaş, Filiz) (2015). İşletmeciler, Mühendisler ve Yöneticiler için Operasyonel, Yönetsel ve Stratejik Problemlerin Çözümünde Çok Kriterli Karar Verme Teknikleri. Dora Yayınevi. Bursa. Yılmaz, A. and Güneş, N. (2015). Efficiency Comparison of Participation and Conventional Banking Sectors in Turkey between 2007-2013. Procedia - Social and Behavioral Sciences, 195, 383-392. Yılmaz, C., Özdil, T. and Akdoğan, G. (2002). Seçilmiş İşletmelerin Toplam Etkinliklerinin Veri Zarflama Yöntemi İle Ölçülmesi, Manas Üniversitesi Sosyal Bilimler Dergisi, Kırgızistan Türkiye Manas Üniversitesi Yayınları: 20, Süreli Yayınlar Dizisi: 6, Sayı 4, Bişkek, 174-183.
28