Instrumentation of an application is necessary to capture performance .... tools provide real-time, rather than post-mortem, performance monitoring. 3.1 Profiling.
Performance Instrumentation and Measurement for Terascale Systems Jack Dongarra1 , Allen Malony2 , Shirley Moore1 , Philip Mucci2 , and Sameer Shende2 1
Innovative Computing Laboratory, University of Tennessee Knoxville, TN 37996-3450 USA {shirley,mucci,dongarra}@cs.utk.edu 2 Computer Science Department, University of Oregon Eugene, OR 97403-1202 USA {sameer,malony}@cs.uoregon.edu
Abstract. As computer systems grow in size and complexity, tool support is needed to facilitate the efficient mapping of large-scale applications onto these systems. To help achieve this mapping, performance analysis tools must provide robust performance observation capabilities at all levels of the system, as well as map low-level behavior to high-level program constructs. This paper describes instrumentation and measurement strategies, together with a performance analysis infrastructure that has implemented a subset of these strategies.
1
Introduction
Performance observation requirements for terascale systems are determined by the performance problem being addressed and the performance evaluation methodology being applied. Instrumentation of an application is necessary to capture performance data. Instrumentation may be inserted at various stages, from source code modifications to compile-time to link-time to modification of executable code either statically or dynamically during program execution. These instrumentation points have different mechanisms which vary in their ease of use, flexibility, level of detail, user control of what data can be collected, and intrusiveness. Performance data of various types can provide valuable insights into program behavior on large-scale systems and point the way toward program transformations that will improve performance. Profiling data show the distribution of a metric across source-level constructs, such as routines, loops, and basic blocks. In addition to timing facilities such as cycle counters, most modern microprocessors provide a rich set of hardware counters that capture functional unit, memory, and operating system events. Profiling can be based one either time or various hardware-based metrics, such as cache misses, for example. Correlations between profiles based on different events, as well as event-based ratios, provide derived information that can help to quickly identify and diagnose performance problems. In addition to profiling data, capturing event traces of program events,
such as message communication events, helps portray the temporal dynamics of application performance. For terascale systems, a wide range of performance problems, performance evaluation methods, and programming environments need to be supported. A suite of tools, based on a flexible and extensible performance observation framework, can best provide the necessary flexibility in experiment design. Research problems that need to be addressed by the framework include the following: the appropriate level and location in the framework for implementing different instrumentation and measurement strategies, how to make the framework modular and extensible, and the appropriate compromise between the level of detail and accuracy of the performance data collected and the instrumentation cost. The remainder of the paper is organized as follows. Section 2 describes the instrumentation mechanisms it is desirable to support. Section 3 describes various types of measurements. Section 4 explains how the instrumentation and measurement strategies are supported in the PAPI cross-platform hardware counter interface and the TAU performance observation framework. Section 5 contains conclusions.
2
Instrumentation
To observe application performance, additional instructions or probes are typically inserted into a program. This process is called instrumentation. Instrumentation can be inserted at various stages, as described below. 2.1
Source Code Instrumentation
Instrumentation at the source code level allows the programmer to communicate higher-level domain-specific abstractions to the performance tool. A programmer can communicate such events by annotating the source code at appropriate locations with instrumentation calls. Once the program undergoes a series of transformations to generate the executable code, specifying arbitrary points in the code for instrumentation and understanding program semantics at those points may not be possible. Another advantage of source code instrumentation is that once an instrumentation library targets one language, it can provide portability across multiple compilers for that language, as well as across multiple platforms. Drawbacks of source code instrumentation include possible changes in instruction and data cache behavior, interactions with optimizing compilers, and runtime overhead of instrumentation library calls. Source code annotations can be inserted manually or automatically. Adding instrumentation calls in the source code manually can be a tedious task that introduces the possibility of instrumentation errors that can produce erroneous performance data. Some of these difficulties with manual source code instrumentation can be overcome by using a preprocessor. A preprocessor is implemented as a source-to-source translation that typically expands header files and performs macro substitutions during compilation. Such source-to-source transformation
can be used to build an instrumentor that automatically introduces instrumentation, alleviating the burden on the programmer. Tools such as PDT [9] for C++, C and Fortran 90, Sage++ [2] for Fortran and C++, and SUIF [16] for C and Fortran parse the application source code and provide object-oriented class libraries to access the data structures that represent the parsed intermediate form. 2.2
Library Level Instrumentation
Wrapper interposition libraries provide a convenient mechanism for adding instrumentation calls to libraries. The MPI Profiling Interface [1] allows a tool developer to interface with MPI calls in a portable manner without modifying the application source code or having access to the proprietary source code of the library implementation. The POMP interface for OpenMP provides a performance API instrumenting OpenMP codes that is portable across compilers and platforms [11]. Defined as a library API, the interface exposes OpenMP execution events of interest (e.g., sequential, parallel, and synchronization events) for performance observation, and passes OpenMP context descriptors to inform the performance interface library of region-specific information. 2.3
Binary Instrumentation
Executable images can be instrumented using binary code-rewriting techniques, often referred to as binary editing tools or executable editing tools. Systems such as Pixie, ATOM [6], EEL [8], and PAT [7] include an object code instrumentor that parses an executable and rewrites it with added instrumentation code. The advantage of binary instrumentation is that there is no need to re-compile an application program and rewriting a binary file is mostly independent of the programming language. Also, it is possible to spawn the instrumented parallel program the same way as the original program, without any special modification as are required for runtime instrumentation [13]. Furthermore, since an executable program is instrumented, compiler optimizations do not change or invalidate the performance optimization. 2.4
Dynamic Instrumentation
Dynamic instrumentation is a mechanism for runtime code patching that modifies a program during execution. DyninstAPI [4] provides an efficient, lowoverhead interface that is suitable for performance instrumentation. A tool that uses this API is called a mutator and can insert code snippets into a running program, which is called the mutatee, without re-compiling, re-linking, or event re-starting the program. The mutator can either spawn an executable and instrument it prior to its execution, or attach to a running program. Dynamic instrumentation overcomes some limitations of binary instrumentation by allowing instrumentation code to be added and removed at runtime. Also, the
instrumentation can be done on a running program instead of requiring the user to re-execute the application. The disadvantage of dynamic instrumentation is that the interface needs to be aware of multiple object file formats, binary interfaces (32/64 bit), operating system idiosyncrasies, as well as compiler specific information (e.g., to support template name de-mangling in C++ from multiple C++ compilers). To maintain cross language, cross platform, cross file format, cross binary interface portability is a challenging task and requires a continuous porting effort as new computing platforms and multi-threaded programming environments evolve.
3
Types of Measurements
Post-mortem performance evaluation tools typically fall into two categories: profiling and tracing, although some provide both capabilities. More recently, some tools provide real-time, rather than post-mortem, performance monitoring. 3.1
Profiling
Profiling characterizes the behavior of an application in terms of aggregate performance metrics. Profiles are typically represented as a list of various metrics (such as inclusive/exclusive wall-clock time) that are associated with programlevel semantics entities (such as routines, basic blocks, or statements in the program). Time is a common metric, but any monotonically increasing resource function can be used, such as counts from hardware performance counters. Profiling can be implemented by sampling or instrumentation based approaches. Sampling-based profiling periodically records the program state, and based on measurements made on those states, estimates the overall performance. Although sampling-based schemes suffer from incomplete coverage of the application and their accuracy depends on the sampling interval, they have the advantage of fixed, low instrumentation overhead and consequently reduced measurement perturbation in the program. In instrumentation-based profiling, measurements are triggered by the execution of instructions added to the code to track significant events in the program (such as the entry or exit of a routine, the execution of a basic block or statement, the send or receipt of a message communication operation). 3.2
Tracing
While profiling is used to get aggregate summaries of metrics in a compact form, it cannot highlight the time varying aspects of the execution. To study the postmortem spatial and temporal aspects of performance data, event tracing, that is, the activity of capturing events or actions that take program during program execution, is more appropriate. Event tracing usually results in a log of the events that characterize the execution. Each event in the log is an ordered
tuple typically containing a time stamp, a location (e.g., node, thread) an identifier that specifies the type of event (e.g., routine transition, user-defined event, message communication, etc.) and event-specific information. In a parallel execution, trace information generated on different processors must be merged. This is usually based on the timestamp which can reflect logical time or physical time. 3.3
Real-time Performance Monitoring
Post-mortem analysis of profiling data or trace files has the disadvantage that analysis cannot begin until after program execution has finished. Real-time performance monitoring allows users to evaluate program performance during execution. Examples of tools that support real-time performance monitoring include Paradyn [10] and Autopilot [15]. Real-time performance monitoring is sometimes coupled with application performance steering, as in Autopilot.
4
PAPI and TAU Instrumentation and Measurement Strategies
Most modern microprocessors provide hardware support for collecting hardware performance counter data [3]. Performance monitoring hardware usually consists of a set of registers that record data about the processor’s function. These registers range from simple event counters to more sophisticated hardware for recording data such as data and instruction addresses for an event, and pipeline or memory latencies for an instruction. Monitoring hardware events facilitates correlation between the structure of an application’s source/object code and the efficiency of the mapping of that code to the underlying architecture. Because of the wide range of performance monitoring hardware available on different processors and the different platform-dependent interfaces for accessing this hardware, the PAPI project was started with the goal of providing a standard cross-platform interface for accessing hardware performance counters [3]. PAPI proposes a standard set of library routines for accessing the counters as well as a standard set of events to be measured. The library interface consists of a high-level and a low-level interface. The high-level interface provides a simple set of routines for starting, reading, and stopping the counters for a specified list of events. The fully programmable low-level interface provides additional features and options and is intended for tool or application developers with more sophisticated needs. Reference implementations of PAPI are available for a number of platforms (e.g., Cray T3E, SGI IRIX, IBM AIX Power, Sun Ultrasparc Solaris, Linux/x86, Linux/IA-64, HP/Compaq Alpha Tru64 Unix). The implementation for a given platform attempts to map as many of the standard PAPI events as possible to the available platform-specific events. The implementation also attempts to use available hardware and operating system support – e.g., for counter multiplexing, interrupt on counter overflow, and statistical profiling.
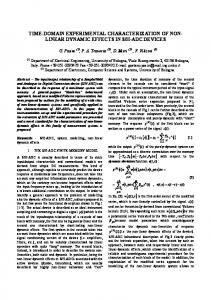
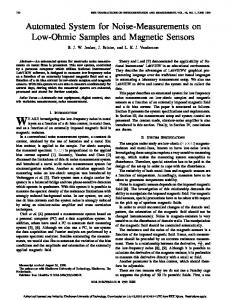
Fig. 1. Layered architecture of the PAPI implementation
The architecture of PAPI is shown in Figure 1. The goal of the PAPI project is to provide a firm foundation that supports the instrumentation and measurement strategies described in the preceding sections and that supports development of end-user performance analysis tools for the full range of high-performance architectures and parallel programming models. For manual and preprocessor source code instrumentation, PAPI provides the high-level and low-level routines described above. The PAPI flops call is an easy-to-use routine that provides timing data and the floating point operation count for the bracketed code. The low-level routines target the more detailed information and full range of options needed by tool developers. For example the PAPI profil call implements SVR4compatible code profiling based on any hardware counter metric. Again, the code to be profiled need only be bracketed by calls to the PAPI profil routine. This routine can be used by end-user tools such as VProf 1 to collect profiling data which can then be correlated with application source code. Using PAPI on large-scale application codes, such as the EVH1 hydrodynamics code, has raised issues of scalability of the instrumentation. PAPI initially focused on obtaining aggregate counts of hardware events. However, the overhead of library calls to read the hardware counters can be excessive if the routines are called frequently – for example, on entry and exit of a small subroutine or basic block within a tight loop. Unacceptable overhead has caused some tool developers to reduce the number of calls through statistical sampling techniques. On most platforms, the current PAPI code implements statistical profiling over aggregate counting by generating an interrupt on counter overflow of a threshold and sampling the program counter. On out-of-order processors the program counter may yield an address that is several instructions or even basic blocks removed from the true address of the instruction that caused the overflow event. The PAPI project is investigating hardware support for sampling, so that tool developers can be relieved of this burden and maximum accuracy can be achieved with minimal overhead. With hardware sampling, an in-flight instruction is selected at random and information about its state is recorded – for example, the 1
http:/aros.ca.sandia.gov/~ cljanss/perf/vprof/
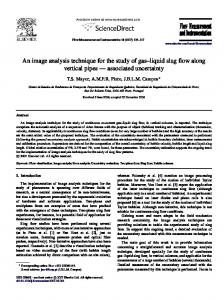
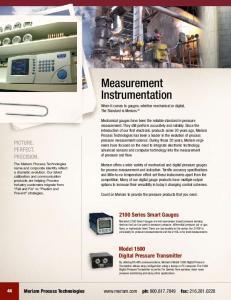
type of instruction, its address, whether it has incurred a cache or TLB miss, various pipeline and/or memory latencies incurred. The sampling results provide a histogram of the profiling data which correlates event frequencies with program locations. In addition, aggregate event counts can be estimated from sampling data with lower overhead than direct counting. For example, the PAPI substrate for the HP/Compaq Alpha Tru64 UNIX platform is built on top of a programming interface to DCPI called DADD (Dynamic Access to DCPI Data). DCPI identifies the exact address of an instruction, thus resulting in accurate text addresses for profiling data [5]. Test runs of the PAPI calibrate utility on the substrate have shown that event counts converge to the expected value, given a long enough run time to obtain sufficient samples, while incurring only one to two percent overhead, as compared to up to 30 percent on other substrates that use direct counting. A similar capability exists on the Itanium and Itanium 2 platforms, where Event Address Registers (EARs) accurately identify the instruction and data addresses for some events. Future versions of PAPI will make use of such hardware assisted profiling and will provide an option for estimating aggregate counts from sampling data. The dynaprof tool developed as part of the PAPI project uses dynamic instrumentation to allow the user to either load an executable or attach to a running executable and then dynamically insert instrumentation probes [12]. Dynaprof uses Dyninst API [4] on Linux/IA-32, SGI IRIX, and Sun Solaris platforms, and DPCL 2 on IBM AIX. The user can list the internal structure of the application in order to select instrumentation points. Dynaprof inserts instrumentation in the form of probes. Dynaprof provides a PAPI probe for collecting hardware counter data and a wallclock probe for measuring elapsed time, both on a per-thread basis. Users may optionally write their own probes. A probe may use whatever output format is appropriate, for example a real-time data feed to a visualization tool or a static data file dumped to disk at the end of the run. Future plans are to develop additional probes, for example for VProf and TAU, and to improve support for instrumentation and control of parallel message-passing programs. PAPI been incorporated into a number of profiling tools, including SvPablo 3 , TAU 4 , and VProf. In support of tracing, PAPI is also being incorporated into version 3 of the Vampir MPI analysis tool 5 . Collecting PAPI data for various events over intervals of time and displaying this data alongside the Vampir timeline view enables correlation of event frequencies with message passing behavior. Real-time performance monitoring is supported by the perfometer tool that is distributed with PAPI. By connecting the graphical display to the backend process (or processes) running an application code that has been linked with the perfometer and PAPI libraries, the tool provides a runtime trace of a userselected PAPI metric, as shown in Figure 2 for floating point operations per 2 3 4 5
http://oss.software.ibm.com/developerworks/opensource/dpcl/ http://www-pablo.cs.uiuc.edu/Project/SVPablo/SvPabloOverview.htm http://www.cs.uoregon.edu/research/paracomp/tau/ http://www.pallas.com/e/products/vampir/index.htm
second (FLOPS). The user may change the performance event being measured by clicking on the Select Metric button. The intent of perfometer is to provide a fast coarse-grained easy way for a developer to find out where a bottleneck exists in a program. In addition to real-time analysis, the perfometer library can save a trace file for later off-line analysis. The dynaprof tool described above includes a perfometer probe that can automatically insert calls to the perfometer setup and color selection routines so that a running application can be attached to and monitored in real-time without requiring any source code changes or recompilation or even restarting the application.
Fig. 2. Real-time performance analysis using Perfometer
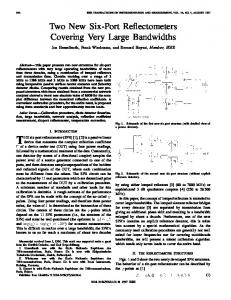
TAU (Tuning and Analysis Utilities) is a portable profiling and tracing toolkit for parallel threaded and or message-passing programs written in Fortran, C, C++, or Java, or a combination of Fortran and C. TAU has three distinct phases for instrumentation, measurement, and analysis, as shown in Figure 3. The program can undergo a series of transformations that insert instrumentation before it executes. Instrumentation can be added a various stages, from compiletime to link-time to run-time, with each stage imposing different constraints and opportunities for extracting program information. Moving from source code to binary instrumentation techniques shifts the focus from a language specific to a more platform specific approach. TAU can be configured to do either profiling or tracing or to do both simultaneously. Source code can be instrumented by manually inserting calls to the TAU instrumentation API, or by using the Program Database Toolkit (PDT) 6 and/or 6
http://www.cs.uoregon.edu/research/paracomp/pdtoolkit/
Fig. 3. TAU performance observation framework
the Opari OpenMP rewriting tool 7 to insert instrumentation automatically. PDT is a code analysis framework for developing source-based tools. It includes commercial grade front end parsers for Fortran 77/90, C, and C++, as well as a portable intermediate language analyzer, database format, and access API. The TAU project has used PDT to implement a source-to-source instrumentor (tau instrumentor) that supports automatic instrumentation of C, C++, and Fortran 77/90 programs. Examples are provided with the TAU distribution that show how to use tau instrumentor with sequential, OpenMP, MPI, and mixed OpenMP/MPI applications. The Opari tool rewrites OpenMP directives in functionally equivalent, but source-instrumented forms, inserting POMP performance calls where appropriate. TAU can use Opari for automatic instrumentation of OpenMP constructs. Opari may be used in conjunction with PDT for comprehensive automatic instrumentation of OpenMP and mixed mode parallel programs. TAU can use DyninstAPI [4] to construct calls to the TAU measurement library and then insert these calls into the executable code. This is done by a mutator program (tau run). The mutator loads the TAU dynamic shared object (the TAU compiled measurement library) in the address space of the mutatee. It parses the executable image for symbol table information and generates the list of modules and routines within the modules that are appropriate for instrumentation. The user can optionally provide a selective instrumentation list that specifies a list of routines to be included or excluded from instrumentation. tau run can instrument sequential as well as parallel programs. TAU can use PAPI to generate profiles based on hardware counter data. If TAU is configured without the PAPI multiple counters option, then the user selects the metric on which to base the profiling at runtime by setting an envi7
http://www.fz-juelich.de/zam/kojak/opari/
ronment variable. If TAU is configured with the multiple counters option, then up to 25 metrics may be specified and a separate profile generated for each. These profiles for the same run can then be compared to see important correlations, such as for example the correlation of time with operation counts and cache or TLB misses. The TAU MPI wrapper library uses the MPI profiling interface to generate profile and/or trace data for MPI operations. TAU MPI tracing produces individual node-context-thread event traces that can be merged and converted to ALOG, SDDF, Paraver, or Vampir trace formats. For threaded or mixed mode programs, TAU tracing can produce trace files that can be displayed by Vampir to show individual thread activity and interaction – for example, for OpenMP threads – even though Vampir has no knowledge of threads. TAU has filtering and feedback mechanisms for reducing instrumentation overhead. The user can specify routines that should not be instrumented in a selective instrumentation file. The tau reduce tool automates this specification using feedback from previously generated profiling data by allowing the user to apply a set of selection rules that are applied to the data.
5
Conclusions
Terascale systems require a performance observation framework that supports a wide range of instrumentation and measurement strategies. The PAPI and TAU projects are addressing important research problems related to construction of such a framework. The widespread adoption of PAPI by third-party tool developers demonstrates the value of implementing low-level access to architecture-specific performance monitoring hardware underneath a portable interface. Whereas tool developers previously had to re-implement such access for each platform, they can now program to a single interface, allowing them to focus their efforts on high-level tool design. The TAU framework provides mechanisms for inserting instrumentation for both profiling and tracing at various stages of program transformation. Plans are to use this framework to implement instrumentation needed by other tools, such as the MetaSim memory trace tool [14]. Tradeoffs between accuracy and efficiency of performance monitoring has been explored by both the PAPI and TAU projects. Statistical sampling methods, such as used in the current PAPI substrate for the Alpha Tru64 UNIX platform, yield sufficiently accurate results for large enough sample sizes while incurring very little overhead. Filtering and feedback schemes such as those use by TAU lower overhead while focusing instrumentation where it is most needed. Together, the PAPI and TAU projects have begun the construction of a portable performance tool infrastructure for terascale systems that is designed for interoperability, flexibility, and extensibility. More information about PAPI is available at http://icl.cs.utk.edu/papi/. Further information about TAU is available at http://www.cs.uoregon.edu/research/paracomp/tau/.
References 1. MPI: A message passing interface standard. International Journal of Supercomputing Applications, 8(3/4), 1994. 2. F. Bodin, P. Bechman, D. Gannon, J. Gotwals, S. Narayana, S. Srinivas, and B. Winnicka. Sage++: an object-oriented toolkit and class library for building Fortran and C++ restructuring tools. In Proc. Second Annual Object-Oriented Numerics Conference, 1994. 3. S. Browne, J. Dongarra, N. Garner, G. Ho, and P. Mucci. A portable programming interface for performance evaluation on modern processors. International Journal of High Performance Computing Applications, 14(3):189–204, 2000. 4. B. Buck and J. Hollingsworth. An API for runtime code patching. International Journal of High Performance Computing Applications, 14(4):317–329, 2000. 5. J. Dean, C. A. Waldspurger, and W. E. Weihl. Transparent, low-overhead profiling on modern processors. In Workshop on Profile and Feedback-directed Compilation, Paris, France, October 1998. 6. A. Eustace and A. Srivastava. ATOM: A flexible interface for building high performance program analysis tools. In Proc. USENIX Winter 1995, pages 303–314, 1995. 7. J. Galarowics and B. Mohr. Analyzing message passing programs on the Cray T3E with PAT and VAMPIR. Technical report, ZAM Forschungszentrum: Juelich, Germany, 1998. 8. J. Larus and T. Ball. Rewriting executable files to measure program behavior. Software Practice and Experience, 24(2):197–218, 1994. 9. K. Lindlan, J. Cuny, A. D. Malony, S. Shende, B. Mohr, R. Rivenburgh, and C. Rasmussen. A tool framework for static and dynamic analysis of object-oriented software with templates. In Proc. SC 2000, Dallas, Texas, 2000. 10. B. Miller, M. Callaghan, J. Cargille, J. Hollingsworth, R. Irvin, K. Karavanic, K. Kunchithapadam, and T. Newhall. The Paradyn parallel performance measurement tools. IEEE Computer, 28(11), 1995. 11. B. Mohr, A. D. Malony, S. Shende, and F. Wolfe. Design and prototype of a performance tool interface for OpenMP. The Journal of Supercomputing, 23:105– 128, 2002. 12. P. Mucci. Dynaprof 0.8 user’s guide. Technical report, Nov. 2002. 13. S. Shende, A. D. Malony, and R. Ansell-Bell. Instrumentation and measurement strategies for flexible and portable empirical performance evaluation. In International Conference on Parallel and Distributed Processing Techniques and Applications (PDPTA’2001), 2001. 14. A. Snavely, L. Carrington, N. Wolter, J. Labarta, R. Badia, and A. Purkayastha. A framework for performance modeling and prediction. In SC 2002, Baltimore, MD, Nov. 2002. 15. J. S. Vetter and D. A. Reed. Real-time performance monitoring, adaptive control, and interactive steering of computational grids. International Journal of High Performance Computing Applications, 14(4):357–366, Winter 2000. 16. R. Wilson, R. French, C. Wilson, S. Amarasinghe, J. Anderson, S. Tjiang, S. Liao, C. Tseng, M. Hall, M. Lam, and J. Hennessy. SUIF: An infrastructure for research on parallelisng and optimizing compilers. ACM SIGPLAN Notices, 29(12):31–37, 1994.