The metrics can be linked with major success factors associated ..... An additional problem was that the Navy did not consistently report closing ship- ... rise in DLH is due to BES data that include munitions depot maintenance, which ..... nance, new mission requirements (buildings and equipment) are not elements un-.
Logistics Management Institute
Performance Metrics for Assessing Resource Utilization in Business Areas
PA703R1 May 1999
I
Dale A. Kern, PH:D. Virginia Stouffer JohnDukovich
19990708 116 J.
DISTRIBUTION STATEMENT A Approved for Public Release Distribution Unlimited IJJIG QUALITY INSPECTED 4
LMI
Performance Metrics for Assessing Resource Utilization in Business Areas A Focus on Depot Maintenance
PA703R1 May 1999
Dale A. Kern, Ph.D. Virginia Stouffer John Dukovich
Prepared pursuant to Department of Defense Contract DASW01-95-C-0019. The views expressed here are those of the Logistics Management Institute at the time of issue but not necessarily those of the Department of Defense. Permission to quote or reproduce any part except for government purposes must be obtained from the Logistics Management Institute. LOGISTICS MANAGEMENT INSTITUTE 2000 CORPORATE RIDGE MCLEAN, VIRGINIA 22102-7805
LOGISTICS MANAGEMENT INSTITUTE
Performance Metrics for Assessing Resource Utilization in Business Areas A Focus on Depot Maintenance PA703R1/MAY 1999
Executive Summary Many Department of Defense (DoD) support organizations are financed with revolving funds to take advantage of their flexibility. However, in the appropriations-oriented Defense Programming Review, there has been little visibility of the internal financial operating plans of those support organizations and of the total funding that their customers plan to spend on them. DoD is interested in developing performance metrics applicable to program analysis of defense support business areas. We identify key indicators geared toward this purpose. Our research and findings focus on three specific performance metric areas: output, cost, and quality. In performing this research, we concentrated on identifying potential metrics in these three specific areas and evaluating the existing supporting data and its validity. We also observed the collected data, the metrics, and the potential indications of those data. To minimize the disruption to Office of the Secretary of Defense activities, agencies, and the Services during the course of this task, it was decided that new data reporting requirements would be minimized. Therefore, we used existing data elements to the maximum extent possible. This constraint affects both historical and projected data. Our findings and conclusions pertain to the two broad purposes of this task: (1) identifying potential metrics and evaluating the supporting data; and (2) observing the collected data, the associated metrics, and the potential indications of the metrics. The conclusions also include important cautions on the use of the resulting metrics. We believe that the set of metrics areas (i.e., output, cost, and quality) we developed can be useful in conducting program analysis of the Depot Maintenance business area. The metrics can be linked with major success factors associated with the DoD's strategic goals and missions. These metrics, taken together, form
in
a reasonably good picture of resource-related trends in output and cost performance. Sufficient data to construct the output and cost metrics are available in the Budget Estimate Submissions (BESs). Because of changes, to include transfers of missions between organizations, care must be exercised when extracting data to ensure a consistent baseline is being used. Quality performance data are in a substantial shortfall. Not all Services adequately reported quality data in the Depot Maintenance Operations Indicators, and the BES does not include such data for any Service. Some organizations (e.g., Naval Sea Systems Command and the Marine Corps) are known to be resistant to such measures. The additional data from the depots will not necessarily remove resistance. It is possible that the increased cost of gathering more detailed data will not be recouped in an increased analysis capability. We analyzed and summarized general overriding trends and noted specific trends, when appropriate. We stress that the performance metrics should provide insight into how well an organization is functioning but should not drive the organization's functions. There is always the danger that emphasis will be placed on improving the "scores" of the metrics, and that attention will be paid to improving the components of the metrics at the expense of other factors.
IV
Contents Chapter 1 Introduction
1-1
OVERVIEW
1-1
OBJECTIVE
1-1
RELATED RESEARCH
1-1
CONSTRAINTS
1-2
Chapter 2 Methodology
2-1
PERFORMANCE PERSPECTIVES
2-1
PERFORMANCE METRIC AREAS
2-4
Chapter 3 Analysis
3-1
OUTPUT
3-1
Data
3-1
Results
;
3-3
OPERATING COST
Data
3-2
'.
3-4
Results
3-5
CAPITAL COST
3-7
Data
3-8
Results
3-9
QUALITY
3-11
Data
3-11
Results
3-12
Chapter 4 Findings, Conclusions, and Cautions
4-1
POTENTIAL METRICS AND SUPPORTING DATA
4-1
GENERAL OBSERVATIONS ABOUT THE DEPOT MAINTENANCE BUSINESS AREA
4-2
CAUTIONS
4-2
Appendix A Detailed Data and Analysis Appendix B Abbreviations
FIGURES Figure 2-1. Strategic Measurement Model
2-2
Figure 3-1. Direct Labor Hours
;
3-2
Figure 3-2. Operating Expense/DLH
3-5
Figure 3-3. Overhead Cost/DLH
3-6
Figure 3-4. Capital Effectiveness Ratio
•
3-9
Figure 3-5. Net Capital Investment
3-10
Figure 3-6. Schedule Conformance
3-12
TABLES Table 2-1. Measurement Data Sources
•
Table 2-2. Performance Perspectives
2 3
"
2-4
VI
Chapter 1
Introduction OVERVIEW Many Department of Defense (DoD) support organizations are financed with revolving funds to take advantage of the flexibility offered by them. However, in the appropriations-oriented Defense Programming Review, there has been little visibility of the internal financial operating plans of those support organizations and of the total funding that their customers plan to spend on them. Additionally, even when estimates of available customer funding are made, customers may change their workload requirements for a variety of reasons, including changing priorities or national security requirements. The cost of these changes to customer requirements is not well understood. Also, the lack of coordinated plans for both support customers and support providers results in DoD's inability to provide effective oversight and management guidance of major support organizations financed through the revolving or working capital funds.
OBJECTIVE DoD is interested in developing performance metrics applicable to program analysis of defense support business areas. In this report, we identify key indicators geared toward evaluating resource utilization during program reviews and at other times. This is the first in a series of reports focusing on the various activities in the Defense Working Capital Fund (DWCF). In this report, we highlight the Depot Maintenance business area. Specifically, our research and findings focus on three specific performance metric areas requested by the sponsor. These areas include output, cost, and quality. In performing this research, we concentrated on identifying potential metrics in these three specific areas and evaluating the existing supporting data available and its validity. We also observed the collected data, the metrics, and the potential indications of those data.
RELATED RESEARCH Concurrent with our Depot Maintenance business area research, we have begun a more broad review of the Supply Management business area of all the military services and the Defense Logistics Agency (DLA). This concurrent effort is being conducted with fewer research constraints in the early phases. This may then allow more potential performance metrics to be considered, at least initially, prior to 1-1
narrowing the focus of the research through the addition of constraints, such as immediate data availability. We anticipate that in the subsequent efforts, due to fewer constraints, we will be able to place more emphasis on areas such as the following: ♦ Are the measures we developed linked well to key factors? ♦ What cautions do we have about the use of these measures (and these data) by senior analysts and managers? ♦ Are there emerging areas or practices that must now be measured that were not required, or even known, in the past? If so, how long will be required to develop a valid baseline? We anticipate that following the completion of the Depot Maintenance and Supply Management business area research, subsequent research will be desired in other activity groups of the DWCF. These areas include, at a minimum, the Distribution and Transportation business areas.
CONSTRAINTS To minimize the disruption to Office of the Secretary of Defense (OSD) activities, agencies, and the Services during the course of this task, it was decided that new data reporting requirements would be minimized. Therefore, it was necessary for the Logistics Management Institute (LMI) to use existing data elements to the maximum extent possible. This constraint affects both historical and projected data.
1-2
Chapter 2
Methodology PERFORMANCE PERSPECTIVES Our approach to determining appropriate performance measures began with a review of metrics literature, a review of DoD strategic documents emphasizing areas focusing on logistics, a review of performance measure documents submitted to OSD, and a matching of DoD focus areas to the perspectives highlighted in the literature. Then we collected available data and developed metrics based on the basis of those data. We began by initiating a literature review. The literature review provided a common theme that insisted performance measures needed to be linked to the organization's strategic objectives to be effective tools for business improvement. The linkage is normally achieved by identifying performance measures that highlight accomplishment of key success factors. Such factors are required for the organization to achieve its strategic objectives. Performance areas are measured for several reasons, such as for planning and budgeting, assessing operational improvements, allocating resources, and monitoring operations. According to Ammons, there are four categories of performance measures:1 ♦ Workload measures—indicate the amount of work performed or the amount of services received (e.g., number of items repaired). ♦ Efficiency measures—relate the work performed to the resources consumed to perform the work (e.g., cost per repair). ♦ Effectiveness measures—indicate the quality of performance by assessing the level of performance objectives achieved (e.g., percentage of correct repairs). ♦ Productivity measures—combine efficiency and effectiveness measures into one metric (e.g., unit cost per correct repair). The "balanced scorecard" is a popular methodology that looks across functional areas within an organization (to ensure one function is not optimized at the expense of another) and ties the strategic objectives of the organization directly to
1
David N. Ammons, Municipal Benchmarks: Assessing Local Performance and Establishing Community Standards. Thousand Oak, CA: Sage Publications, 1996.
2-1
the performance measures.2 Figure 2-1 illustrates such a strategic measurement model that expands upon the balanced scorecard approach. Figure 2-1. Strategic Measurement Model • What the organization is. • The future goal(s) of the organization. • What the organization stands for.
Mission, vision, and values ir
• What the organization needs to focus on to beat its competitors and achieve its vision.
Key success factors and business fundamentals '
■
{
Performance metrics
« A balanced scorecard (past-present-future).
r ■
35 .
NAVAIR
3 O
5 30 ■
O
u
^25 ,.
z
USMO
_1 Q
?n
NAVSEA
•o a ? ^ 15 a>
USAF-
>
O 10 -
5 0 -
1 1996
Fiscal year
Now we will discuss Service-specific observations, for both Figure 3-2 and Figure 3-3. For the Army, the change of the DLH baseline (the BES data include munitions depot maintenance, but DMOI data do not) has caused the BES data to be generally lower than the DMOI data. The Operating expense/DLH and Overhead cost/DLH indicate that the Army depots do well in an increasing-workload environment (FY97-FY98). When DLH increases, if both overhead and DLC increase proportional to DLH, the Operating expense/DLH curve would be flat. However, since the curve slopes downward, operating expenses are increasing at a slower rate than DLH. Similarly, the downward sloping Overhead cost/DLH line indicates that overhead is also increasing at a slower rate than DLH. Trends in decreasing workload for the Army depot are not as favorable. Operating expense/DLH does not increase dramatically in FY98-FY99 when DLH increases. This indicates that operating expenses are reduced at about the same rate as the workload decrease. The slight growth shown by the Overhead cost/DLH line, in combination with the almost flat line for Operating expense/DLH indicates that overhead is decreasing less rapidly than DLH. In fact, these curves indi-
3-6
Analysis cate that DLC is potentially decreasing faster than DLH, and overhead is becoming the more substantial component, which is not a desired outcome. Overhead, as an individual data element, was reported only for a subset of the Air Force depots in the DMOI. Therefore, the FY96 Overhead cost/DLH data point is not valid. Focusing on the FY97-FY99 time frame, DLH decreases in both periods. For the period FY97-FY98, Overhead cost/DLH and Operating expense/DLH rise, indicating that at least overhead is not decreasing at the rate of DLH. The FY98-FY99 line segments indicate that overhead begins to decrease more rapidly than DLH, but DLC does not decrease as fast as DLH. The combination of these two effects indicates that DLC does not decrease at a rate proportional to DLH. For NAVAIR, if the FY95 and FY96 data were averaged, the trend for operating expenses and Operating expense/DLH would be a decreasing function—that average data point would be the same as the FY97 BES computed point. Because Operating expense/DLH and Overhead cost/DLH remain constant or decrease while DLH increases, NAVAIR is doing well controlling its expenses. When DLH either increases or decreases, one would desire both Operating expense/DLH and Overhead cost/DLH to decrease. This is not the case with the NAVSEA data. During FY97-FY98, Overhead cost/DLH is constant but Operating expense/DLH increases. This indicates that DLCs are not decreasing at the same rate as DLH, which means that there may be a problem with DLC. During FY98-FY99, Overhead cost/DLH increases, indicating that overhead is not decreasing at the same rate as DLH, which is a potential problem. This may be a case where the workload may be constant but labor hours are just being reclassified as overhead from the direct category. For the Marine Corps, we see that the more substantial drop in FY98-FY99 DLH did not have a corresponding decrease in overhead. It appears that DLC decreased (at least proportionally to DLH), but overhead did not decrease proportionately.
CAPITAL COST Two metrics were developed for capital cost. The first is the Capital effectiveness ratio, defined as throughput divided by depreciated capital asset value. For our purposes, throughput is calculated as revenue less direct material cost, as shown in Equation 3-3. Revenue - Direct material cost ., . „. — = Metric #3. Depreciated capital asset value
„ „, r_ [Eq. 3-3]
The metric described by Equation 3-3 represents the "value added" by the depot, per unit of asset value. For example, the increase in value of a repaired item over a damaged item is due to two components: the repairs added and the labor required to install these items. The depot does not control the cost of materials (a 3-7
pass-through cost to the depot) but does control the labor component. This is the value added being captured in this measure. The second metric is simply the measure of Net capital investment during the period. The DMOI reports this value as "capital assets," so for DMOI data, the incremental year-to-year change was used. That is, DMOI reports total capital each period, so the net capital inventory was calculated as DMOk+i-DMOh. The BES did not report this metric directly, so the net capital investment value had to be calculated with given BES data, as shown in Equation 3-4: Program year authority - Depreciation = Metric #4 .
[Eq. 3-4]
Net capital investment represents the degree of modernization and the resources put toward the infrastructure required to support the mission. This second metric, Net capital investment, is used to allow for the separation of capital-only increases from throughput-only decreases. Capital investments are not always intended to increase throughput, but may be made to decrease operating expenses. Increasing investment causes the ratio of throughput to capital to decrease—however, there is no impact on revenue (the customer does not pay a different price), and there is no direct material change. Instead, operating expenses and overhead may decrease in relationship to DLH. Investments can be effectively used to decrease labor requirements. Again, this emphasizes the need to examine all metrics, not one metric in isolation.
Data The Capital effectiveness ratio is reported directly in the DMOI. The DMOI nomenclature is "capital investment effectiveness." Additionally, depreciated assets are reported directly in the DMOI. However, we calculate the ratio, since throughput (the numerator of Equation 3-3) and depreciated capital asset value is directly reported in the DMOI. As stated earlier, all financial data in this report are presented in current year dollars. The BES reports capital investment and depreciation separately for each period. Only the incremental, not the cumulative, investment is reported so Equation 3-4 is used to calculate the Net capital investment. Subsequently, Equation 3-4 also serves as the denominator for Equation 3-3 when BES data are used. Additionally, only equipment values and real property maintenance (RPM) investment are represented in the BES—military construction (MILCON) is not. For DoD, equipment and RPM capture approximately 70 percent of capital investments. Also, the only equipment investments reported in working capital fund (WCF) budgets are for replacement items; new equipment requirements are funded by the customer or system program office imposing the requirements. Therefore, BES data may be under-reporting capital investments, compared with the DMOI data. These differences may help us to understand some of the results below. A key reason for establishing performance measurements is to develop insight into specific business areas and to enact control on components of the measures
3-8
Analysis when they are seen to be exceeding acceptable limits. However, for depot maintenance, new mission requirements (buildings and equipment) are not elements under depot control and, therefore, depot management should not be judged on these areas. MILCON is a separate appropriation and is not part of WCF BES. Equipment for new missions is part of the equipment systems funding stream (also not a part of WCF BES).1 Only replacement and repair requirements (for buildings and equipment) are cost elements that a depot can control. The BES capital investments data capture equipment replacement procurement and RPM. Therefore, capturing only replacement equipment and RPM encompasses only about 70 percent of the investment. However, these items are essentially 100 percent of the investment controlled by the depots. The capital investment baseline will not affect the direction of the trends shown in the graphs—only the slope (rate of change) of the lines.
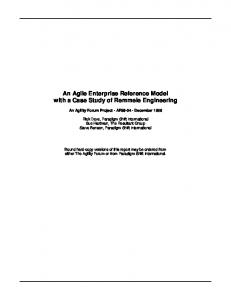
Results The two capital cost metrics are graphed below for each Service. Neither the Capital effectiveness ratio (Figure 3-4) nor the Net capital investment (Figure 3-5) metrics exhibited any overriding trends. One observation is that the BES data for capital investment in Figure 3-5 appear to be "tighter" with less variance than the DMOI data. Service-specific results are presented in the paragraphs that follow. Figure 3-4. Capital Effectiveness Ratio 4.5 ,
DMOI
4.0 ■ 3.5 , 3.0 ■ 2.5 2.0 i
USMC NAVSEA
*-"~~^~..,^
1.5 1.0 0.5 -
nn -
h
-+-
1994
1996
1997
1998
Fiscal year
The Army's throughput (revenue less direct materials) increased from the DMOI data to the BES data because ordnance depots were included in the BES, but not the DMOI. From FY97 to FY99, Net capital investment decreased. With this in mind, the data indicate that while not replenishing the capital replacement fund (i.e., net investment decreased), throughput rose. We cannot isolate the contribuNew equipment is about 25 percent of total equipment.
3-9
tion to throughput that is new mission or new equipment that is "free issue" to the depot; however, these data could inspire one to investigate this further. Figure 3-5. Net Capital Investment
Air Force throughput increased significantly from DMOI to BES data points. We verified our computations but could not uncover a clear reason for this jump. All that can be said is that the trend is an increase of the capital effectiveness ratio, even in years of negative net investment. This indicates the maintainability or improvement of throughput with a negative "capital flow," at least temporarily in the time frame studied. NAVAIR's capital cost performance was "middle of the road." One observation is that throughput tended to increase with low net investment. However, in later years, throughput did not increase substantially by the increased positive net investment. NAVSEA did not show promising capital cost performance. Generally, throughput decreased while capital investment was consistently negative. The resulting indication is that throughput decreased at a greater rate than capital assets. The Marine Corps' performance also was not encouraging. The most recent data indicate a decreasing trend in throughput, while capital investment hovered around zero. The observation is that throughput decreased at a greater rate than assets.
3-10
Analysis
QUALITY Two metrics were developed to measure quality. The first is schedule conformance, defined as the number of items completed on time, divided by the number of items scheduled. Equation 3-5 shows this relationship. Number of items completed ontime Number of items scheduled
_, . „_ = Metric #5.
r„
_, [Eq. 03-5]
Equation 3-5 captures customer satisfaction quality, since not meeting schedule results in a ripple effect to depot customers, present and future. Since this metric is a percentage, only an increase in its value is an acceptable change. A major shortfall with this metric is that schedule conformance weights each work order equally, whether that work order is for a single item or a large "lot" of items. However, more detailed data would require a significant data collection effort. The second metric is in-repair time, defined as the total item-days in repair, divided by the number of items completed. This metric also is described as DMOI process days. We do not recommend using this second metric, since the product mix can cause a significant change in the metric value. For example, one would be adding disparate items such as tanks and rifles without any type of normalization process. Changing a depot's workload from tank repair to small arms repair would cause a significant change in the metric value; however, the mix of the systems is not within the depot's control.
Data The DMOI reported "schedule indicator" data were used directly for schedule conformance. However there are concerns with some of the Services. NAVSEA does not report schedule indicator data because NAVSEA defines units completed as ships, the largest depot-level repairable. Since the number of units (ships) completed in a given time frame is so low compared with standard product lines, this indicator would give misleading or inaccurate results. The Marine Corps also does not report the schedule indicator since it does not have the maintenance float that allows the Fleet Marine Forces (FMF) to issue weapon systems and receive replacements to satisfy Table of Equipment (TE) shortages. Therefore, in most cases, the FMF operates TE deficient until depot maintenance is completed and the weapon is returned. The Army did not report this data in FY93 and FY94. The BES does not contain data that are comparable, so no projections were made.
3-11
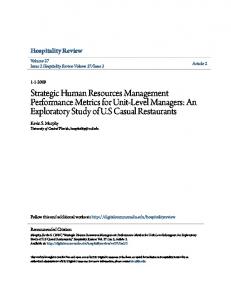
Results Since there were only two data points for the Army, we can only review the Air Force and NAVAIR data for trends shown in Figure 3-6. These are discussed in the Service-specific paragraphs below. Figure 3-6. Schedule Conformance
DMOI
E
*. BES 2,000 0 93
96 Fiscal year
95
94
99
97
The Air Force's DLH decreased (Figure A-2) at a relatively constant rate (approximately 5 percent per year). The transition point from the DMOI data to the BES data appears to be smooth, which is the desired behavior. Unlike the Army data, it appears that the Air Force DMOI and BES data are directly comparable. Additionally, the downward trend is a first-level indicator of actions being taken to reduce DLH. Figure A-2. Direct Labor Hours—Air Force 35,000
30,000
"n
25,000 --
20,000
g 15,000 --
X
10,000 --
^0—DMOI ■^Q-BES
5,000
93
94
95
96
97
99
Fiscal year
NAVAIR data (Figure A-3) indicated that workload increased in the FY94-FY96 time frame and is predicted to remain constant through FY99. The transition from DMOI to BES data is smooth. A-2
Detailed Data and Analysis Figure A-3. Direct Labor Hours—NAVAIR 14,000 12,000 -10,000 I HI
| 8,000
£ 6,000 -DMOI
4,000 --
BES 2,000 --
94
93
96 Fiscal year
95
97
99
98
The NAVSEA output data (Figure A-4) indicate that workload is decreasing at a consistent rate over the time frame plotted, with the transition between DMOI and BES data being seamless. Figure A-4. Direct Labor Hours—NAVSEA 45,000 -r
30,000 -25,000 --
""""fvoArsn^i
20,000 -15,000 -—0— DMOI
10,000 -5,000
-+93
94
95
96
97
98
99
Fiscal year
The USMC (Figure A-5) data indicate that workload is decreasing at a slow, yet constant rate, with a somewhat larger drop planned for FY99. Again, the transition from DMOI to BES also is smooth.
A-3
Figure A-5. Direct Labor Hours—Marine Corps 3.3UU -
3,000 -
2,500 -
HX
o
*n
o 2,000 -
«k. 3 O
x
1,500 -
1,000 -
■ DMOI .BES
500 -
0 -
:
93
1
1
94
95
96 Fiscal year
97
98
99
OPERATING COST The two operating cost metrics were Operating expense/DLH and Overheadcost/DLH. Each is graphed below for each Service. For the Army (Figures A-6 and A-7), the change of the DLH baseline (the BES data include munitions depot maintenance, but DMOI data do not) has caused the BES data to be generally lower than the DMOI data. The Operating expense/DLH and Overhead cost/DLH indicate that the Army depots do well in an increasing-workload environment (FY97 to FY98). When DLH increases, if both overhead and DLC increase proportional to DLH, the Operating expense/DLH curve would be flat. However, since the curve slopes downward, operating expenses are increasing at a slower rate than DLH. Similarly, the downward sloping Overhead cost/DLH line indicates that overhead is also increasing at a slower rate than DLH.
A-4
Detailed Data and Analysis Figure A-6. Operating Expense/DLH—Army 80
T
I 50 --
e
P Q
40 --
+ 8 30 c a
2.20
—0—DMOI —D—BES
10 0 97
96
95
94
93
99
98
Fiscal year
Figure A-7. Overhead Cost/DLH—Army 40 35 -~. 30 -S o
25
5
20
15 --
> o
10 -- ->-
5-0 93
DMOI *BES
94
95
■+96
97
99
Fiscal year
Trends in decreasing workload for the Army depot are not as favorable. Operating expense/DLH does not increase dramatically in FY98-FY99 when DLH increases. This indicates that operating expenses are reduced at about the same rate as the workload decrease. The slight growth shown by the Overhead cost/DLH line, in combination with the almost flat line for Operating expense/DLH indicates that overhead is decreasing less rapidly than DLH. In fact, these curves indicate that DLC is potentially decreasing faster than DLH, and overhead is becoming the more substantial component, which is not a desired outcome.
A-5
Overhead, as an individual data element, was reported only for a subset of the Air Force depots in the DMOI (Figures A-8 and A-9). Therefore, the FY96 Overhead cost/DLH data point is not valid. Focusing on the FY97-FY99 time frame, DLH decreases in both periods. For the period FY97-FY98, Overhead cost/DLH and Operating expense/DLH rise, indicating that at least overhead is not decreasing at the rate of DLH. The FY98-FY99 line segments indicate that overhead begins to decrease more rapidly than DLH, but DLC does not decrease as fast as DLH. The combination of these two effects indicates that DLC does not decrease at a rate proportional to DLH. Figure A-8. Operating Expense/DLH—Air Force
o
£
o o_ X
50
»«n
_l
e y
40
Q
+
■o
30
O
20 0— DMOI >« BES
10 --
93
94
1 96
95
Fiscal year
A-6
97
99
Detailed Data and Analysis Figure A-9. Overhead Cost/DLH—Air Force 25 -r
^»W»^;»^
20 --
15 --
I 10
g
O
■O-
5
DMOI •BES
■+-
93
94
95
96
97
98
Fiscal year
For NAVAIR (Figures A-10 and A-l 1), if the FY95 and FY96 data were averaged, the trend for operating expenses and Operating expense/DLH would be a decreasing function—that average data point would be the same as the FY97 BES computed point. Because Operating expense/DLH and Overhead cost/DLH remains constant or decreases while DLH increases, NAVAIR is doing well controlling its expenses. Figure A-10. Operating Expense/DLH—NAVAIR
X _l
5
o _i a +
96 Fiscal year
A-7
Figure A-11. Overhead Cost/DLH—NAVAIR 40 35 -30
8. 20 X _l
§ 15 --
!
■O-
10
DMOI