2015 IEEE 8th International Conference on Cloud Computing
Performance Metrics for Data Center Communication Systems Claudio Fiandrino∗ , Dzmitry Kliazovich∗ , Pascal Bouvry∗ and Albert Y. Zomaya† ∗ University of Luxembourg - Luxembourg - {name.surname}@uni.lu † University of Sydney - Australia -
[email protected] efficiency of the data center communication system from the efficiency of the computing servers, as both remain considered under the common umbrella of IT equipment [7]. Distinguishing communication systems from the IT equipment and assessing their performance is very important. Most cloud applications follow Software-as-a-Service (SaaS) model [8] and communication processes, not computing, tend to become the bottleneck limiting overall system performance [9]. Specifically, latency, available bandwidth or both can become limiting factors. Voice conferencing, for example, imposes severe constraints on the communication latency, but does not require high bandwidth availability. On the opposite side, video streaming, cloud storage and cloud backup applications require high bandwidth to transfer huge amounts of data, but remain tolerant to network delays. Finally, cloud gaming produces high traffic load and requires tight delay constraints to keep players synchronized. Cloud communications can be categorized according to the direction of information flow: cloud-to-user and intracloud. The former is related to serving cloud users located in the access network. This was not needed in the PC era when all data and software were available on user devices. The latter corresponds to the traffic which remains inside a data center. Cisco estimates that network traffic is the fastest-growing data center component, rising to 4.3 ZiB in 2016 with a combined annual growth rate of 44% [10]. Networking solutions, architectures and protocols therefore must be carefully considered to achieve good performance. In this paper we propose a framework of metrics for assessing performance and energy efficiency of communication systems for cloud computing data centers. Unlike existing metrics, the proposed framework allows a finegrain analysis and comparison of communication systems, processes, and protocols, defining their influence on the performance of cloud applications. The presented framework is being considered for standardization and is positioned to become an essential tool for scientific research in cloud computing and data center industries.
Abstract—Cloud computing has become a de facto approach for service provisioning over the Internet. It operates relying on a pool of shared computing resources available on demand and usually hosted in data centers. Assessing performance and energy efficiency of data centers becomes fundamental. Industries use a number of metrics to assess efficiency and energy consumption of cloud computing systems, focusing mainly on the efficiency of IT equipment, cooling and power distribution systems. However, none of the existing metrics is precise enough to distinguish and analyze the performance of data center communication systems from IT equipment. This paper proposes a framework of new metrics able to assess performance and energy efficiency of cloud computing communication systems, processes and protocols. The proposed metrics have been evaluated for the most common data center architectures including fat-tree three-tier, BCube and DCell. Keywords-Data center, cloud computing, performance and energy efficiency metrics
I. I NTRODUCTION Cloud computing has emerged and has become fundamental for IT operations worldwide, replacing traditional business models. Enterprises can now access the vast majority of software and services online, avoiding the need for expensive investments into IT infrastructure, while covering only costs of infrastructure required to provide connectivity. As a result, they can focus on their core business directly and consume IT services on a pay-as-you-go basis. For operation, cloud computing relies on the network of geographical distributed data centers. Therefore, assessing data center performance is important for understanding the operation of existing data centers and crucial for the design and construction of next generation systems for cloud computing. Data center performance and efficiency can be expressed in terms of the amount of supplied electrical energy that is actually turned into computing power. In Europe, data centers are forecasted to consume up to 93 TWh by 2020 [1]. Almost 75% of this consumption is attributed to the IT and cooling equipment. The remaining 25% is lost in power distribution and facility operation systems. Current research and industry standards propose a number of metrics for assessing efficiency of energy distribution [2], [3] and cooling [4], [5]. The most popular metric used nowadays is Power Usage Effectiveness (PUE) [6]. It measures the portion of the supplied electricity actually delivered to the IT equipment. Unfortunately, most of the available metrics are too generic. They indeed are unable to differentiate between individual IT subsystems. For example, using existing metrics, it is not possible to distinguish the 2159-6190/15 $31.00 © 2015 European Union DOI 10.1109/CLOUD.2015.23
II. C OMMUNICATION M ETRICS FOR C LOUD C OMPUTING DATA C ENTERS This section defines a framework of metrics that characterize performance and energy efficiency of communication systems in cloud computing data centers. Cloud applications, with the only exception for High Performance Computing (HPC), are communication-intensive [9]. Therefore, the communication parameters, such as bandwidth 98
Table I C OMMUNICATION M ETRICS FOR C LOUD C OMPUTING DATA C ENTERS .
Performance
Power
T YPE
M ETRIC
NAME
D ESCRIPTION
CNEE NPUE EPC
Communication Network Energy Efficiency Network Power Usage Effectiveness Energy Proportionality Coefficient
Energy to deliver a single bit of information Ratio between total IT power and power consumed by network equipment Degree of energy proportionality of a device or a system
UDCL UDHD ISCL ISHD DAL BOR UDER ISER ALUR ASDC
Uplink/Downlink Communication Latency Uplink/Downlink Hop Distance Inter-Server Communication Latency Inter-Server Hop Distance Database Access Latency Bandwidth Oversubscription Ratio Uplink/Downlink Error Rate Inter-Server Error Rate Average Link Utilization Ratio Average Server Degree Connectivity
Communication latency between data center gateway and computing servers Hop distance between data center gateway and computing servers Communication latency between computing servers Hop distance between computing servers Average latency of accessing database from computing servers Actual bandwidth servers can exploit under full load Error rate of the paths between data center gateway and servers Error rate of the network paths between computing servers Average link level occupancy Average number of network links per server
capacity, latency and error rate, can affect system performance dramatically. Unfortunately, existing performance and powerrelated metrics that are widely used in the data center industry fail to distinguish communication systems from the category of IT equipment. The proposed metrics address this gap by allowing finer granularity. At the same time, they remain general and intuitive to be universal and applicable to the vast majority of existing data centers and their communication systems. The proposed metrics can be broadly attributed to two categories: power-related and performance-related metrics. Power-related metrics assess energy efficiency of communication systems by analyzing how much of the electric power is actually turned into the work of information delivery. Performance-related metrics analyze communication rate, capacity, and latency for information delivery. Table I summarizes the framework of metrics presented in the following sections.
interchangeably. The CNEE is measured in Watts/bit/second, which is equivalent to joules/bit, or the amount of energy spent by the network to deliver a single bit of information. Network Power Usage Effectiveness: Another measure of the communication system effectiveness is in the power consumed by the network equipment as a fraction of the total power consumed by the IT equipment. This metric is called Network Power Usage Effectiveness (NPUE) and is defined as follows: NPUE =
Communication Network Energy Efficiency: The communication network turns the supplied electricity into the job of information delivery. The efficiency of this process can be measured by the metric Communication Network Energy Efficiency (CNEE): Power Consumed by Network Equipment Effective Network Throughput Capacity
.
.
(2)
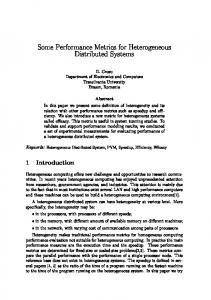
NPUE defines the fraction of the power consumed by the IT equipment used to operate the network. Similarly, PUE [6] measures the portion of the amount of energy used by a data center facility that is delivered to power IT equipment. NPUE values can range from 1 to infinity. For example, for NPUE equal to 6 for every 6 Watts consumed by IT equipment, 1 Watt is devoted to operate network equipment. The NPUE value equal to 1 corresponds to the system where all the IT-related power is consumed by the network equipment, which is a not desirable target: if all the IT power is consumed by the network equipment, there is nothing left for computing servers. However, NPUE values approaching 1 are not necessarily symptoms of network inefficiency. It can signal that the computing servers were upgraded and became more energy efficient. Energy Proportionality Coefficient: Ideally, energy consumption of network devices should be proportional to their workload. However, in reality neither computing servers nor network switches are energy proportional. Many servers consume up to 66% of their peak power consumption when idle [11]. For network switches this ratio is even higher and can reach 85% [12]. Energy Proportionality Coefficient (EPC) can be measured as energy consumption of a system or a device as a function of the offered load. In the ideal case, represented by a straight line in Fig. 1, every increase in load l should correspond to the equivalent increase in power consumption P . In reality,
A. Power-Related Metrics
CNEE =
Total Power Consumed by IT Equipment Power Consumed by Network Equipment
(1)
The data center network equipment includes all the hardware components that take part in information delivery between servers, including network switches, routers, communication links, and Network Interface Cards (NICs) of the servers1 . The effective network throughput capacity is a maximum end-to-end throughput offered by the network to the computing servers. In the context of this paper, the terms “computing servers” and “servers” are used 1 The servers, excluding their NICs, are considered to be devoted to computing and not as a communication equipment.
99
Power Consumption P
π/2
dP dl
Ppeak
−1
α
1
Observed Pidle
Ideal
π
0
−1
1
0
1 3π/2
Normalized Load l
Figure 1.
Energy proportionality.
Figure 2.
the observed power consumption is often non-linear. Its energy proportionality varies depending on the incline with the respect to the ideal case. To analyze this deviation, a tangent line can be built at every point to the observed curve. The angle of this tangent line α can be obtained by computing the first derivative of the observed function: tan α = dP/dl. Having tan α we can define the measure of energy proportionality as follows: Z 1 Z 1 2 tan α EPC = sin 2α dl = dl. (3) 1 + tan2 α 0 0
Energy Proportionality Coeffient (EPC).
connecting idle and peak power consumption values. Positive LDR values indicate that the measured power is above the line, while negative values are for the measured power below the line. When power consumption is perfectly linear, the LDR is equal to 0. Unlike other existing metrics, EPC is able to express energy proportionality of a device or a system in every point of the observed power consumption, for any load level allowing more accurate estimation. In contrast, EPI and IPR depend only on idle and peak power consumptions and LDR depends only on the absolute value of the highest deviation from a fully proportional case. Similar to EPC, EPI can be computed considering angles of ideal and measured power consumption functions. However, the functions where energy remains constant with the increase in the workload are not taken into account. EPC, instead, can differentiate between constant and non-constant functions.
Fig. 2 plots the values of EPC metric for different values of α in polar coordinates. For α = π/4, which corresponds to a fully proportional case where each increase in the system load leads to an equal increase in energy consumption, EPC is equal to 1. On the contrary, for α = −π/4, which means for every increase in the system load the energy consumption is equally decreased, the EPC is equal to −1. In between, EPC turns to zero for α = 0, which describes the case when system energy consumption is constant and does not depend on the load, and α = π/2, which is the asymptote of the power consumption function. Energy proportionality has been first discussed for computing servers [13] and then for network equipment [14]. Several metrics evaluating energy proportionality have already been proposed in the literature. The Energy Proportionality Index (EPI) [12] captures the difference between the measured power and the ideal power, the power that the device should consume if it is fully energy proportional. EPI is expressed through the idle and peak power only. EPI equal to zero shows that the energy consumption is agnostic to the workload, while EPI equal to 100 % indicates that the device is fully energy proportional. The Idle-to-peak Power Ratio (IPR) and the Linear Deviation Ratio (LDR) [15] measure the ratio between the idle and the peak power consumptions and deviation of the observed power consumption from the fully proportional case respectively. The IPR values tending to zero indicate energy proportional designs. LDR, instead, measures maximum deviation of the power consumption from a straight line
B. Performance-Related Metrics Cloud computing systems provide on-demand access to the pool of shared computing resources over the Internet. Therefore, communication processes, not computing, often define the efficiency of the cloud. In this section, we present a set of metrics which capture performance and describe energy efficiency of data center communication systems. Network Latency: Cloud applications are found to be extremely sensitive to communication delays [9], [16]. Therefore, an ability to monitor and control network latency is especially important to guarantee Quality of Service (QoS) and Service Level Agreements (SLAs). The Uplink/Downlink Communication Latency (UDCL), or Uplink/Downlink Hop Distance (UDHD) if expressed in the number of hops, measures the time (in seconds) needed for an incoming to the data center request to reach a computing server (downlink) or the time it takes for a computing result to leave the data center network (uplink) and be on the way to the end user. UDCL is added on top of the task execution time for every user request. Network topologies hosting computing servers closer to the data center gateway have smaller UDCL and can provide faster response times. 100
Uplink/Downlink Latency (UDCL/UDHD) Inter-server Latency (ISCL/ISHD)
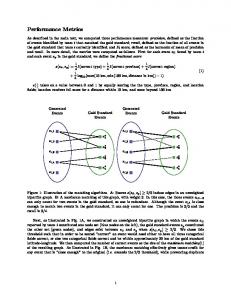
ingress and aggregate egress bandwidth of a network switch [23]. For example, in a typical three-tier topology (see Fig. 3), Top-of-Rack (ToR) switches are equipped with two 10 Gb/s links to the aggregation network and can support up to 48 servers in the access network, each connected with a 1 Gb/s link. This entails Bandwidth Oversubscription Ratio (BOR) of (48 Gb/s)/(20 Gb/s) = 2.4 : 1, which corresponds to a per-server bandwidth of (1 Gb/s)/2.4 = 416 Mb/s under full load. Further bandwidth aggregation of 1.5:1 occurs at the aggregation level, where each switch has eight 10 Gb/s links to the core network and twelve 10 Gb/s links to the access network. As a result, the per-server available bandwidth can be as low as (416 Mb/s)/1.5 = 277 Mb/s in a fully loaded topology [23]. Server-centric architectures do not introduce points of bandwidth oversubscription. As a result, BOR is equal to 1. Computing BOR is important to estimate the minimum non-blocking bandwidth available to every server. When the computing servers produce more traffic that the available bandwidth, ToR and aggregation switches can become congested and start to drop packets from the overflowed buffers, significantly degrading performance of cloud applications. Network Losses: The packets travelling in a data center network may be lost and fail to reach destination due to link errors. These errors may cause significant communication delays, as retransmissions are performed only at the transport layer using TCP protocol. Therefore, measuring error rates is important to assure network performance and to help detecting hardware faults. In addition, it allows diversifying resource allocation strategies that take into account sensitivity of cloud applications to transmission errors. In data centers, interconnection links are not identical. For example, a typical fat-tree three-tier architecture (see Fig. 3) contains optical 10 Gb/s links with per-link Bit Error Rate (BER) in the range of 10−12 to 10−18 in the core and access layers. While in the access layer a less expensive twisted pair gigabit Ethernet technology is used with BERs as high as 10−10 . Knowing the topology and characteristics of the network links, it becomes possible to calculate average endto-end error rates depending on the communication paths involved, e.g., servers-to-gateway or servers-to-servers. In this paper we define two metrics for error rate estimation. The first is the Uplink/Downlink Error Rate (UDER). UDER measures average BER on the paths between data center gateway and computing servers and is defined as follows:
Internet
Gateway Router Core Layer Aggregation Layer Access Layer Computing Servers
Figure 3.
Three-tier architecture.
Another important metric is Inter-Server Communication Latency (ISCL), or Inter-Server Hop Distance (ISHD) if expressed in the number of hops. These metrics measure the time (in seconds), or the number of hops, it takes for one task to communicate with another task executed on a different server: N
ISHD =
X 1 N (N − 1) i=1
N X
hij ,
(4)
{j=1, j6=i}
where N is the total number of servers, and hij is the number of hops between the servers i and j. ISCL and ISHD are particularly relevant for cloud applications whose execution can be parallelized. Their tasks will need to exchange data and will perform faster in network architectures with fewer hops between servers and smaller inter-server delays. However, inter-server delays will make no difference for standalone applications whose execution is confined to single server. In addition to measuring average values, it is important to analyze deviation in the distribution of inter-server delays. Small deviation values will characterize data center networks with small distances between computing servers (e.g., switchcentric architectures, such as Al-Fares et al. proposal [17], PortLand [18] and VL2 [19]), and allow placement of interdependent tasks at any server, not depending on its location. However, for data centers with highly variable inter-server delays, such as server-centric architectures like BCube [20] and DCell [21], it becomes highly beneficial to consolidate heavily communicating tasks to reduce network delays and improve performance. The third delay-related metric is the Database Access Latency (DAL). DAL is defined as an average Round-Trip Time (RTT) measured between computing servers and the data center database. DAL is measured in seconds. An overwhelming majority of cloud applications store and obtain data from database [9]. Thus, reducing the time required for sending a query and receiving data can significantly speed up performance. As an alternative to bringing databases physically closer, a number of data replication techniques can be employed [22]. Data replication reduces DAL for the cached data, but can also introduce traffic overhead for propagating replica updates in the system. Fig. 3 illustrates the aforementioned delays in a the three-tier architecture. Bandwidth Oversubscription Ratio: Bandwidth oversubscription can be defined as the ratio between the aggregate
UDER =
N L 1 XX · BERnl , N n=1
(5)
l=1
where N is the number of computing servers, L is the number of hierarchical layers in network topology and BERnl is the BER of the layer l link interconnecting server n with the data center gateway. The Inter-Server Error Rate (ISER), instead, evaluates the 101
III. E VALUATION AND N UMERICAL E XAMPLES
average error rate of inter-server communications: N X 1 ISER = · N (N − 1) i=1
N X
BERij ,
This section presents evaluation and numerical comparison of the proposed metrics in categories of power, performance, and network traffic of data center communication systems.
(6)
{j=1, j6=i}
where N is the number of computing servers and BERij is the BER of the path interconnecting server i and server j. The latter is calculated as a sum of BERs of all links between servers i and j. Average Link Utilization Ratio: Average Link Utilization Ratio (ALUR) shows average traffic load on data center communication links and can be defined as follows: ALUR =
Ni 1 X · un , Ni n=1
A. Evaluation Scenario Several data center architectures have been proposed in the literature [24]. For evaluation purposes, we consider the following three architectures: fat-tree three-tier [17]–[19], BCube [20] and DCell [21]. For a fair comparison, all the architectures are configured to host 4096 computing servers. In the fat-tree three-tier topology, the servers are arranged into 128 racks and served by 8 core and 16 aggregation switches. The core and aggregation switches as well as the aggregation and access switches are interconnected using 10 Gb/s, 0.24 µs optical links. The links connecting computing servers and access network ToR switches are 1 Gb/s, 0.01 µs twisted pair links. In BCube and DCell topologies, the servers are arranged in groups of n = 8. This entails a BCube architecture of level k = 4 with 3 layers of commodity switches per group of servers and a level k = 2 DCell. The 1 Gb/s links are used to interconnect computing servers with the commodity switches. In the lowest layer these links are 2 meters long, while in the upper layers they are 10 and 50 meters long respectively. The gateway router is connected to the data center network through a number of load balancers using 50 m long, 40 Gb/s optical fibers. In all architectures, optical fibers are assumed to support single-mode light propagation for a 1550 nm operating wavelength.
(7)
where un is the utilization ratio of link n and Ni is the number of links of type i. ALUR is an aggregate network metric and is designed to improve analysis of traffic distribution and load levels in different parts of the data center network. It helps to define proper traffic management policies, can be used to detect network hotspots and becomes an essential tool for preventing performance degradation of cloud applications due to network congestion. For a fat-tree three-tier topology ALUR can be measured separately for the access, aggregation and core segments of the network. A high congestion in any of these segments will signal the need to increase capacity of network links and switches or even reconsider bandwidth oversubscription ratios between these segments. For BCube and DCell topologies, ALUR can be measured on server-to-server and server-toswitch segments of the network. Average Server Degree Connectivity: Depending on the design strategy, data center topologies are either switchcentric or server-centric. In switch-centric architectures, such as fat-tree, each server is usually connected to a single ToR switch with only one link. In server-centric architectures, instead, the computing servers are connected to several commodity switches (BCube) and/or a number of other servers (DCell) to increase network capacity and provide resilience to node and switch failures. A higher degree of connectivity increases network capacity, makes the whole topology fault tolerant and helps to balance the load. However, having a high number of connections increases network power consumption as more links and NICs have to be deployed and utilized. To analyze how well the computing servers are connected, Average Server Degree Connectivity (ASDC) can be computed: ASDC =
N 1 X · cn , N n=1
B. Evaluation of Power-Related Metrics In this section we evaluate power-related metrics, including CNEE, NPUE and EPC, for different data center architectures. Evaluation of Network Energy and Power Usage Effectiveness: For obtaining CNEE and NPUE it is necessary to calculate the power consumption of the computing servers and network equipment as the load of the data center increases. This increase can be not linear as waking up new servers in already operational racks does not require waking up additional network switches. However, starting up a new rack would require powering on the top-of-rack switch and possibly aggregation and core switches. To estimate the power consumption of a single server we selected the most widely used hardware models from different vendors, Dell PowerEdge R720, Huawei Tecal RH2288H V2, and IBM System x3500 M4, and computed their average peak and idle power consumptions. Assuming the servers implement Dynamic Voltage and Frequency Scaling (DVFS), their power consumption P (l) can be estimated as follows [25]:
(8)
where N is a total number of data center servers and a number of cn network links connects server n to other devices, switches and/or servers.
P (l) = Pidle + 102
l Ppeak − Pidle · (1 + l − e−( τ ) ), 2
(9)
2
Power Consumption P (W)
1
Table II E VALUATION OF P OWER - RELATED M ETRICS .
·106 Power Consumed by Servers Power Consumed by Network
M ETRICS
0.75
CNEE NPUE
0.5
0
Figure 4.
0.2
0.4 0.6 0.8 Normalized Load l
Three-tier
BCube
DCell
0.203 µJ/bit 3.58
0.109 µJ/bit 2.50
0.027 µJ/bit 6.86
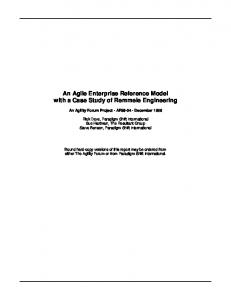
higher number of switches when compared with the threetier topology. However, these are commodity switches whose power consumption is several magnitudes lower that the consumption of core and aggregation level switches. Evaluation of Energy Proportionality: Fig. 5 shows normalized power consumption along with the computed EPC values for several network switch profiles. The dashed line represents an ideal case with EPC equal to 1. Switch 1 shows a curvilinear behavior. For intermediate loads in the range (0.2, 0.8), the power consumption increases at a smaller rate than the workload, while for the low (< 0.2) and high (> 0.8) load levels it increases more rapidly than the incoming workload. As a result, the obtained EPC is equal to 0.69. With EPC equal to 0.2, switch 2 shows a realistic energy consumption profile with a large idle part and a stepwise power consumption attributed to communication ports. This is very close to the case represented by Switch 3. Being completely insensitive to the workload, EPC value of Switch 3 is equal to 0.
0.25
0
A RCHITECTURES
1
IT power consumption in fat-tree three-tier data center.
where l is the load of the server and τ is the utilization level at which servers attain asymptotic power consumption, which is typically in the range [0.5, 0.8]. For network equipment we considered HP FlexFabric 11908 to be used in the aggregation and core layers of the fattree three-tier architecture, and HP 5900 AF for the ToR and the commodity switches in BCube and DCell architectures. Fig. 4 shows normalized power consumption of the data center IT equipment for a fat-tree three-tier architecture. The power consumed by the servers excludes NIC consumption, which is included in network power consumption. The leaps highlighted in the zoomed part correspond to a server wake up in a previously idle rack. It causes a wake up of the access, aggregation and core layer switches and leads to non-proportionality in network power consumption. The CNEE computed for all the considered data center architectures is reported in the first row of Table II. The CNEE is the highest for the fat-tree three-tier topology, which is mainly caused by bandwidth oversubscription. As a result, the energy is spent to support higher bitrates, but they cannot be fully utilized by the servers. In contrast, the throughput in BCube and DCell architectures can achieve 100 % of the network capacity. CNEE, besides being sensitive to bandwidth oversubscription, also depends on the overall network power consumption. This is the reason why CNEE is higher for BCube than for DCell. BCube hosts a large number of commodity switches (k + 1) · nk (2048), while DCell has only one commodity switch per group of n servers (512). Having evaluated energy spent to deliver a single bit of information, it is possible to assess the overall power effectiveness of data center networks with NPUE. With the lowest NPUE, BCube appears to be the most powerhungry topology. As already mentioned, it is due to the fact that BCube hosts a high number of switches. In addition to the number of network devices, their power efficiency plays an important role in NPUE. For example, DCell has a
C. Evaluation of Performance-Related Metrics This subsection presents evaluation results of the proposed metrics for network latency (UDCL, UDHD, ISCL, ISHD, DAL), network losses (UDER, ISER) and connectivity (ASDC) with the sole exception of BOR and ALUR. Servercentric architectures typically do not introduce points of bandwidth multiplexing and oversubscription, which makes their BOR metric to be equal to 1. Computing ALUR metric requires having per-link traffic statistics, which can be obtained either from detailed traces or, more realistically, directly measured in real data centers during runtime. Network Latency, Network Losses and Server Degree Connectivity: To evaluate UDCL, ISCL, DAL, UDER and ISER we considered transmission of two test packets of 40 Bytes and 1500 Bytes, corresponding to a TCP acknowledgement and a maximum Ethernet transmission unit respectively. A one-way transmission delay is measured for UDCL and ISCL, and a round-trip delay for DAL. For signal losses, a BER of 10−12 is considered for copper cables and 10−14 for optical fibers. As no other traffic is present in the data center network, Ethernet inter-frame gap and thus queuing delays can be neglected. The network delay of a single packet is composed of the transmission delay Dt and link propagation delay Dp . Dt is expressed as a ratio between packet size S and link rate R, while Dp is defined as the link length L over the signal propagation speed P . P defines the physical characteristic of the medium. In copper it is two thirds of the light speed
0.4 0.6 0.8 Normalized Load l
103
1
Ideal profile: EPC = 1
0.8
Switch 1: EPC = 0.69
Table III E VALUATION OF P ERFORMANCE M ETRICS . M ETRICS
Switch 2: EPC = 0.2
0.6
1500 B 40 B
Normalized Power Consumption
1
Switch 3: EPC = 0
0.4 0.2
Figure 5.
0
0
0.2
0.4 0.6 0.8 Normalized Load l
1
UDCL ISCL UDCL ISCL UDHD ISHD UDER ISER ASDC
A RCHITECTURES Three-tier
BCube
DCell
1.45 µs 1.98 µs 15.7 µs 28.34 µs 4 5.78 1.03 · 10−12 1.772 · 10−12 1
1.38 µs 3.93 µs 14.47 µs 73.72 µs 3 7.00 1.02 · 10−12 4.206 · 10−12 4
1.19 µs 4.73 µs 15.50 µs 93.92 µs 3 8.94 1.02 · 10−12 5.336 · 10−12 2.79
The proposed metrics are easy-to-integrate metrics into existing data center monitoring systems, such as VMware vCenter Log Insight or Cisco Prime Data Center Network Manager. Most data center monitoring systems already provide information that is required for computing these metrics, including runtime power consumption, link utilization levels or error rates. The data center monitoring software, such as vCenter Log Insight, maintains statistics for each server, for example the status of the links. Consequently, a simple query of the average for each server number of active links will allow computing of ASDC metric. The availability of up-todate link- and traffic-related statistical information enables the design of network-aware resource allocation and scheduling solutions [26], [27]. Table IV provides a top-level comparison of the evaluated data center architectures. For the purpose of simplicity, the values are reported as high (H), medium (M) and low (L). High bandwidth oversubscription of the three-tier architecture prevents computing servers from exploiting full available network capacity and leads to the highest energyper-bit consumption. DCell appears as the most “green” architecture with the lowest energy-per-bit ratio and high power usage effectiveness. BCube is less effective in terms of the power usage effectiveness as it hosts the highest number of switches. The analysis of communication latency shows that hierarchical architectures, such as three-tier fat-tree, favor internal server-to-server communications, while distributed data center architectures, including BCube and DCell have shorter paths for the traffic directed out of the data center.
Power consumption profiles of different network switches.
c, while in the optical fiber the speed of light is scaled with the refractive index, taken to be equal to 1.468 as for the glass fiber. Table III presents the results for network latency, losses and connectivity related metrics. The results show that the DCell architecture can provide better support to internal communications with ISCL, ISHD and ISER all being lower in comparison to the other architectures. With respect to BCube and DCell, the three-tier topology supports internal communications better. This might be surprising as the threetier connectivity degree measured with ASDC is the lowest among all architectures. However, both BCube and DCell, while being much better interconnected, need to traverse a large number of hops to communicate between distant servers. The error rate between servers, measured by ISER, is the highest for BCube and DCell due to their heavy reliance on copper links. The error rate between servers and the gateway, measured with UDER, on the contrary, is lower in BCube and DCell as packets sent by the servers traverse fewer number of hops to reach the gateway. IV. D ISCUSSION The proposed framework of metrics is essential for both the optimization of operation and planning capacity extensions of existing facilities as well as the design of future data centers. This sections highlights important features of the framework, including the fine-grain level of analysis it provides and the ease of integration in existing data centers. In addition, a top-level comparison of data center architectures is presented based on findings of Section III. The power-related metrics (see Section II-A), such as NPUE, assess with a fine granularity energy efficiency of the network and allow data center operators to optimize their investments in networking equipment and interconnects. The performance-related metrics (see Section II-B), such as ALUR, enable detailed monitoring and assessment of network throughput, delay and error rate performance. They are especially relevant for the largest class of SaaS cloud applications which often communicate intensively with the end users and also internally. The analysis of these metrics helps to ensure and guarantee QoS and SLA to the customers.
V. C ONCLUSION The paper proposes a new framework of metrics to assess efficiency of communication networks in cloud computing data centers. These metrics investigate network efficiency from energy and performance perspectives. The evaluation and validation of the framework has been performed for hierarchical (three-tier) and distributed (BCube and DCell) data center architectures. The results helped to unveil a number of properties for different architectures. The proposed framework of metrics is positioned to become an essential tool for academy researchers and industry specialists in the field of communication systems and cloud computing data centers. The future work will be related to the 104
Table IV P ERFORMANCE COMPARISON OF EVALUATED ARCHITECTURES . VALUES ARE CATEGORIZED AS (H) H IGH , (M) M EDIUM AND (L) L OW. A RCHITECTURES
M ETRICS CNEE
NPUE
UDCL
UDHD
ISCL
ISHD
DAL
UDER
ISER
ASDC
Three-tier
H
M
M
M
L
M
H
L
H
L
H
BCube
M
L
M
L
H
H
M
L
H
M
M
DCell
L
H
M
L
H
H
M
L
H
M
L
proposal of the presented set of metrics for standardization and performing evaluation in operational data centers.
MMTE
[15] G. Varsamopoulos and S. K. S. Gupta, “Energy Proportionality and the Future: Metrics and Directions,” in 39th International Conference on Parallel Processing Workshops (ICPPW), 2010, pp. 461–467. [16] P. Fan, J. Wang, Z. Zheng, and M. Lyu, “Toward Optimal Deployment of Communication-Intensive Cloud Applications,” in IEEE International Conference on Cloud Computing (CLOUD), 2011, pp. 460–467. [17] M. Al-Fares, A. Loukissas, and A. Vahdat, “A scalable, commodity data center network architecture,” in Proceedings of the ACM SIGCOMM 2008 Conference on Data Communication, 2008, pp. 63–74. [18] R. Niranjan Mysore, A. Pamboris, N. Farrington, N. Huang, P. Miri, S. Radhakrishnan, V. Subramanya, and A. Vahdat, “PortLand: a scalable fault-tolerant layer 2 data center network fabric,” in ACM SIGCOMM Computer Communication Review, vol. 39, no. 4, 2009, pp. 39–50. [19] A. Greenberg, J. R. Hamilton, N. Jain, S. Kandula, C. Kim, P. Lahiri, D. A. Maltz, P. Patel, and S. Sengupta, “VL2: a scalable and flexible data center network,” in ACM SIGCOMM Computer Communication Review, vol. 39, no. 4, 2009. [20] C. Guo, G. Lu, D. Li, H. Wu, X. Zhang, Y. Shi, C. Tian, Y. Zhang, and S. Lu, “BCube: a high performance, servercentric network architecture for modular data centers,” ACM SIGCOMM Computer Communication Review, vol. 39, no. 4, pp. 63–74, 2009. [21] C. Guo, H. Wu, K. Tan, L. Shi, Y. Zhang, and S. Lu, “DCell: a scalable and fault-tolerant network structure for data centers,” in ACM SIGCOMM Computer Communication Review, vol. 38, no. 4. ACM, 2008, pp. 75–86. [22] D. Boru, D. Kliazovich, F. Granelli, P. Bouvry, and A. Y. Zomaya, “Energy-Efficient Data Replication in Cloud Computing Datacenters,” Springer Cluster Computing, vol. 18, no. 1, pp. 385–402, 2015. [23] “Cisco Data Center Infrastructure 2.5 Design Guide,” 2007, White Paper. [24] M. Bari, R. Boutaba, R. Esteves, L. Granville, M. Podlesny, M. Rabbani, Q. Zhang, and M. Zhani, “Data center network virtualization: A survey,” Communications Surveys Tutorials, IEEE, vol. 15, no. 2, pp. 909–928, 2013. [25] “Server power and performance characteristics,” http://www. spec.org/power_ssj2008/. [26] D. Kliazovich, S. Arzo, F. Granelli, P. Bouvry, and S. Khan, “e-STAB: Energy-efficient scheduling for cloud computing applications with traffic load balancing,” in IEEE International Conference on Green Computing and Communications (GreenCom), 2013. [27] M. Guzek, D. Kliazovich, and P. Bouvry, “HEROS: Energyefficient load balancing for heterogeneous data centers,” in IEEE International Conference on Cloud Computing (CLOUD), 2015.
ACKNOWLEDGMENT The authors would like to acknowledge the funding from National Research Fund, Luxembourg in the framework of ECO-CLOUD project (C12/IS/3977641). R EFERENCES [1] Grant Sauls - Falcon Electronics, “Measurement of data centre power consumption,” White Paper. [2] P. A. Mathew, S. E. Greenberg, S. Ganguly, D. A. Sartor, and W. F. Tschudi, “How does your data center measure up? Energy efficiency metrics and benchmarks for data center infrastructure systems,” HPAC Journal, 2009. [3] L. Wang and S. U. Khan, “Review of performance metrics for green data centers: a taxonomy study,” The Journal of Supercomputing, vol. 63, no. 3, pp. 639–656, 2013. [4] M. K. Herrlin, “Airflow and cooling performance of data centers: Two performance metrics.” ASHRAE Transactions, vol. 114, no. 2, pp. 182 – 187, 2008. [5] R. Tozer and M. Salim, “Data center air management metricspractical approach,” in 12th IEEE Intersociety Conference on Thermal and Thermomechanical Phenomena in Electronic Systems (ITherm), 2010, pp. 1–8. [6] The Green Grid, “Data center power efficiency metrics: PUE and DCiE,” 2008, White Paper. [7] D. Kliazovich, P. Bouvry, F. Granelli, and N. Fonseca, “Energy consumption optimization in cloud data centers,” in Cloud Services, Networking, and Management, edited by N. Fonseca and R. Boutaba, Eds. Wiley-IEEE Press, May 2015. [8] L. Dignan, “Cloud computing market,” 2011, ZNet. [9] D. Kliazovich, J. E. Pecero, A. Tchernykh, P. Bouvry, S. U. Khan, and A. Y. Zomaya, “CA-DAG: Modeling Communication-Aware Applications for Scheduling in Cloud Computing,” Journal of Grid Computing, 2015. [10] Cisco, “Cisco Global Cloud Index: Forecast and Methodology, 2012-2017,” 2013, White Paper. [11] G. Chen, W. He, J. Liu, S. Nath, L. Rigas, L. Xiao, and F. Zhao, “Energy-Aware Server Provisioning and Load Dispatching for Connection-Intensive Internet Services.” in NSDI, vol. 8, 2008, pp. 337–350. [12] P. Mahadevan, P. Sharma, S. Banerjee, and P. Ranganathan, “A power benchmarking framework for network devices,” in NETWORKING 2009. Springer, 2009, pp. 795–808. [13] L. Barroso and U. Holzle, “The Case for Energy-Proportional Computing,” Computer, vol. 40, no. 12, pp. 33–37, 2007. [14] D. Abts, M. R. Marty, P. M. Wells, P. Klausler, and H. Liu, “Energy proportional datacenter networks,” in ACM SIGARCH Computer Architecture News, vol. 38, no. 3, 2010, pp. 338– 347. 105