Biological Psychology 102 (2014) 73–87
Contents lists available at ScienceDirect
Biological Psychology journal homepage: www.elsevier.com/locate/biopsycho
Performance monitoring during associative learning and its relation to obsessive-compulsive characteristics a,∗ ˜ Nuria Donamayor , Jakob Dinani a , Manuel Römisch a , Zheng Ye b , Thomas F. Münte a a b
Department of Neurology, Universität zu Lübeck, Germany Donders Centre for Cognitive Neuroimaging, Radboud Universiteit Nijmegen, The Netherlands
a r t i c l e
i n f o
Article history: Received 25 September 2013 Accepted 17 July 2014 Available online 27 July 2014 Keywords: Electroencephalography Error-related negativity Feedback-related negativity Obsessive-compulsive disorder Reinforcement learning
a b s t r a c t Neural responses to performance errors and external feedback have been suggested to be altered in obsessive-compulsive disorder. In the current study, an associative learning task was used in healthy participants assessed for obsessive-compulsive symptoms by the OCI-R questionnaire. The task included a condition with equivocal feedback that did not inform about the participants’ performance. Following incorrect responses, an error-related negativity and an error positivity were observed. In the feedback phase, the largest feedback-related negativity was observed following equivocal feedback. Theta and beta oscillatory components were found following incorrect and correct responses, respectively, and an increase in theta power was associated with negative and equivocal feedback. Changes over time were also explored as an indicator for possible learning effects. Finally, event-related potentials and oscillatory components were found to be uncorrelated with OCI-R scores in the current non-clinical sample. © 2014 Elsevier B.V. All rights reserved.
1. Introduction 1.1. Monitoring performance by internal and external information It is well known (Falkenstein, Hohnsbein, Hoormann, & Blanke, 1990, 1991; Gehring, Coles, Meyer, & Donchin, 1995; Gehring, Goss, Coles, Meyer, & Donchin, 1993) that the production of erroneous responses elicits a negative deflection of the event-related potential (ERP) over fronto-central electrodes about 100 ms postresponse. This error-related negativity (ERN) is followed by a positive deflection around 250 ms: the error positivity (PE ). Similarly, a fronto-central negative component, the feedback-related negativity (FRN), is observed around 300 ms after negative feedback (Gehring & Willoughby, 2002; Holroyd, Hajcak, & Larsen, 2006; Miltner, Braun, & Coles, 1997). The FRN is superimposed on a P300, one of the first components described in relation to feedback (e.g. Sutton, Tueting, Hammer, & Hakerem, 1978), and is known to be modulated by reward magnitude and expectancy (Hajcak, Holroyd, Moser, & Simons, 2005; Nieuwenhuis, Yeung, Holroyd, Schurger, & Cohen, 2004; Yeung & Sanfey, 2004).
∗ Corresponding author at: Dept. of Neurology, University of Lübeck, Ratzeburger Allee 160, 23538 Lübeck, Germany. Fax: +49 4515005457. ˜ E-mail address:
[email protected] (N. Donamayor). http://dx.doi.org/10.1016/j.biopsycho.2014.07.013 0301-0511/© 2014 Elsevier B.V. All rights reserved.
In the frequency domain, oscillatory activity in the lower frequency bands has been associated to incorrect responses. A number of studies have found fronto-central delta activity ( .05. Bonferroni-corrected post hoc t-tests (Supplementary Table 2) showed largest differences at central (Cz) and parietal (P3, Pz, P4) electrodes, evidencing the centro-parietal topography of the PE . 3.2.2. Feedback The feedback-locked ERPs following negative and equivocal feedback showed negative deflections consistent with the FRN (Fig. 2B). The FRN peaked earlier (around 280 ms) and was larger in the case of equivocal feedback, when it was also followed by a larger positive deflection around 390 ms, whereas the smaller FRN following negative feedback peaked around 302 ms and was also followed by a smaller P300, which peaked around 366 ms. The 3 × 3 repeated-measures ANOVA on the time window of the FRN (220–330 ms) showed significant differences between feedback types, F(2,64) = 50.62, p < .001, electrodes, F(1.38,44.34) = 8.25, p < .005, and an interaction, F(2.35,75.07) = 9.36, p < .001. The 3 × 5 × 2 repeated-measures ANOVA on the anterior-posterior and lateral electrodes also showed a significant effect of feedback type, F(2,64) = 61.52, p < .001, and the interactions between feedback type and anterior-posterior, F(3.04,97.27) = 10.86, p < .001, and feedback type, anterior-posterior and laterality, F(4.21,134.81) = 3.11, p < .05, but the interaction between feedback type and laterality was not significant, p > .05. Bonferroni-corrected post hoc t-tests (Supplementary Table 3) evidenced that the ERP following equivocal feedback was significantly more negative than the ERP following positive feedback in all analyzed electrodes, but especially large over frontal (F3, Fz, F4), reflecting the topography shown in Fig. 2B. In contrast, the ERP following negative feedback had a significantly more positive amplitude than that following
N. Do˜ namayor et al. / Biological Psychology 102 (2014) 73–87
77
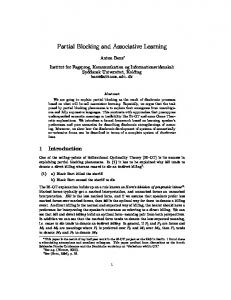
Fig. 1. Above: Mean (SEM) number (left) and reaction times (right) of correct and incorrect responses during the whole task. Below: Mean (SEM) number (left) and reaction times (right) of correct and incorrect responses during the first and second halves of the blocks.
Table 1 Scores in the six subscales of the OCI-R questionnaire. Note that every subscale is comprised of three items. Responses were given using a Likert-type scale from 0 (gar nicht [not at all]) to 4 (sehr stark [very strongly]) points.
Mean Standard deviation Range
Obsessing
Washing
Checking
Ordering
Hoarding
Neutralizing
1.97 1.89 0–9
1.15 1.58 0–7
2.52 1.94 0–8
3.67 2.45 0–11
3.24 2.68 0–10
1.61 1.84 0–8
positive feedback in all except the frontal electrodes, with this difference being larger over parieto-occipital electrodes (Pz, P4, O1, O2), as can be observed in the scalp topography. The 3 × 3 repeated-measures ANOVA performed on the base-topeak amplitudes showed significant differences between feedback types, F(2,64) = 85.07, p < .001, and the interaction between feedback type and electrode site, F(2.32,74.26) = 5.81, p < .005, but no main effect of electrode, p > .05. Bonferroni-corrected post hoc ttests (Supplementary Table 4) indeed showed that the FRN was significantly more negative following equivocal feedback than positive feedback in all three electrode sites, and significantly more negative following negative than positive feedback in Fz and Cz. The 3 × 3 repeated-measures ANOVA performed on the P300 (350–490 ms) showed main effects of feedback type, F(2,64) = 35.63, p < .001, electrode site, F(1.58,50.51) = 6.10, p < .01, and a significant interaction between both factors, F(3.14,100.62) = 11.43, p < .001. The 3 × 5 × 2 repeated-measures ANOVA on the anterior-posterior and lateral electrodes also showed a significant effect of feedback type, F(2,64) = 30.33, p < .001, and the interactions between feedback type and anteriorposterior, F(4.09,130.86) = 22.13, p < .001, and feedback type, anterior-posterior and laterality, F(4.55,145.51) = 4.46, p < .005, but the interaction between feedback type and laterality was not significant, p > .05. Bonferroni-corrected post hoc t-tests (Supplementary Table 5) showed that the P300 following equivocal feedback was significantly larger than that following positive feedback in all electrodes except the occipital ones, and that this difference was especially pronounced over frontal (F3, Fz) and
central (C3, Cz) electrodes, as can be seen in the scalp topography. The P300 was significantly larger following negative than positive feedback in all analyzed electrodes, but especially over parietal (P3, Pz, P4) and occipital (O2) electrodes. In the case of the stimulus-locked ERPs (Supplementary Figure 1A), the 3 × 3 repeated-measures ANOVA computed on the time window used as a baseline of the feedback-locked ERPs (1000–1100 ms) showed significant differences between conditions, F(1.31,42.04) = 8.45, p < .005, and electrode sites, F(1.49,47.92) = 5.92, p < .05, but no interaction between condition and electrode site, p > .05. Bonferroni-corrected post hoc t-tests (Supplementary Table 6) showed that the baseline for incorrect feedback following incorrect responses was significantly or marginally significantly more negative than for correct feedback following correct responses in Fz and Cz, whereas the baseline of the equivocal feedback did not differ from that of the positive feedback (note that, with a 17% error rate, equivocal feedback mostly followed correct responses). The 3 × 3 repeated-measures ANOVA on the stimulus-locked time window of the FRN (1320–1430 ms) showed significant differences between feedback types, F(2,64) = 6.12, p < .005, electrode sites, F(2,64) = 41.83, p < .005, and a significant interaction, F(3.01,96.29) = 11.26, p < .001. Bonferroni-corrected post hoc t-tests (Supplementary Table 7) evidenced that the ERP following equivocal feedback was significantly more negative than that following positive feedback in the three midline electrodes, whereas the ERP following negative feedback was only significantly more negative that that following positive feedback at Fz.
78
N. Do˜ namayor et al. / Biological Psychology 102 (2014) 73–87
Fig. 2. (A) Response-locked ERPs following correct and incorrect responses, and topographies of the difference between incorrect and correct responses in the time windows of the ERN (40–130 ms) and PE (230–330 ms). (B) Feedback-locked ERPs following positive, negative and equivocal feedback, and topographies of the differences between equivocal and positive feedback, and negative and positive feedback in the time windows of the FRN (220–330 ms) and P300 (350–490 ms). A 12 Hz low-pass filter was used for a better visualization.
3.2.3. Differences between halves The amplitude of both ERN and PE increased significantly over time (Fig. 3). In the case of the ERN, the difference between erroneous and correct responses increased from −7.88 V (SD = 4.28) in the first half of the blocks to −9.24 V (SD = 5.18) in the second half, t(32) = 2.54, p < .05. The amplitude in the time window of the PE also increased significantly from 5.83 V (SD = 5.71) in the first half to 7.74 V (SD = 5.68) in the second half of the blocks, t(32) = −2.58, p < .05. Although there was a significant effect of feedback type on the peak of the FRN, F(1,32) = 44.43, p < .001, there was no significant effect of half nor the interaction between half and feedback type, p > .05. When using the base-to-peak amplitudes (Supplementary Figure 1B), however, the data showed a significant effect of feedback type, F(1,32) = 56.78, p < .001, as well as an interaction between feedback type and half, F(1,32) = 6.17, p < .05, but no main effect of half, p > .05. Interestingly, although the base-to-peak amplitude following negative feedback did not change between halves, p > .05, the amplitude following equivocal feedback decreased significantly in the second (−5.31 V, SD = 3.16) compared to the first half (−6.55 V, SD = 3.72) of the blocks, t(32) = −2.94, p < .05 (Bonferroni-corrected). The 2 × 2 repeated-measures ANOVA performed on the ensuing P300, while showing no effect of half, p > .05, evinced significant effects of feedback type, F(1,32) = 12.83, p < .001, and the interaction between half and feedback type, F(1,32) = 4.73, p < .05. Indeed (Fig. 3), there was no difference between halves in the case of negative feedback, p > .05, but the amplitude of the P300 following equivocal feedback significantly decreased in the second half of the blocks (5.33 V, SD = 4.85) compared to the first half (7.04 V, SD = 4.86), t(32) = 3.18, p < .01 (Bonferroni-corrected).
3.2.4. Relation to OCI-R scores The regression analysis performed on the response data evidenced that OCI-R scores explained under 1% of the variance in amplitude of both ERN (r = −.004) and PE (r = −.02), p > .05 (Fig. 4). OCI-R scores also did not explain a significant amount of the amplitude variance of the feedback-locked components (Fig. 4), merely explaining 1% of the FRN following negative feedback (r = .10) and under 1% of that following equivocal feedback (r = .09). Similar amounts of variance were explained when using the baseto-peak amplitude of the FRN (following negative feedback: r = .09, and following equivocal feedback: r = .13; Supplementary Figure 1C). In the case of the P300 following negative feedback, OCI-R scores accounted for under 1% of the variance (r = .02), and for 1% in the case of equivocal feedback (r = .11), p > .05. 3.3. Wavelet analysis 3.3.1. Responses The response-locked wavelet analysis (Fig. 5A) showed increased theta power (4–8 Hz) associated with incorrect responses, which started shortly before the actual response (around −50 ms) and held until the end of the analyzed period. Further, a beta boost (13–25 Hz) could be observed starting around 150 ms after correct responses. The 2 × 3 repeatedmeasures ANOVA performed on the theta band (0–250 ms) showed main effects of response type, F(1,32) = 165.58, p < .001, electrode site, F(1.53,49.07) = 31.61, p < .001, and of the interaction, F(1.69,53.97) = 65.80, p < .001. The 2 × 5 × 2 repeated-measures ANOVA on the anterior-posterior and lateral electrodes also showed a significant effect of response type, F(1,32) = 115.54, p < .001, and the interactions between response type and
N. Do˜ namayor et al. / Biological Psychology 102 (2014) 73–87
79
Fig. 3. Comparison of the ERP amplitudes from the first and second halves of each block in the case of responses (above) and feedback (below). Amplitudes refer to differences between incorrect and correct responses, equivocal and positive feedback, and negative and positive feedback.
anterior-posterior, F(1.97,62.96) = 71.47, p < .001, response type and laterality, F(1,32) = 85.87, p < .001, and response type, anterior-posterior and laterality, F(2.88,92.30) = 8.07, p < .001. The Bonferroni-corrected post hoc t-tests (Supplementary Table 8) showed significant differences in all analyzed electrodes except
the occipital ones (O1, O2), and evidenced the fronto-central scalp topography, showing larger values at Fz, C3, Cz and C4. The 2 × 3 repeated-measures ANOVA performed on the beta band (240–450 ms) showed no main effect of electrode site, p > .05, while showing significant effects of response type, F(1,32) = 22.52,
Fig. 4. Results of the linear regression between the individual ERP amplitude and the OCI-R score in the case of responses (above) and feedback (below). Amplitudes refer to differences between incorrect and correct responses, equivocal and positive feedback, and negative and positive feedback.
80
N. Do˜ namayor et al. / Biological Psychology 102 (2014) 73–87
Fig. 5. (A) Response-locked frequency spectra for the difference between correct and incorrect responses; time courses of the analyzed frequency bands for both correct and incorrect responses; and topographies of the difference between correct and incorrect responses in the analyzed time windows for the theta (4–8 Hz, 0–250 ms) and beta bands (13–25 Hz, 240–450 ms). (B) Feedback-locked frequency spectra for the difference between positive and equivocal feedback, and positive and negative feedback; time courses of the theta band for the three types of feedback; and topographies of the difference between positive and equivocal feedback, and positive and negative feedback in the analyzed time window for the theta band (4–8 Hz, 200–500 ms).
N. Do˜ namayor et al. / Biological Psychology 102 (2014) 73–87
p < .001, and a significant interaction between response type and electrode site, F(1.62,51.91) = 3.79, p < .05. The 2 × 5 × 2 repeatedmeasures ANOVA on the anterior-posterior and lateral electrodes also showed a significant effect of response type, F(1,32) = 33.225, p < .001, and the interactions between response type and anteriorposterior, F(1.92,61.42) = 4.35, p < .05, whereas the interactions with laterality were not significant, p > .05. Indeed, Bonferronicorrected post hoc t-tests (Supplementary Table 9) evidenced that the largest differences between conditions were localized in parietal (P3, Pz, P4) and occipital (O2) sensors, as reflected by the parieto-occipital scalp distribution.
3.3.2. Feedback The time-frequency analysis revealed increases in theta power (4–8 Hz) associated with negative and equivocal feedback (Fig. 5B). This theta boost was stronger for equivocal than for negative feedback and lasted from approximately 136–600 ms post-feedback. The 3 × 3 repeated-measures ANOVA (200–500 ms) showed significant differences between feedback types, F(1.52,48.52) = 40.99, p < .001, electrodes, F(1.41,45.17) = 18.78, p < .001, and an interaction between feedback type and electrode site, F(2.18,69.87) = 16.99, p < .001. The 3 × 5 × 2 repeated-measures ANOVA on the anterior-posterior and lateral electrodes also showed a significant effect of feedback type, F(2,64) = 30.33, p < .001, and the interactions between feedback type and anteriorposterior, F(4.09,130.86) = 22.13, p < .001, and feedback type, anterior-posterior and laterality, F(4.55,145.51) = 4.46, p < .005, but the interaction between feedback type and laterality was not significant, p > .05. Bonferroni-corrected post hoc t-tests (Supplementary Table 10) evidenced the frontal distribution of the scalp topographies in both the case of equivocal and negative compared to positive feedback, with larger significant differences over frontal electrodes (Fp1, Fp2, F3, Fz, F4).
3.3.3. Relation between event-related potentials and oscillatory responses The analysis showed that ERN amplitude and post-response theta power (Fig. 6A) were significantly correlated over frontal electrodes (Fp1: r = .45, p < .01; Fp2: r = .48, p < .005; F3: r = .47, p < .01; Fz: r = .48, p < .01), whereas the rest of the analyzed electrodes (F4, C3, Cz, C4, P3, Pz, P4, O1, O2) evidenced no significant correlation, p > .05. In the case of feedback responses (Fig. 6B), there were only significant correlations between the FRN and the theta power following negative feedback in the occipital electrodes (O1: r = −.47, p < .01; O2: r = −.43, p < .05). All other computed correlations, for both negative and equivocal feedback, were not statistically significant, p > .05.
3.3.4. Differences between halves Changes in response-locked theta power and beta power between the first and second halves of the blocks were not statistically significant, p > .05 (Fig. 7). The 2 × 2 repeated-measures ANOVA on the feedback-locked theta power showed a significant main effect of feedback type F(1,32) = 23.09, p < .001, but no significant main effect of half nor interaction between feedback type and half, p > .05 (Fig. 7).
3.3.5. Relation to OCI-R scores The regression analysis performed on the response data (Fig. 8) evidenced that OCI-R scores explained under 1% of the variance in theta power (r = −.07) and merely 7% of the variance in beta power (r = .27), p > .05.
81
OCI-R scores explained under 2% both of the variance in theta power following negative feedback (r = .12) and of that following equivocal feedback (r = −.12), p > .05 (Fig. 8). 4. Discussion In the current study, participants performed an associative learning task analogous to that of Müller et al. (2005). We aimed to replicate the ERP results obtained by Müller et al. (2005), as well as expand them by using wavelet-based time-frequency analysis and relating them to the OC characteristics of the participants. 4.1. Event-related potentials As expected, a fronto-central ERN is found following erroneous ˜ responses (Debener et al., 2005; Donamayor, Heilbronner, et al., 2012; Falkenstein et al., 1991; Gehring et al., 1995; Marco-Pallarés, Càmara, et al., 2008). In contrast to the results of Müller et al. (2005) and probably due to the use of different baselines, the current data evidence the typical PE , which has been linked to error awareness and is thought to have a prominent role in post-error behavioral adjustment (Endrass, Reuter, & Kathmann, 2007; Hughes & Yeung, 2011; Nieuwenhuis, Ridderinkhof, Blom, Band, & Kok, 2001; Shalgi, Barkan, & Deouell, 2009). Although the feedback-locked ERPs appear to have an unusual pattern, the various statistical analyses performed here show that, dovetailing with the previous report (Müller et al., 2005) and with studies showing that the amplitude of the FRN is comparable or greater when feedback is uninformative or neutral than when it is negative (Holroyd et al., 2006; Nieuwenhuis, Slagter, et al., 2005), the current results display an FRN following both negative and equivocal feedback, with larger amplitude following the latter. Interestingly, in the current study, the whole ERP following positive feedback has the smallest amplitude, being therefore the least positive, in contrast to the more common pattern, although similar findings have been previously reported (e.g. Chase et al., 2010; Yeung & Sanfey, 2004). Recently, a study by O’Toole et al. (2012), also using an associative learning task but with trial-error learning, showed that the whole ERP following negative feedback had the most positive amplitude compared to that following positive feedback, once the associations had been learned. Furthermore, the base-to-peak analysis demonstrates that the negative peaks elicited by negative and equivocal feedback around 380 ms are larger than that elicited by positive feedback and are therefore consistent with the FRN. Additionally, the analysis of the stimulus-locked ERPs shows that the apparently unusual configuration of the feedback-locked ERPs is due to the fact that the ERP following correct responses is significantly more positive than that following incorrect responses in the time window used as a baseline for the feedback-locked ERPs. This appears to indicate that, in this study, the second stage of performance monitoring via external feedback is modulated by the first stage of internal monitoring following the response. Given the low overall error rate of the participants, this might be indicative of minor reliance on external feedback compared to internal error monitoring. This would be in agreement with the so-called first-indicator hypothesis (Holroyd & Coles, 2002; Stahl, 2010), which assumes that the activity of the performance monitoring system will be enhanced only after the first indicator of an incorrect response. Furthermore, the FRN has been suggested to index prediction errors (Holroyd & Coles, 2002), with its amplitude being proportional to the magnitude of this error (Bellebaum & Daum, 2008; Hajcak, Moser, Holroyd, & Simons, 2007; Hewig et al., 2007; Moser & Simons, 2009). This could explain why, in the current study, equivocal feedback elicits the largest FRN, as its lacking information about the participant’s performance could result in a greater violation of reward expectancy. It has also been
82
N. Do˜ namayor et al. / Biological Psychology 102 (2014) 73–87
Fig. 6. (A) Topography of the r-values and results of the analysis of the relation between ERN amplitude and post-responses theta power change in midline electrodes. (B) Topography of the r-values and results of the analysis of the relation between FRN amplitude and post-feedback theta power change in midline electrodes. All amplitudes and power changes refer to differences between incorrect and correct responses, equivocal and positive feedback, and negative and positive feedback.
observed that expected rewards not only elicit no FRN but also have a reduced P300 compared to unexpected outcomes (Holroyd, Krigolson, & Lee, 2011): given the high rate of correct responses (approximately 79%), it is safe to say that positive feedback was the most expected outcome in the current study. We hypothesized that the amplitudes of the ERN and FRN would respectively increase and decrease in the first compared to the second half of each experimental block, as a result of learning consolidation. As expected, the analysis reveals an increase in ERN amplitude over time, in consonance with Müller et al. (2005), as well as an increase in the amplitude of the PE . This is in line with the first-indicator hypothesis (Holroyd & Coles, 2002; Stahl, 2010), which would posit greater reliance on internal information along the course of the experimental block (Müller et al., 2005), and also
concurs with the ERN reflecting a violation of the expected performance outcome (Holroyd & Coles, 2002), and the PE correlating with error awareness (Endrass et al., 2007; Hughes & Yeung, 2011; Nieuwenhuis et al., 2001; Shalgi et al., 2009), since both would be greater as learning becomes more secure. In contrast, no effect of learning is observed on the FRN, as opposed to the report of Müller et al. (2005). This finding contradicts what could be expected based on the first-indicator hypothesis (Holroyd & Coles, 2002; Stahl, 2010), which would assume the amplitude of the FRN to decrease as feedback ceases to be the first indicator that an error has been committed and this is already signaled internally by the ERN. There are two possible explanations to this fact. Firstly, it is possible that the learning or consolidation of the stimulus-response associations continued after the first half, so that the hypothesized
N. Do˜ namayor et al. / Biological Psychology 102 (2014) 73–87
83
Fig. 7. Comparison of the power change from the first and second halves of each block in the case of responses (above) and feedback (below). Power changes refer to differences between correct and incorrect responses, positive and equivocal feedback, and positive and negative feedback.
Fig. 8. Results of the linear regression between the individual power changes and the OCI-R score in the case of responses (above) and feedback (below). Power changes refer to differences between correct and incorrect responses, positive and equivocal feedback, and positive and negative feedback.
FRN amplitude decrease cannot be seized by the current analysis. However, the error rate in the current experiment is so small that a division in thirds or quarters would not provide enough trials to compute a reliable FRN (Marco-Pallarés, Cucurell, Münte, Strien, & Rodríguez-Fornells, 2011). A second possible explanation, favored
by the authors, has to do with the fact that the stimulus-response associations were mostly learned before the experimental phase, in contrast to other experiments that used trial-error learning (e.g. O’Toole et al., 2012). Indeed, the differences observed in the FRN by Müller et al. (2005) were only marginally significant, and they had a
84
N. Do˜ namayor et al. / Biological Psychology 102 (2014) 73–87
slightly larger error rate than in the current experiment. This could result in that, while reliance on internal feedback increases with further consolidation, as seen in the ERN and PE differences and the decreased error rates, reliance on external feedback stays relatively constant (and overall low) throughout the experiment. Interestingly, however, when regarding the base-to-peak amplitude of the FRN, it can be seen that it decreases in the second compared to the first half of the experimental blocks in the case of equivocal but not negative feedback. Similarly, the amplitude of the P300 decreases in the second half of the experimental blocks, also only following equivocal, not negative feedback. Other studies have reported a reduction of P300 amplitude correlating with learning for participants with high performance in these tasks (Sailer, Fischmeister, & Bauer, 2010). The lack of this difference in negative feedback in the data at hand could be another indicator that reliance on external feedback barely changed throughout the experiment. Both the P300 and base-to-peak FRN effects observed following equivocal feedback, however, are most likely attributed to a decrease in the saliency of this type of feedback (Nieuwenhuis, Aston-Jones, & Cohen, 2005; Polich & Kok, 1995).
all four components display preeminently fronto-central distributions, there is only a correlation between ERN and post-response theta over four frontal electrodes, whereas ERN amplitude and post-response theta power are uncorrelated in the rest of the electrodes, as well as FRN amplitude and post-feedback theta power. If ERN and FRN were the result of phase-resetting with amplitude enhancement in the theta band (Luu et al., 2003; Luu et al., 2004; Trujillo & Allen, 2007), these measures should be highly correlated in the electrodes displaying the highest response, which is not the case. Moreover, in contrast to ERN and PE , no significant changes are found in theta or in beta activity between the first and second halves of each experimental block, again speaking for a dissociation between event-related and oscillatory activity, as postulated by supporters of the additive model (Bastiaansen et al., 2012; Shah et al., 2004). Theta power does also not differ between the first and second halves of the experimental blocks, although graphically there is a tendency toward an increase in power in the second half for equivocal feedback. Nonetheless, it appears that the learning process has no influence on the theta oscillations in the current experimental setting.
4.2. Wavelet analysis
4.3. Relation of electrophysiological measures to obsessive-compulsive symptoms
In the current study we also performed wavelet-based timefrequency analysis. As hypothesized, a fronto-central burst in theta power (4–8 Hz) is seen for incorrect compared to correct responses, which has previously been suggested to come from the medial PFC and even give rise to the ERN (Cavanagh et al., 2009; Cohen & Cavanagh, 2011; Luu et al., 2003; Marco-Pallarés, Càmara, et al., 2008; Trujillo & Allen, 2007). A later burst in parieto-occipital beta power (13–25 Hz) for correct compared to incorrect responses can also be observed. Using magnetoencephalography, Keil, Weisz, Paul-Jordanov and Wienbruch (2010) described an analogous beta component, which they localized in the precuneus and attributed to increased attentional processing of correct responses, due to their motivational importance. Furthermore, significant frontal theta power increases are seen following both negative and equivocal feedback compared to positive feedback, concurring with numerous previous studies and which are thought to be generated within the medial PFC (Cavanagh, Frank, et al., 2010; Christie & Tata, 2009; Cohen et al., 2007; Marco-Pallarés, Cucurell, et al., 2008; van de Vijver et al., 2011). Others have reported a modulation of theta power by outcome expectancy (Bunzeck, Guitart-Masip, Dolan, & Düzel, 2011; Christie & Tata, 2009; Cohen et al., 2007), in agreement with the presumed greater violations of reward expectancy when receiving equivocal feedback than when obtaining negative feedback. In contrast to previous reports of beta bursts following rewards (Cohen et al., 2007; Hallschmid et al., 2002; Marco-Pallarés, Cucurell, et al., 2008; van de Vijver et al., 2011), we find no differences between conditions in the beta band. Still, it has been suggested that this beta response might only occur after unexpected rewards (HajiHosseini, Rodríguez-Fornells, & MarcoPallarés, 2012), which could explain its absence in a task with an approximate 79% hit rate and where, as demonstrated by the response-related activity, a performance evaluation has already taken place. An interesting matter is whether ERPs and oscillations might be different portrayals of the same event, a view that has been supported by some authors especially in the context of the ERN (Luu et al., 2003; Luu et al., 2004; Trujillo & Allen, 2007). Although the analysis performed in the context of our study does not allow for a clear adherence to either the phase-resetting nor the additive model (see Bastiaansen et al., 2012, for a review), which might only be able to be discerned with simulation studies (Yeung et al., 2007), the correlation analysis performed here seems to indicate that ERN, FRN and theta power are different neural events. Although
The third and final aim of our study was to relate the ERP and oscillatory measures to the OC characteristics of the participants. Although a number of studies have related OC symptoms to both response and feedback neural activity (e.g. Endrass et al., 2013; Endrass et al., 2010; Gehring et al., 2000; Münte et al., 2008), in the current study we do not find such relation. Participants’ OCI-R scores are within the range typically observed in non-clinical populations (2nd–99th percentiles of healthy population), with around 80% of OCD patients scoring higher than their average score. However, OCI-R scores merely explain 1% of the variance of the ERPs and 1–7% of the variance of the oscillatory responses. Although with roughly two thirds of the participants scoring between 10 and 20 points, the variance of the OCI-R scores might be too small to observe meaningful correlations, these results add to a large body of work that is highly heterogeneous. Notwithstanding the relatively consistent finding of an enlarged ERN in OCD patients (e.g. Endrass et al., 2008; Hammer et al., 2009; Xiao et al., 2011), some researchers have found correlations to OCD symptom severity (Endrass et al., 2008; Endrass et al., 2010; Gehring et al., 2000), whereas others have not (Hajcak, Franklin, Foa, & Simons, 2008; Nieuwenhuis, Nielen, et al., 2005; Riesel et al., 2011; Ruchsow et al., 2005; Xiao et al., 2011). It must also be noted that all these studies employed the Yale-Brown Obsessive-Compulsive Scale (YBOCS; Goodman et al., 1989), and that Endrass et al. (2008, 2010) obtained significant correlations with the YBOCS but not the OCI-R. Although most studies find no correlations, regardless of the instrument used to measure symptom severity, it still raises the question of whether the OCI-R might not be sensitive enough to the OC characteristics that explain some of the variance of the ERN amplitude. Furthermore, as stated before, whereas studies using flanker or go/nogo tasks usually report OCD effects on the ERPs, null results regarding ERN, FRN or both have been reported when associating learning paradigms and OC characteristics (Gründler et al., 2009; Nieuwenhuis, Nielen, et al., 2005; O’Toole et al., 2012). In the case of the FRN and symptom severity, no relation has been found in the few reports that have analyzed it (Endrass et al., 2013; Gründler et al., 2009; Nieuwenhuis, Nielen, et al., 2005). As suggested by Nieuwenhuis, Nielen, et al. (2005), it is possible that providing trial-to-trial feedback while testing the learned associations reduces anxiety in participants with high OC, therefore alleviating the hyperactivity of the performance monitoring system. It has also been proposed that errors of commission and errors
N. Do˜ namayor et al. / Biological Psychology 102 (2014) 73–87
during reinforcement learning tasks might be processed differently, due to the absence of response conflict in the latter (O’Toole et al., 2012). These studies (Gründler et al., 2009; Nieuwenhuis, Nielen, et al., 2005; O’Toole et al., 2012) used mostly probabilistic learning tasks, where the stimulus-response associations were established by trial-error; in contrast, in our task, participants were familiarized with the correct stimulus-response associations at the beginning of each block, which resulted in overall low error rates. Although it has been proposed that the performance monitoring system in OCD might only become hyperactive once stimulus-response associations are known (Nieuwenhuis, Nielen, et al., 2005), it is also possible that in such cases less information is conveyed by the feedback and thus its processing does not involve excessive reliance on the performance monitoring system posited in OCD.
4.4. Limitations As discussed above, the pattern of the FRN in the current study is unexpected with regard to previous studies, given that the ERP following negative feedback exhibits the most positive waveform. Although the data of O’Toole et al. (2012) also showed a similar pattern post-learning, in the study by Müller et al. (2005) all three feedback conditions had a similar amplitude positivity and differed fundamentally in the superimposed FRN. For this reason, base-to-peak analysis was chosen over simple difference waves to assess the amplitude, and existence, of the FRN in the current study. At present, there is no straightforward explanation for these differences between our studies. Research on the neural responses elicited by feedback dates back several decades (e.g. Johnson & Donchin, 1985; Stuss & Picton, 1978; Stuss, Toga, Hutchison, & Picton, 1980) and has described different effects of positive and negative feedback on the amplitude and latency of the positivity following the feedback stimulus. One factor that has been proposed to govern the amplitude of this P300 has been information transmission, which has been defined as the proportion “of stimulus information received by a person relative to the total amount of information originally contained in the stimulus” (Johnson, 1986, p. 374). As stated previously, in the present paradigm participants might have been more certain about their performance on correct than on incorrect trials, expecting positive feedback, which would result in it conveying less information and thus being associated with a smaller positivity. Negative feedback might have delivered more information and been therefore associated with a larger positivity. A time estimation task using the three types of feedback employed in the present study (see Miltner et al., 1997, for an example with two feedback stimuli) could be one way to test this hypothesis. The size of the time estimation error should be related to the subjective certainty and hence to the amplitude of the positivity. Further studies should explore why and under what circumstances this unexpected pattern of feedback-locked ERPs occurs.
Acknowledgements This work was supported by the Deutsche Forschungsgemeinschaft [SFB 654, TP A16 to TFM] and Bundesministerium für Bildung und Forschung [01GJ1009 to TFM].
Appendix A. Supplementary data Supplementary data associated with this article can be found, in the online version, at http://dx.doi.org/10.1016/j.biopsycho. 2014.07.013.
85
References American Psychiatric Association. (2002). Manual diagnóstico y estadístico de los transtornos mentales. Texto revisado [Diagnostic and statistical manual of mental disorders. Text revision] (4th ed.). Barcelona, Spain: American Psychiatric Association. Bastiaansen, M. C. M., Mazaheri, A., & Jensen, O. (2012). Beyond ERPs: Oscillatory neuronal dynamics. In S. J. Luck, & E. S. Kappenman (Eds.), The Oxford handbook of event-related potential components (pp. 31–49). New York, USA: Oxford University Press. Bell, A. J., & Sejnowski, T. J. (1995). An information-maximization approach to blind separation and blind deconvolution. Neural Computation, 7(6), 1129–1159. http://dx.doi.org/10.1162/neco.1995.7.6.1129 Bellebaum, C., & Daum, I. (2008). Learning-related changes in reward expectancy are reflected in the feedback-related negativity. European Journal of Neuroscience, 27(7), 1823–1835. http://dx.doi.org/10.1111/j.1460-9568.2008.06138.x Beste, C., Domschke, K., Kolev, V., Yordanova, J., Baffa, A., Falkenstein, M., et al. (2010). Functional 5-HT1a receptor polymorphism selectively modulates errorspecific subprocesses of performance monitoring. Human Brain Mapping, 31(4), 621–630. http://dx.doi.org/10.1002/hbm.20892 Beste, C., Kolev, V., Yordanova, J., Domschke, K., Falkenstein, M., Baune, B. T., et al. (2010). The role of the BDNF Val66Met polymorphism for the synchronization of error-specific neural networks. The Journal of Neuroscience, 30(32), 10727–10733. http://dx.doi.org/10.1523/jneurosci.2493-10.2010 Botvinick, M. M., Cohen, J. D., & Carter, C. S. (2004). Conflict monitoring and anterior cingulate cortex: An update. Trends in Cognitive Sciences, 8(12), 539–546. http://dx.doi.org/10.1016/j.tics.2004.10.003 Bunzeck, N., Guitart-Masip, M., Dolan, R. J., & Düzel, E. (2011). Contextual novelty modulates the neural dynamics of reward anticipation. The Journal of Neuroscience, 31(36), 12816–12822. http://dx.doi.org/10.1523/jneurosci. 0461-11.2011 Cavanagh, J. F., Cohen, M. X., & Allen, J. J. B. (2009). Prelude to and resolution of an error: EEG phase synchrony reveals cognitive control dynamics during action monitoring. The Journal of Neuroscience, 29(1), 98–105. http://dx.doi.org/10.1523/jneurosci.4137-08.2009 Cavanagh, J. F., Frank, M. J., Klein, T. J., & Allen, J. J. B. (2010). Frontal theta links prediction errors to behavioral adaptation in reinforcement learning. NeuroImage, 49(4), 3198–3209. http://dx.doi.org/10.1016/j.neuroimage.2009.11.080 Cavanagh, J. F., Gründler, T. O. J., Frank, M. J., & Allen, J. J. B. (2010). Altered cingulate sub-region activation accounts for task-related dissociation in ERN amplitude as a function of obsessive-compulsive symptoms. Neuropsychologia, 48(7), 2098–2109. http://dx.doi.org/10.1016/j.neuropsychologia.2010.03.031 Chase, H. W., Swainson, R., Durham, L., Benham, L., & Cools, R. (2010). Feedbackrelated negativity codes prediction error but not behavioral adjustment during probabilistic reversal learning. Journal of Cognitive Neuroscience, 23(4), 936–946. http://dx.doi.org/10.1162/jocn.2010.21456 Christie, G. J., & Tata, M. S. (2009). Right frontal cortex generates reward-related theta-band oscillatory activity. NeuroImage, 48(2), 415–422. http://dx.doi.org/ 10.1016/j.neuroimage.2009.06.076 Cohen, M. X., & Cavanagh, J. F. (2011). Single-trial regression elucidates the role of prefrontal theta oscillations in response conflict. Frontiers in Psychology, 2, 30. http://dx.doi.org/10.3389/fpsyg.2011.00030 Cohen, M. X., Elger, C. E., & Ranganath, C. (2007). Reward expectation modulates feedback-related negativity and EEG spectra. NeuroImage, 35(2), 968–978. http://dx.doi.org/10.1016/j.neuroimage.2006.11.056 Debener, S., Ullsperger, M., Siegel, M., Fiehler, K., von Cramon, D. Y., & Engel, A. K. (2005). Trial-by-trial coupling of concurrent electroencephalogram and functional magnetic resonance imaging identifies the dynamics of performance monitoring. The Journal of Neuroscience, 25(50), 11730–11737. http://dx.doi.org/10.1523/jneurosci.3286-05.2005 Dehaene, S., Posner, M. I., & Tucker, D. M. (1994). Localization of a neural system for error detection and compensation. Psychological Science, 5(5), 303–305. http://dx.doi.org/10.1111/j.1467-9280.1994.tb00630.x Delorme, A., & Makeig, S. (2004). EEGLAB: An open source toolbox for analysis of single-trial EEG dynamics including independent component analysis. Journal of Neuroscience Methods, 134(1), 9–21. http://dx.doi.org/10.1016/ j.jneumeth.2003.10.009 ˜ Donamayor, N., Heilbronner, U., & Münte, T. F. (2012). Coupling electrophysiological and hemodynamic responses to errors. Human Brain Mapping, 33(7), 1621–1633. http://dx.doi.org/10.1002/hbm.21305 ˜ Donamayor, N., Marco-Pallarés, J., Heldmann, M., Schoenfeld, M. A., & Münte, T. F. (2011). Temporal dynamics of reward processing revealed by magnetoencephalography. Human Brain Mapping, 32(12), 2228–2240. http://dx.doi.org/ 10.1002/hbm.21184 ˜ Donamayor, N., Schoenfeld, M. A., & Münte, T. F. (2012). Magneto- and electroencephalographic manifestations of reward anticipation and delivery. NeuroImage, 62(1), 17–29. http://dx.doi.org/10.1016/j.neuroimage.2012.04.038 Endrass, T., Klawohn, J., Schuster, F., & Kathmann, N. (2008). Overactive performance monitoring in obsessive-compulsive disorder: ERP evidence from correct and erroneous reactions. Neuropsychologia, 46(7), 1877–1887. http://dx.doi.org/10.1016/j.neuropsychologia.2007.12.001 Endrass, T., Koehne, S., Riesel, A., & Kathmann, N. (2013). Neural correlates of feedback processing in obsessive-compulsive disorder. Journal of Abnormal Psychology, 122(2), 387–396. http://dx.doi.org/10.1037/a0031496 Endrass, T., Reuter, B., & Kathmann, N. (2007). ERP correlates of conscious error recognition: Aware and unaware errors in an antisaccade task. European
86
N. Do˜ namayor et al. / Biological Psychology 102 (2014) 73–87
Journal of Neuroscience, 26(6), 1714–1720. http://dx.doi.org/10.1111/j. 1460-9568.2007.05785.x Endrass, T., Schuermann, B., Kaufmann, C., Spielberg, R., Kniesche, R., & Kathmann, N. (2010). Performance monitoring and error significance in patients with obsessive-compulsive disorder. Biological Psychology, 84(2), 257–263. http://dx.doi.org/10.1016/j.biopsycho.2010.02.002 Falkenstein, M., Hohnsbein, J., Hoormann, J., & Blanke, L. (1990). Effects of errors in choice reaction task on the ERP under focused and divided attention. In C. H. M. Brunia, A. W. K. Gaillard, & A. Kok (Eds.), Psychophysiological brain research (pp. 192–195). Tillburg, Netherlands: University Press. Falkenstein, M., Hohnsbein, J., Hoormann, J., & Blanke, L. (1991). Effects of crossmodal divided attention on late ERP components. II. Error processing in choice reaction tasks. Electroencephalography and Clinical Neurophysiology, 78(6), 447–455. http://dx.doi.org/10.1016/0013-4694(91)90062-9 Foa, E. B., Huppert, J. D., Leiberg, S., Langner, R., Kichic, R., Hajcak, G., et al. (2002). The Obsessive-Compulsive Inventory: Development and validation of a short version. Psychological Assessment, 14(4), 485–496. http://dx.doi.org/10.1037/ 1040-3590.14.4.485 Gehring, W. J., Coles, M. G. H., Meyer, D. E., & Donchin, E. (1995). A brain potential manifestation of error-related processing. Electroencephalography and Clinical Neurophysiology, Supplement, 44, 261–272. Gehring, W. J., Goss, B., Coles, M. G. H., Meyer, D. E., & Donchin, E. (1993). A neural system for error detection and compensation. Psychological Science, 4(6), 385–390. http://dx.doi.org/10.1111/j.1467-9280.1993.tb00586.x Gehring, W. J., Himle, J., & Nisenson, L. G. (2000). Action-monitoring dysfunction in obsessive-compulsive disorder. Psychological Science, 11(1), 1–6. http://dx.doi.org/10.1111/1467-9280.00206 Gehring, W. J., & Willoughby, A. R. (2002). The medial frontal cortex and the rapid processing of monetary gains and losses. Science, 295(5563), 2279–2282. http://dx.doi.org/10.1126/science.1066893 Gentsch, A., Ullsperger, P., & Ullsperger, M. (2009). Dissociable medial frontal negativities from a common monitoring system for self- and externally caused failure of goal achievement. NeuroImage, 47(4), 2023–2030. http://dx.doi.org/10.1016/j.neuroimage.2009.05.064 Gönner, S., Leonhart, R., & Ecker, W. (2007). Das Zwangsinventar OCI-R - die deutsche Version des Obsessive-Compulsive Inventory-Revised. [The German Version of the Obsessive-Compulsive Inventory-Revised: A brief self-report measure for the multidimensional assessment of obsessive-compulsive symptoms]. Psychotherapie, Psychosomatik, Medizinische Psychologie, 57(EFirst), 395–404. http://dx.doi.org/10.1055/s-2007-970894 Gönner, S., Leonhart, R., & Ecker, W. (2008). The Obsessive-Compulsive InventoryRevised (OCI-R): Validation of the German version in a sample of patients with OCD, anxiety disorders, and depressive disorders. Journal of Anxiety Disorders, 22(4), 734–749. http://dx.doi.org/10.1016/j.janxdis.2007.07.007 Goodman, W. K., Price, L. H., Rasmussen, S. A., Mazure, C., Fleischmann, R. L., Hill, C. L., et al. (1989). The Yale-Brown Obsessive Compulsive Scale I Development, use, and reliability. Archives of General Psychiatry, 46(11), 1006–1011. http://dx.doi.org/10.1001/archpsyc.1989.01810110048007 Gründler, T. O. J., Cavanagh, J. F., Figueroa, C. M., Frank, M. J., & Allen, J. J. B. (2009). Task-related dissociation in ERN amplitude as a function of obsessive-compulsive symptoms. Neuropsychologia, 47(8–9), 1978–1987. http://dx.doi.org/10.1016/j.neuropsychologia.2009.03.010 Hajcak, G., Franklin, M. E., Foa, E. B., & Simons, R. F. (2008). Increased error-related brain activity in pediatric obsessive-compulsive disorder before and after treatment. American Journal of Psychiatry, 165(1), 116–123. http://dx.doi.org/ 10.1176/appi.ajp.2007.07010143 Hajcak, G., Holroyd, C. B., Moser, J. S., & Simons, R. F. (2005). Brain potentials associated with expected and unexpected good and bad outcomes. Psychophysiology, 42(2), 161–170. http://dx.doi.org/10.1111/j.1469-8986.2005.00278.x Hajcak, G., Moser, J. S., Holroyd, C. B., & Simons, R. F. (2007). It’s worse than you thought: The feedback negativity and violations of reward prediction in gambling tasks. Psychophysiology, 44(6), 905–912. http://dx.doi.org/10.1111/ j.1469-8986.2007.00567.x Hajcak, G., & Simons, R. F. (2002). Error-related brain activity in obsessivecompulsive undergraduates. Psychiatry Research, 110(1), 63–72. http://dx.doi. org/10.1016/S0165-1781(02)00034-3 HajiHosseini, A., Rodríguez-Fornells, A., & Marco-Pallarés, J. (2012). The role of beta-gamma oscillations in unexpected rewards processing. NeuroImage, 60(3), 1678–1685. http://dx.doi.org/10.1016/j.neuroimage.2012.01.125 Hallschmid, M., Molle, M., Fischer, S., & Born, J. (2002). EEG synchronization upon reward in man. Clinical Neurophysiology, 113(7), 1059–1065. http://dx.doi.org/10.1016/s1388-2457(02)00142-6 Hammer, A., Kordon, A., Heldmann, M., Zurowski, B., & Münte, T. F. (2009). Brain potentials of conflict and error-likelihood following errorful and errorless learning in obsessive-compulsive disorder. PLoS ONE, 4(8), e6553. http://dx.doi.org/10.1371/journal.pone.0006553 Hewig, J., Trippe, R. H., Hecht, H., Coles, M. G. H., Holroyd, C. B., & Miltner, W. H. R. (2007). Decision-making in Blackjack: An electrophysiological analysis. Cerebral Cortex, 17(4), 865–877. http://dx.doi.org/10.1093/cercor/bhk040 Holroyd, C. B., & Coles, M. G. H. (2002). The neural basis of human error processing: Reinforcement learning, dopamine, and the error-related negativity. Psychological Review, 109(4), 679–709. http://dx.doi.org/10.1037/0033-295x.109.4. 679 Holroyd, C. B., Hajcak, G., & Larsen, J. T. (2006). The good, the bad and the neutral: Electrophysiological responses to feedback stimuli. Brain Research, 1105(1), 93–101. http://dx.doi.org/10.1016/j.brainres.2005.12.015
Holroyd, C. B., Krigolson, O. E., & Lee, S. (2011). Reward positivity elicited by predictive cues. Neuroreport, 22(5), 249–252. http://dx.doi.org/10.1097/wnr. 0b013e328345441d Hughes, G., & Yeung, N. (2011). Dissociable correlates of response conflict and error awareness in error-related brain activity. Neuropsychologia, 49(3), 405–415. http://dx.doi.org/10.1016/j.neuropsychologia.2010.11.036 Jelinek, L., Rietschel, L., Kellner, M., Muhtz, C., & Moritz, S. (2012). The effect of practice on the recall of salient information in obsessive-compulsive disorder. Psychiatry Research, 198(1), 89–93. http://dx.doi.org/10.1016/j.psychres. 2012.03.002 Johannes, S., Wieringa, B. M., Nager, W., Rada, D., Dengler, R., Emrich, H. M., et al. (2001). Discrepant target detection and action monitoring in obsessivecompulsive disorder. Psychiatry Research: Neuroimaging, 108(2), 101–110. http://dx.doi.org/10.1016/s0925-4927(01)00117-2 Johnson, R. (1986). A triarchic model of P300 amplitude. Psychophysiology, 23(4), 367–384. http://dx.doi.org/10.1111/j.1469-8986.1986.tb00649.x Johnson, R., & Donchin, E. (1985). Second thoughts: Multiple P300s elicited by a single stimulus. Psychophysiology, 22(2), 182–194. http://dx.doi.org/10.1111/ j.1469-8986.1985.tb01584.x Keil, J., Weisz, N., Paul-Jordanov, I., & Wienbruch, C. (2010). Localization of the magnetic equivalent of the ERN and induced oscillatory brain activity. NeuroImage, 51(1), 404–411. http://dx.doi.org/10.1016/j.neuroimage.2010.02.003 Luu, P., & Tucker, D. M. (2001). Regulating action: Alternating activation of midline frontal and motor cortical networks. Clinical Neurophysiology, 112(7), 1295–1306. http://dx.doi.org/10.1016/S1388-2457(01)00559-4 Luu, P., Tucker, D. M., Derryberry, D., Reed, M., & Poulsen, C. (2003). Electrophysiological responses to errors and feedback in the process of action regulation. Psychological Science, 14(1), 47–53. http://dx.doi.org/10.1111/1467-9280.01417 Luu, P., Tucker, D. M., & Makeig, S. (2004). Frontal midline theta and the error-related negativity: Neurophysiological mechanisms of action regulation. Clinical Neurophysiology, 115(8), 1821–1835. http://dx.doi.org/10.1016/j.clinph.2004.03.031 Marco-Pallarés, J., Càmara, E., Münte, T. F., & Rodríguez-Fornells, A. (2008). Neural mechanisms underlying adaptive actions after slips. Journal of Cognitive Neuroscience, 20(9), 1595–1610. http://dx.doi.org/10.1162/jocn.2008.20117 Marco-Pallarés, J., Cucurell, D., Cunillera, T., García, R., Andrés-Pueyo, A., Münte, T. F., et al. (2008). Human oscillatory activity associated to reward processing in a gambling task. Neuropsychologia, 46(1), 241–248. http://dx.doi.org/10.1016/ j.neuropsychologia.2007.07.016 Marco-Pallarés, J., Cucurell, D., Münte, T. F., Strien, N., & Rodríguez-Fornells, A. (2011). On the number of trials needed for a stable feedback-related negativity. Psychophysiology, 48(6), 852–860. http://dx.doi.org/10.1111/j.1469-8986. 2010.01152.x Miltner, W. H. R., Braun, C. H., & Coles, M. G. H. (1997). Event-related brain potentials following incorrect feedback in a time-estimation task: Evidence for a generic neural system for error detection. Journal of Cognitive Neuroscience, 9(6), 788–798. http://dx.doi.org/10.1162/jocn.1997.9.6.788 Moser, J. S., & Simons, R. F. (2009). The neural consequences of flip-flopping: The feedback-related negativity and salience of reward prediction. Psychophysiology, 46(2), 313–320. http://dx.doi.org/10.1111/j.1469-8986.2008.00760.x Müller, S. V., Möller, J., Rodríguez-Fornells, A., & Münte, T. F. (2005). Brain potentials related to self-generated and external information used for performance monitoring. Clinical Neurophysiology, 116(1), 63–74. http://dx.doi.org/10.1016/ j.clinph.2004.07.009 Münte, T. F., Heldmann, M., Hinrichs, H., Marco-Pallarés, J., Krämer, U. M., Sturm, V., et al. (2008). Nucleus accumbens is involved in human action monitoring: Evidence from invasive electrophysiological recordings. Frontiers in Human Neuroscience, 1, 11. http://dx.doi.org/10.3389/neuro.09.011.2007 Myers, S. G., Fisher, P. L., & Wells, A. (2008). Belief domains of the Obsessive Beliefs Questionnaire-44 (OBQ-44) and their specific relationship with obsessive-compulsive symptoms. Journal of Anxiety Disorders, 22(3), 475–484. http://dx.doi.org/10.1016/j.janxdis.2007.03.012 Nieuwenhuis, S., Aston-Jones, G., & Cohen, J. D. (2005). Decision making, the P3, and the locus coeruleus-norepinephrine system. Psychological Bulletin, 131(4), 510–532. http://dx.doi.org/10.1037/0033-2909.131.4.510 Nieuwenhuis, S., Nielen, M. M., Mol, N., Hajcak, G., & Veltman, D. J. (2005). Performance monitoring in obsessive-compulsive disorder. Psychiatry Research, 134(2), 111–122. http://dx.doi.org/10.1016/j.psychres.2005.02.005 Nieuwenhuis, S., Ridderinkhof, K. R., Blom, J., Band, G. P. H., & Kok, A. (2001). Error-related brain potentials are differentially related to awareness of response errors: Evidence from an antisaccade task. Psychophysiology, 38(05), 752–760. http://dx.doi.org/10.1111/1469-8986.3850752 Nieuwenhuis, S., Slagter, H. A., von Geusau, N. J. A., Heslenfeld, D. J., & Holroyd, C. B. (2005). Knowing good from bad: Differential activation of human cortical areas by positive and negative outcomes. European Journal of Neuroscience, 21(11), 3161–3168. http://dx.doi.org/10.1111/j.1460-9568.2005.04152.x Nieuwenhuis, S., Yeung, N., Holroyd, C. B., Schurger, A., & Cohen, J. D. (2004). Sensitivity of electrophysiological activity from medial frontal cortex to utilitarian and performance feedback. Cerebral Cortex, 14(7), 741–747. http://dx.doi.org/10.1093/cercor/bhh034 O’Toole, S. A. L., Weinborn, M., & Fox, A. M. (2012). Performance monitoring among non-patients with obsessive-compulsive symptoms: ERP evidence of aberrant feedback monitoring. Biological Psychology, 91(2), 221–228. http://dx.doi.org/ 10.1016/j.biopsycho.2012.06.005 Polich, J., & Kok, A. (1995). Cognitive and biological determinants of P300: An integrative review. Biological Psychology, 41(2), 103–146. http://dx.doi.org/10.1016/ 0301-0511(95)05130-9
N. Do˜ namayor et al. / Biological Psychology 102 (2014) 73–87 Riesel, A., Endrass, T., Kaufmann, C., & Kathmann, N. (2011). Overactive error-related brain activity as a candidate endophenotype for obsessive-compulsive disorder: Evidence from unaffected first-degree relatives. American Journal of Psychiatry, 168(3), 317–324. http://dx.doi.org/10.1176/appi.ajp.2010.10030416 Riesel, A., Weinberg, A., Moran, T., & Hajcak, G. (2013). Time course of errorpotentiated startle and its relationship to error-related brain activity. Journal of Psychophysiology, 27, 51–59. http://dx.doi.org/10.1027/0269-8803/a000093 Ruchsow, M., Grön, G., Reuter, K., Spitzer, M., Hermle, L., & Kiefer, M. (2005). Error-related brain activity in patients with obsessive-compulsive disorder and in healthy controls. Journal of Psychophysiology, 19(4), 298–304. http://dx.doi.org/10.1027/0269-8803.19.4.298 Ruchsow, M., Grothe, J., Spitzer, M., & Kiefer, M. (2002). Human anterior cingulate cortex is activated by negative feedback: Evidence from eventrelated potentials in a guessing task. Neuroscience Letters, 325(3), 203–206. http://dx.doi.org/10.1016/S0304-3940(02)00288-4 Sailer, U., Fischmeister, F. P. S., & Bauer, H. (2010). Effects of learning on feedbackrelated brain potentials in a decision-making task. Brain Research, 1342, 85–93. http://dx.doi.org/10.1016/j.brainres.2010.04.051 Schönberg, T., Daw, N. D., Joel, D., & O’Doherty, J. P. (2007). Reinforcement learning signals in the human striatum distinguish learners from nonlearners during reward-based decision making. The Journal of Neuroscience, 27(47), 12860–12867. http://dx.doi.org/10.1523/jneurosci. 2496-07.2007 Shah, A. S., Bressler, S. L., Knuth, K. H., Ding, M., Mehta, A. D., Ulbert, I., et al. (2004). Neural dynamics and the fundamental mechanisms of event-related brain potentials. Cerebral Cortex, 14(5), 476–483. http://dx.doi.org/10.1093/cercor/ bhh009 Shalgi, S., Barkan, I., & Deouell, L. Y. (2009). On the positive side of error processing: Error-awareness positivity revisited. European Journal of Neuroscience, 29(7), 1522–1532. http://dx.doi.org/10.1111/j.1460-9568.2009.06690.x Stahl, J. (2010). Error detection and the use of internal and external error indicators: An investigation of the first-indicator hypothesis. International Journal of Psychophysiology, 77(1), 43–52. http://dx.doi.org/10.1016/j.ijpsycho.2010.04.005
87
Stuss, D. T., & Picton, T. W. (1978). Neurophysiological correlates of human concept formation. Behavioral Biology, 23(2), 135–162. http://dx.doi.org/10.1016/ s0091-6773(78)91734-0 Stuss, D. T., Toga, A., Hutchison, J., & Picton, T. W. (1980). Feedback evoked potentials during an auditory concept formation task. In H. H. Kornhubek, & L. Deecke (Eds.), Progress in brain research (Vol. 54) (pp. 403–409). Amsterdam: Elsevier. Sutton, S., Tueting, P., Hammer, M., & Hakerem, G. (1978). Evoked potentials and feedback. In D. A. Otto (Ed.), Multidisciplinary perspectives in event-related potential research (pp. 184–188). Washington, DC, USA: United States Government Printing Office. Tallon-Baudry, C., Bertrand, O., Delpuech, C., & Permier, J. (1997). Oscillatory gammaband (30–70 Hz) activity induced by a visual search task in humans. The Journal of Neuroscience, 17(2), 722–734. Trujillo, L. T., & Allen, J. J. B. (2007). Theta EEG dynamics of the error-related negativity. Clinical Neurophysiology, 118(3), 645–668. http://dx.doi.org/10.1016/ j.clinph.2006.11.009 van de Vijver, I., Ridderinkhof, K. R., & Cohen, M. X. (2011). Frontal oscillatory dynamics predict feedback learning and action adjustment. Journal of Cognitive Neuroscience, 23(12), 4106–4121. http://dx.doi.org/10.1162/jocn a 00110 Xiao, Z., Wang, J., Zhang, M., Li, H., Tang, Y., Wang, Y., et al. (2011). Error-related negativity abnormalities in generalized anxiety disorder and obsessive-compulsive disorder. Progress in Neuro-Psychopharmacology and Biological Psychiatry, 35(1), 265–272. http://dx.doi.org/10.1016/j.pnpbp.2010.11.022 Yeung, N., Bogacz, R., Holroyd, C. B., Nieuwenhuis, S., & Cohen, J. D. (2007). Theta phase resetting and the error-related negativity. Psychophysiology, 44(1), 39–49. http://dx.doi.org/10.1111/j.1469-8986.2006.00482.x Yeung, N., & Sanfey, A. G. (2004). Independent coding of reward magnitude and valence in the human brain. The Journal of Neuroscience, 24(28), 6258–6264. http://dx.doi.org/10.1523/jneurosci.4537-03.2004 Yordanova, J., Falkenstein, M., Hohnsbein, J., & Kolev, V. (2004). Parallel systems of error processing in the brain. NeuroImage, 22(2), 590–602. http://dx.doi.org/ 10.1016/j.neuroimage.2004.01.040