for creating new collective works for resale or redistribution to servers or lists, or to reuse any ... ranges G5A, G5B and G5C, of which G5A is dedicated for safety ...
Copyright Notice c
2011 IEEE. Personal use of this material is permitted. However, permission to reprint/republish this material for advertising or promotional purposes or for creating new collective works for resale or redistribution to servers or lists, or to reuse any copyrighted component of this work in other works must be obtained from the IEEE.
2011 IEEE Intelligent Vehicles Symposium (IV) Baden-Baden, Germany, June 5-9, 2011
Performance of CAM based Safety Applications using ITS-G5A MAC in High Dense Scenarios Bernhard Kloiber, Thomas Strang, Matthias R¨ockl, Fabian de Ponte-M¨uller Department for Communications and Navigation German Aerospace Center 82234 Wessling, Germany {bernhard.kloiber, thomas.strang, matthias.roeckl, fabian.pontemueller}@dlr.de
Abstract—ETSI ITS-G5 is the current vehicle-to-vehicle communication technology in Europe, which will be standardized by ETSI TC ITS1 . It is based on IEEE 802.11p and therefore uses a CSMA/CA scheme for Media Access Control (MAC). In this paper we analyze the performance of Cooperative Awareness Message (CAM) based safety applications using the ETSI ITS-G5 MAC technology in a challenging scenario with respect to MAC issues: A suitable freeway segment with 6 lanes in each direction. The freeway scenario is thoroughly modeled and implemented in the well known ns-3 simulation environment. Based on this model, the paper shows the performance of CAM based safety applications under MAC challenging conditions. We provide a set of simulation results resting upon a particular performance metric which incorporates the key requirements of safety applications. Finally we analyze two concrete example scenarios to determine how reliable CAM based safety applications are in high dense traffic scenarios with respect to MAC issues.
I. I NTRODUCTION After the huge success of passive safety systems and similar success indicators seen with recent advanced driver assistance systems towards a “zero accidents“ vision in future Intelligent Transport Systems (ITS), the next big potential is seen in cooperating systems [28]. For this to become reality, a robust and reliable vehicle-to-vehicle and vehicle-to-roadside communication is a necessary prerequisite as an enabling technology. ETSI TC ITS is paving the way towards this by standardizing ETSI ITS-G5 [1], a Vehicular Ad-hoc NETwork (VANET) communication standard based on IEEE 802.11p [3]. ETSI ITS-G5 mainly describes the physical (PHY) and medium access control (MAC) sublayer of ITS stations operating in the 5.9 GHz frequency band. It covers the frequency ranges G5A, G5B and G5C, of which G5A is dedicated for safety and safety related applications. Other applications have to use the G5B or G5C frequency bands. Since our interests lie more in the area of safety applications, this paper is focusing on ITS-G5A. The PHY layer of G5A defines three 10 MHz channels, one control channel (CCH) and two service channels (SCH1 and SCH2), which allow vehicles to send with a transmit power of up to 33 dBm.The modulation scheme which is used for ITS-G5A is Orthogonal Frequency 1 European Telecommunications Standards Institute Technical Committee for Intelligent Transportation Systems.
978-1-4577-0889-3/11/$26.00 ©2011 IEEE
Division Multiplexing (OFDM). This technique provides data rates from 3 MBit/s up to 27 MBit/s per channel. The MAC layer of ITS-G5A uses a Carrier Sense Multiple Access with Collision Avoidance (CSMA/CA) scheme to access the shared media. CSMA/CA is known to perform well in non-congested networks, but degrades dramatically with a strong increase in network load [18]. One reason for this is that the collision avoidance mechanism of CSMA/CA relies on acknowledgement messages which do not make sense for broadcasted messages such as the CAM beaconing messages. Likewise, there is no RTS/CTS mechanism available to avoid the hidden terminal problem in VANETs, but on the other hand the exposed terminal problem does not exist. Using this communication technology, vehicles can inform each other about their current status and certain events, providing the necessary means to establish a cooperative situation awareness. Safety applications, which are in the focus of our work, can process the received information either to warn the driver about some upcoming dangerous situation, up to eventually automatically control the vehicle to avoid the situation entirely or at least to significantly decrease its effect. Currently, the following two message types are being standardized [6], [7]: • Cooperative Awareness Message (CAM): This message is used to inform the other vehicles about the current status of the sending vehicle, such as the current geographical position, speed and heading. CAMs are typically broadcasted as periodical beacons with a frequency of 1-10 Hz. • Decentralized Environment Notification Message (DENM): This message is used to inform the vehicles in a certain area close to an event about a special event such as roadwork construction or an accident. Because most of the safety applications in [5] are based on periodic status messages, we will focus our analysis on CAM based safety applications, such as lane change assistance or Cooperative Adaptive Cruise Control (CACC). To analyze the performance of this kind of applications, we introduced in [8] the so called update delay metric, which is a special receiver based performance metric for periodic information distribution. The update delay plotted as Complementary Cumulative Distribution Function (CCDF) has exposed to be an important performance indicator to determine the reliability of the MAC
654
communication and by association of the safety application itself. In this paper we want to present two contributions according to the performance analysis of CAM based safety applications using ITS-G5A MAC: • By means of simulations, we provide a comprehensive set of update delay CCDFs, which serves as a base for our following safety application evaluation. • We evaluate two CAM based example safety applications, which shows their performance and reliability by using ITS-G5A MAC in high dense scenarios. The reminder of this paper is organized as follows. Section II discusses some relevant related work. The simulation scenario is summarized in section III. The results of the simulations are shown in section IV. Finally section V analyses the reliability of current ITS-G5A MAC by means of two example applications. II. R ELATED W ORK Several papers have been published, which analyze the performance of VANETs. Most of them use throughput, latency and reception or collision probability as performance metrics. For instance, Eichler evaluated the performance of IEEE 802.11p WAVE in [9], including the influence of the different access classes. He used the average packet throughput, the collision probability and the end-to-end delay to measure the performance. In [18] Brakemeier analyzed VANETs analytically by treating them as a stochastic process with Poisson distributed message arrivals. He calculated the average packet delay and the packet loss probability for evaluation purposes. The packet reception probability was analyzed in [14]. In doing so, the authors concentrated on the distance based interference effect, if an emergency vehicle approaches a traffic jam. Bilstrub simulated the performance of 802.11p MAC in [11] to compare it with their proposed STDMA approach. They measured the distributions of the channel access delay, of the distance within nodes which are sending at the same time and of the number of consecutive packet drops. A similar study was published by Cozzetti et al. in [12]. They also compared 802.11p with an own MAC scheme called RRAloha+ and it’s improved version MS-Aloha. For comparison they used mainly the well known latency metric and the packet delivery ratio (PDR) which is an equivalent to the packet reception probability. In [10] Yin et al. did some simulations of a city scenario. To analyze the performance, they used the packet latency and throughput as metrics. In [15] the authors chose among others the probability of successful reception, the channel busy time and the channel access time to evaluate the VANET communication. A real world experiment with a fleet of three vehicles was done in [17]. There the packet delivery ratio and the distribution of consecutive packet drops were used as performance metric. They also characterized a kind of application-level reliability, which might be the most important information for safety application designers. In [13] ElBatt et al. simulated a freeway scenario and used the packet interreception time, the cumulative number of packet receptions,
the packet success probability and the per-packet latency to do a performance evaluation. The packet inter-reception time basically conforms the update delay metric in [8], but the authors of [13] only presented this metric over simulation time and did no statistical preprocessing for a more precise analysis. In contrast Kloiber et al. [8] concentrated on this metric and worked out it’s importance especially for CAM based safety applications, because it shows the correlation between the update delay and the up-to-dateness of the knowledge about the status of vehicles in the surrounding. Furthermore they showed a detailed statistical analysis, including a suitable representation of this metric, which is very significant to evaluate the MAC performance with respect to key requirements for safety applications. Unsurprisingly, the performance results of all these papers differ significantly, not least because of the variations in performance metrics. Also many models are too simplistic, same making unrealistic assumptions. Therefore the results of the different performance analyses are not directly comparable. In particular, one cannot derive reliable statements whether the current MAC scheme is sufficiently robust and reliable for safety applications or not. In this paper we try to get closer to a statement, whether ITS-G5A MAC is reliable enough for future CAM based safety applications in high dense scenarios or is not. In doing so, we simulated a high dense freeway scenario, used the update delay metric and its representation from [8] and analyzed two example safety applications according to their reliability. III. S IMULATION S CENARIO For our performance analysis we used ns-3, an open-source event based simulation environment written in C++, which provides a lot of useful features. The stable release at that time was ns-3.6. In order to be able to simulate with the current ETSI ITS-G5A communication technology, we had to extend a standard 802.11 protocol towards the latest version of the definition of ITS-G5A, i.e. we implemented many of the specific communication protocols as they were not available for ns-3 at that time. In [8] we tried to identify important traffic scenarios and classified them with respect to MAC challenging issues. In particular the freeway has exposed to be the most challenging scenario for MAC. In this paper we have used a similar simulation configuration as in [8]. We have modeled a straight 25 km long freeway segment with 6 lanes in each direction. The vehicles are generated Erlang distributed with a Mean Time Ahead Distance (MTAD) of 2 seconds for each lane. This models the mandatory 2 second time ahead distance between cars on high quality road networks. The PHY/MAC implementation is based on ETSI ITS-G5A, i.e. a channel width of 10 MHz, a default data rate of 6 Mbit/s and a maximum transmit power of 33 dBm. Because we are mainly interested in MAC performance, we used a logdistance pathloss model with an exponent of 2.25 to simulate a simple radio propagation, neglecting most of the PHY layer effects like shadowing, multipath propagation, doppler, etc.
655
TABLE I S IMULATION PARAMETERS Simulation stop criterion Length of freeway section Length of freeway edge Length of freeway core No. of lanes per direction Mean time ahead distance Vehicle speed for each lane Transmit power Channel bandwidth Data rate EDCA Priority Queue Pathloss model Communication range Error model Beaconing frequency Message size
If 109 messages have been processed 25 km 10 km 5 km 6 2s 20 m/s, 24 m/s, 28 m/s, 32 m/s, 36 m/s, 40 m/s 33 dBm 10 MHz 6 MBit/s AC VO Log-distance with exponent 2.25 up to 1000 m SNIR based 1 Hz, 2 Hz, 5 Hz, 8 Hz, 10 Hz, 12 Hz, 20 Hz 500 Byte
Fig. 1.
This results in the desired nominal communication range of up to 1000 m. The error model used in ns-3 is Signal to Noise and Interference Ratio (SNIR) based. More details on that you can find in [32]. The CAM messages in our simulation have a length of 500 Bytes (including security aspects like signatures). They are sent periodically and their Beaconing Frequencies (BFs), i.e. number of beacon transmissions per second, are varied over several simulation runs. To eliminate the edge effect2 , the evaluation of the MAC communication takes place within the simulated freeway core of 5 km length. Further details on the simulation scenario can be found in [8]. All the assumptions above result in a high dense (data) traffic scenario, i.e. about 170 vehicles on average within the communication range and about 450 up to 8800 CAM transmissions per second within the freeway core, depending on the chosen BF. Table I summarizes the most important simulation parameters. Our basic performance metric is the so called update delay [24], which is defined as the difference of reception times between consecutive CAMs of the same transmitter. Typical safety applications are based on the knowledge about the vehicles in their surrounding. The received CAMs are used to update the knowledge about the status of the transmitting vehicle. The update delay has the interesting property that it correlates with the up-to-dateness of the knowledge about the status of the transmitting vehicle. To get the distribution of the update delay it was measured for each receiver and a histogram was built up. Then the histogram was processed to represent the update delay as Complementary Cumulative Distribution Function (CCDF), which shows the probability for exceeding a maximum update delay value. This in turn can be used to determine the reliability for not exceeding a maximum update 2 The edge effect is a channel load irregularity at both ends of the freeway caused by the freeway cut-off. This is because missing vehicles outside the freeway section would normally influence the communication between vehicles at the edge of the freeway section.
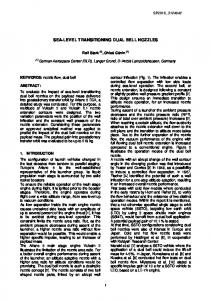
Different update delay CCDFs by varying the beaconing frequency.
delay value. Typical CCDF plots are depicted in figure 1. As a consequence, if the maximum allowed update delay boundary for a CAM based safety application is known, the CCDF shows the probability for exceeding this maximum allowed value, which is equivalent to the probability of failure. The latter can be interpreted as the unreliability of the safety application itself. The reliability of that application can be simply derived by 1 minus unreliability. The procedure just described is our general approach for the reliability analysis of CAM based safety applications [8]. This paper is focusing only on MAC communication issues of ITS-G5A. That means, our simulation results in the following section and consequently the reliability analysis of safety applications in section V take only MAC communication issues into account. To get insight into the amount of data traffic on the channel during one simulation run, we measured the mean channel load. Because the channel load is a location dependent metric, we didn’t determine the channel load for each vehicle. Instead we placed fixed virtual measurement points on each lane and at a distance of 100 m. These measurement points observe the channel and calculates the percentage how long the channel was sensed to be busy or messages have been received. IV. S IMULATION RESULTS To get reliable simulation results we took care in our simulations in particular about the edge effect. Our analysis revealed that it is necessary to simulate a 25 km freeway with freeway edges of 10 km on each side, resulting in a freeway core of 5 km. This simulation settings ensure that all vehicles within the freeway core have the same channel load condition. An example of our results from our simulations are represented in figure 1. It shows the update delay distributions for different beaconing frequencies according to the simulation scenario described in section III. The CCDF curves consider all communication relationships within the whole communication range. In the diagram the update delay is shown on the x-axis, the probability that the update delay is greater than a certain x-value is assigned to the y-axis.
656
of possible safety applications, the update delay is a very important metric to evaluate the reliability of applications such as Cooperative Adaptive Cruise Control (CACC) [30], [29] or the Lane Change Assistant (LCA). The general approach to evaluate the reliability of a safety application based on CCDFs is twofold: •
•
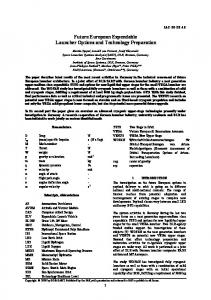
Fig. 2. Different update delay CCDFs by varying the beaconing frequency. An enlarged detail from figure 1.
Two important effects can be identified. The first one is shown in figure 1: An increasing Beaconing Frequency (BF) can improve the behavior of the update delay CCDF curve in general. But this is only valid for BF values up to 8 Hz. Continuing the increase of the BF, makes the CCDF curves worse again. The reason for this behavior is the growing data traffic on the channel by increasing the BF. Up to 8 Hz the channel load increases, but as long as the channel load is below a certain capacity threshold, this is not a severe problem according to the number of collisions. But if the channel load reaches the capacity threshold, the channel is saturated and a further increase of the data traffic leads to a strong increment of collisions and therefore also packet losses. The second important effect can be seen in more detail in figure 2. For small update delay values, the update delay CCDF with the lowest BF is always the best one. But there is a point in time, where CCDF curves with higher BFs outperforms the CCDF curves with lower BFs. The reason for this effect is the following: With respect to a certain time interval, increasing the BF means increasing the number of transmission attempts. Increasing the number of transmission attempts means increasing the probability of a successful CAM reception within the same time interval. This can be compared with channel coding by code repetition, which also leads to a higher decoding probability. For small update delay values, the goodness of the update delay CCDFs is influenced mainly by a few collisions due to a low channel load because of transmitting with lower BFs. From the point in time, when CCDFs with higher BFs outperform update delay curves with lower BFs, the effect of increasing the number of transmission attempts starts dominating the goodness of the update delay CCDFs. V. E VALUATION OF SAFETY APPLICATIONS The update delay CCDF curves shown above are highly useful for the evaluation of safety applications, which are based on periodical beaconing. Taking the Basic Set of Applications (BSA) document [5] provided by ETSI as an exemplary list
For a given maximum update delay bound (x-axis of figure 1), the CCDF curves define the probability value for exceeding this maximum update delay bound (y-axis of figure 1). For a given minimum application reliability (1− probability for exceeding a maximum update delay value; y-axis of figure 1), the necessary supported maximum update delay can be identified from the CCDF curves (x-axis of figure 1).
For the following evaluations we consider the scenario that all vehicles are sending with 8 Hz beaconing frequency. A. Evaluation of application 1: Cooperative Adaptive Cruise Control (CACC) The CACC application (see section C.2.10 in [5]) allows a vehicle to automatically follow a leading vehicle. This is done by adapting the speed and direction in a way that it keeps a certain Time Ahead Distance (TAD) to the leading vehicle. This application has many parallels to the cooperative forward collision warning, for this reason we rate CACC as safety application. To analyze the CACC application with respect to the required maximum update delay value, the following assumptions were made: According to the advisory speed limit on the freeways in Germany, the maximum speed vmax is 130 km h for the vehicles running CACC. The T AD between consecutive cars is 2 seconds. Assuming further that the leading vehicle is a very new one with tip-top anti-lock disk brakes and the following car is an old one, with old attrited brakes, the leading vehicle has a much shorter braking distance than the following older one. To take care of this effect, a minimum braking deceleration adecel,min of 6 sm2 and a maximum deceleration adecel,max of 9 sm2 is assumed here [31], to avoid forward collisions. Finally a maximum processing time of 100 milliseconds is assumed, which considers all processing tasks above the MAC layer, e.g. processing of CACC algorithm. To find the update delay bound, the next step is to split up the TAD into its shares:
T AD = U Dmax (BF ) + tdecel + tCAM (BF ) + tproc
(1)
U Dmax is the interesting unknown and tdecel is the safety time distance we must take care of because of possible different braking decelerations as mentioned above. tCAM arises because of the periodic transmission of the CAM. Finally tproc denotes the maximum processing time mentioned above.
657
Fig. 3. Update delay CCDFs in the interval from 0 to 1 s by different beaconing frequencies considering all communication relationships within a 100 m communication range (CR).
The tdecel can be calculated the following way: tdecel
=
=
dbrake (vmax , adecel,min ) vmax dbrake (vmax , adecel,max ) − vmax 2 vmax 2×adecel,min
−
2 vmax 2×adecel,max
vmax
(2)
Thereby dbrake (vmax , adecel,min ) and dbrake (vmax , adecel,max ) denote the braking distances with minimum and maximum deceleration respectively. Using their given values from above, equation (2) results in 1 s for tdecel . Because CAMs are sent periodically, the worst case is, if a CAM has just been received then a receiver has to wait at least 1 tCAM (BF ) = (3) BF
Fig. 4. Update delay CCDFs in the interval from 0 to 4 s by different beaconing frequencies considering all communication relationships within a 100 m communication range (CR).
delay. This is absolutely not acceptable for a reliable safety application. Another evaluation approach for CACC is to assume a postulated reliability for the safety application and calculate the maximum allowed speed to run CACC with that reliability. Assuming a CACC application reliability of 1 − 10−6 = 0.999999 means a probability of 10−6 for exceeding the maximum allowed update delay. Using figure 4 one can pick out the appropriate maximum update delay value of 2.25 seconds, considering the 8 Hz CCDF again. The first thing you will notice about this result is, that CACC can not run using a T AD of 2 seconds, because U Dmax (8Hz) is already greater than 2 seconds. Hence, for further considerations we assume a T AD of 3 seconds. The remaining assumptions are the same as before. For the following calculations we start with equation (1) again. The interesting unknown now is the variable vmax , which is contained in tdecel . Solving equation (1) for tdecel , we get:
to get the next status update. The maximum update delay finally can be calculated by using equation (1). Inserting the results of equation (2) and (3) leads to U Dmax (8Hz)
=
T AD − tdecel − tCAM (8Hz) − tproc
=
0.789s
tdecel
=
T AD − U Dmax (8Hz) − tCAM (8Hz) − tproc
=
0.539s
Then equation (2) can be solved for vmax :
Figure 3 shows another set of update delay CCDFs by using our default simulation configuration described in section III. The different CCDF curves belongs to various beaconing frequencies and considers all communication relationships within a 100 m communication area. Using figure 3, one can pick out the appropriate probability for exceeding the U Dmax (8Hz) value 0.789 seconds. The resulting probability value for the 8 Hz CCDF curve and therefore the resulting unreliability value for the safety application is in the range of 2 × 10⁻³ . This means that every 500th CAM update takes longer than the required maximum update
vmax
=
2 × tdecel �
1 adecel,min
=
−
1
�
adecel,max
m km 19.40 = 69.85 s h
This means, driving with a maximum speed of 69.85 km/h CACC will work with a reliability of 1 − 10−6 , i.e. 99.9999 %. A maximum allowed speed of 69.85 km/h for cars on a freeway is also not acceptable as well as a reliability of only 1 − 2 × 10⁻³ , i.e. 99.8 % at tempo 130 km/h.
658
Fig. 5. Example scenario for the lane change assistance: Dependent on the perspective, the respective vehicle should be aware of the other vehicle not later than the fast approaching vehicle enters the critical distance.
B. Evaluation of application 2: Lane Change Assistance (LCA) The second example safety application presented in this paper is the LCA (see section C.1.4.2 in [5]), which is responsible for avoiding hazardous lane change maneuvers by informing the lane changing vehicle as well as the vehicle on the neighboring lane about each other. So two perspectives can be identified for this application. The first perspective is from the lane changing vehicles view, which is informed about vehicles on the neighboring lane and possibly issues a warning. The second perspective is from the fast approaching vehicles view, driving on the neighboring lane, which is informed about the lane changing vehicle and possibly issues a warning, so that the driver can initiate full braking if necessary. To analyze the LCA application according to the maximum required update delay, certain assumptions are required again: The minimum speed on Germany’s freeways is 60 km/h and therefore also for our analysis. Furthermore a maximum speed of 250 km/h is assumed, because of technical speed restrictions of some German car manufacturers. Both speed limits leads to a maximum relative speed vmax,rel of 190 km/h or 52, 78 m/s between the slow lane changing vehicle and the fast approaching vehicle on the neighboring lane. For the fast approaching vehicle this results in a braking distance dbrake of nearly 350 m assuming bad conditions, i.e. a braking deceleration of only 4 sm2 . Because we don’t want both cars driving nose to tail after the braking maneuver, we consider an additional safety distance dsaf ety of 10 m. Adding both, the braking and the safety distance, leads to the critical distance dcritical , up to which both cars should be aware of each other as depicted in figure 5. Assuming a communication range CR of 1000 m, after subtracting the critical distance, 640 m are left for CAM exchange to inform both vehicles about each other according to the two perspectives mentioned above. To get the maximum required update delay value the only thing to do is dividing 640 m by vmax,rel , which results in about 12 seconds. This calculation applies for both perspectives, the lane changing vehicles view as well as the fast approaching vehicles view. After the calculation of the maximum required update delay, the reliability of the safety application can be determined, in a scenario defined above by means of figure 2. Considering the 8 Hz beaconing frequency scenario one can see that the
probability of exceeding an update delay of 12 s is 2 × 10⁻⁶ . As a consequence the reliability of the safety application is 1 − 2 × 10⁻⁶ , i.e. 99.9998 %. This reliability value might be enough for safety applications, but the decision whether it is or is not is the responsibility of the application engineers. VI. C ONCLUSIONS AND FUTURE WORK This paper makes two contributions to the performance analysis of ITS-G5A MAC for safety applications in high dense scenarios: First it provides a set of update delay CCDFs which serves as a base for evaluations of safety applications. Therefore a broad freeway scenario has been simulated and the data traffic has been varied by varying the beaconing frequency. As a result two important effects have been identified, caused by varying the beaconing frequency. Hence, under some circumstances the update delay CCDF can be improved by increasing the beaconing frequency as long as the channel load is below a certain capacity threshold. Second, two CAM based example safety applications have been analyzed according to their performance and reliability in a high dense freeway scenario. The results have shown that there are safety applications which might work reliable enough using ITS-G5A MAC, but there are also safety applications which definitely do not. As a consequence we think that current ITS-G5A MAC is a good starting point, but more reliable communication protocols are needed to run trusted safety applications in the future. In future we want to simulate with more realistic channel models to consider also some PHY layer effects like shadowing, multipath propagation and doppler. This will result in more accurate CCDF plots with respect to the reliability analysis of safety applications. R EFERENCES [1] ETSI ES 202 663, ”Intelligent Transport Systems; European profile standard on the physical and medium access layer of 5 GHz ITS”, Draft Version 0.0.6, October 2009. [2] ETSI EN 302 571, ”Intelligent Transport Systems (ITS); Radio communications equipment operating in the 5 855 MHz to 5 925 MHz frequency band; Harmonized EN covering the essential requirements of article 3.2 of the R&TTE Directive”, Draft Version 1.2.1, October 2009. [3] IEEE 802.11 WG, ”IEEE P802.11p/D8.0, Draft Standard for Information Technology - Telecommunications and information exchange between systems - Local and metropolitan area networks - Specific requirements, Part 11: Wireless LAN Medium Access Control (MAC) and Physical Layer (PHY) specifications, Amendment 7: Wireless Access in Vehicular Environments”, Draft Version 8.0, July 2009.
659
[4] IEEE 802.11 WG, ”IEEE Standard for Information technology - Telecommunications and information exchange between systems - Local and metropolitan area networks - Specific requirements, Part 11: Wireless LAN Medium Access Control (MAC) and Physical Layer (PHY) Specifications, IEEE Std 802.11-2007, June 2007. [5] ETSI TR 102 638, ”Intelligent Transport Systems (ITS); Vehicular Communications; Basic Set of Applications; Definitions”, Version 1.1.1, June 2009. [6] ETSI TS 102 637-2, ”Intelligent Transport Systems (ITS); Vehicular Communications; Basic Set of Applications; [Part 2: Specification of Cooperative Awareness Basic Service;]”, Draft Version 1.0.4, March 2010. [7] ETSI TS 102 637-3, ”Intelligent Transport Systems (ITS); Vehicular Communications; Basic Set of Applications; [Part 3: Specifications of Decentralized Environmental Notification Basic Service;]”, Draft Version 2.1.1, April 2010. [8] Bernhard Kloiber, Thomas Strang, Fabian de Ponte-M¨ueller, Cristina Rico Garcia and Matthias R¨ockl, ”An Approach for Performance Analysis of ETSI ITS-G5A MAC for Safety Applications”, ITST, November 2010. [9] Stephan Eichler, ”Performance Evaluation of the IEEE 802.11p WAVE Communication Standard”, WiVeC, September 2007. [10] Jijun Yin, Tamer ElBatt, Gavin Yeung, Bo Ryu, Stephen Habermas, Hariharan Krishnan and Timothy Talty, ”Performance Evaluation of Safety Applications over DSRC Vehicular Ad Hoc Networks”, VANET’04, ACM, October 2004. [11] Katrin Bilstrub, Elisabeth Uhlemann, Erik G. Str¨om and Urban Bilstrub, ”On the Ability of the 802.11p MAC Method and STDMA to Support Real-Time Vehicle-to-Vehicle Communication”, EURASIP Journal on Wireless Communications and Networking, Volume 2009. [12] H. A. Cozzetti, R. M. Scopigno, L. Casone and G. Barba, ”Comparative Analysis of IEEE 802.11p and MS-Aloha in Vanet Scenarios”, International Workshop on Vehicular Networking (VON-09), IEEE, December 2009. [13] Tamer ElBatt et. al., ”Cooperative Collision Warning Using Dedicated Short Range Wireless Communications”, VANET’06, ACM, September 2006. [14] R. K. Schmidt, T. K¨ollmer, T. Leinm¨uller, B. B¨oddeker and G. Sch¨afer, ”Degradation of Transmission Range in VANETs caused by Interference”, PIK - Praxis der Informationsverarbeitung und Kommunikation (Special Issue on Mobile Ad-hoc Networks), 2009. [15] F. Schmidt-Eisenlohr, M. Torrent-Moreno, J. Mittag and H. Hartenstein, ”Simulation Platform for Inter-Vehicle Communications and Analysis of Periodic Information Exchange”, IEEE/IFIP WONS, January 2007. [16] Marc Torrent-Moreno, ”Inter-Vehicle Communications: Assessing Information Dissemination under Safety Constraints”, IEEE/IFIP WONS, January 2007 [17] Fan Bai, Hariharan Krishnan, ”Reliability Analysis of DSRC Wireless Communication for Vehicular Safety Applications”, ITSC 2006, September 2006.
[18] Achim Brakemeier, ”White Paper on Network Design Limits and VANET Performance”, Version 0.5, Car2Car Communication Consortium, November 2008. [19] Chuan Heng Foh, Moshe Zukerman and Juki Wirawan Tantra, ”A Markovian Framework for Performance Evaluation of IEEE 802.11”, IEEE Transactions on Wireless Communications, Volume 6, April 2007. [20] Hongqiang Zhai, Younggoo Kwon and Yuguang Fang, ”Performance analysis of IEEE 802.11 MAC protocols in wireless LANs”, WCM, John Wiley & Sons, 2004. [21] P. Chatzimisios, V. Vitsas and A. C. Boucouvalas, ”Throughput and delay analysis of IEEE 802.11 protocol”, 5th IEEE International Workshop on Networked Appliances, 2002. [22] Omesh Tickoo and Biplab Sikdar, ”Queuing Analysis and Delay Mitigation in IEEE 802.11 Random Access MAC based Wireless Networks”, INFOCOM, 2004. [23] Zhen-ning Kong, Danny H. K. Tsang, Brahim Bensaou and Deyun Gao, ”Performance Analysis of IEEE 802.11e Contention-Based Channel Access”, IEEE Journal on Selected Areas in Communications, Volume 22, December 2004. [24] Cristina Rico Garcia, Andreas Lehner, Patrick Robertson and Thomas Strang, ”Performance of MAC protocols in beaconing Mobile Ad-hoc Multibroadcast Networks”, 3rd International Workshop on Multiple Access Communications (MACOM), September 2010 [25] Tony K. Mak, Kenneth P. Laberteaux and Raja Sengupta, ”A MultiChannel VANET Providing Concurrent Safety and Commercial Services”, VANET’05, ACM, September 2005. [26] Statistisches Bundesamt, Fachserie 8, Reihe 7, 2008. [27] ITU, ”Information Technology - Open Systems Interconnection - Basic Reference Model: the Basic Model - Data Networks and Open System Communications Open Systems Interconnection - Model and Notation”, ITU-T X.200, January 1994. [28] Juhani J”a”askel”ainen, ”Cooperative Mobility and the importance of harmonized international standards”, 2nd ETSI TC ITS Workshop, February 2010. [29] Matthias R¨ockl, Korbinian Frank, Thomas Strang, Matthias Kranz, Jan Gacnik and Jan Schomerus, ”Hybrid Fusion Approach combining Autonomous and Cooperative Detection and Ranging methods for Situationaware Driver Assistance Systems”, IEEE 19th International Symposium on Personal, Indoor and Mobile Radio Communications (PIMRC) 2008, September 2008. [30] Matthias R¨ockl, Jan Gacnik and Jan Schomerus, ”Integration of Car2-Car Communication as a Virtual Sensor in Automotive Sensor Fusion for Advanced Driver Assistance Systems”, Springer Automotive Media. FISITA 2008, September 2008. [31] Auto und Verkehr - Bremswegrechner, http://www.auto-undverkehr.de/bremswegrechner. [32] Mathieu Lacage and Thomas R. Henderson, ”Yet Another Network Simulator”, WNS2’06 (Workshop on ns-2), 2006 [33] ns-3 documentation, http://www.nsnam.org/doxygen-release/index.html.
660