Both FDDIs support 35 stations, uniformly situated along the ring in such a way that the distance .... At this point, packets are waiting for the interface to get the token. This buffer is ... Figure 5: Frame formats at the most relevant system points ...
PERFORMANCE OF INTERCONNECTING FDDI NETWORKS THROUGH ATM WHEN MANAGING VIDEO TRAFFIC* David Andrés, Joan Vila, Jordi Domingo and Josep Solé Departament d’Arquitectura de Computadors, Universitat Politècnica de Catalunya, Campus Nord, Mòdul D6, 08071 Barcelona, Catalonia (Spain) E-mail: {estasen|joanv|jordid|pareta}@ac.upc.es
Abstract The interest in LAN interconnection through high speed networks is becoming increasingly important because new applications with stronger timing and bandwidth requirements are arising. This paper studies the end-to-end performance achieved when routing FDDI traffic through an ATM network. Traffic consists of merged IP and coded, packetized video. A main contribution of this work is the use of real traffic traces obtained from video codecs and a LAN router to carry out the simulations. The delay variation introduced by the different networks is studied, together with the loss of information due to overflows at the ATM access buffer and excessive delays. Results are shown for different sizes of ATM access buffer and virtual channel bandwidths. The proposed configuration has shown adequate performances, but it requires strict buffer and virtual channel sizing. To improve system robustness, a time-out policy for packets in the buffer has been added, with successful results. Keyword Codes: C.2.1 Keywords: Internetworking, ATM (Asynchronous Transfer Mode), Performance Evaluation. 1. INTRODUCTION In present days, the communications world points to integration of all existing networks into a world-wide, all-purpose network, B-ISDN (Broadband Integrated Services Digital Network), which will be based on ATM (Asynchronous Transfer mode) [1]. Therefore, interconnection of LANs through ATM is becoming a matter of interest [2]. This work intends to make a contribution in this direction. FDDI (Fiber Distributed Data Interface) is currently becoming the technology for high speed Local Area Netwoks (LANs), because of the high reliability and performances of fiber optics, the variety of available topologies and the wide range of types of traffic it can manage [3]. * This work has been supported by CICYT (Spanish Education Ministry) under contract TIC 921289-PB.
Up to now, several studies have covered the interconnection of FDDI networks through ATM [4,5] by modeling traffic sources using analytical models. A contribution of the present work is the use of real traffic to model the different sources, in order to obtain more realistic results. Another contribution is the use of a router as a gateway in order to achieve a global connectivity. This paper is organized as follows: Section 2 describes the studied configuration. Section 3 explains how this configuration and its traffic sources have been modeled. Section 4 focuses on simulations and their results. Section 5 analyzes the effects of adding a time-out feature. Finally, Section 6 is a summary with the conclusions and further work to continue. 2. WORKING SCENARIO The configuration evaluated in this work consists of an interconnection environment of two FDDI LANs through an ATM network, as depicted in Figure 1. The elements forming this environment are described below. This system offers a connectionless service among end users.
Figure 1: Working Scenario
2.1. FDDI LANs Both FDDIs support 35 stations, uniformly situated along the ring in such a way that the distance between two neighboring stations is 200 m. Only FDDI-I mode is considered. There are two types of stations, characterized by the kind of traffic they manage: - Asynchronous traffic. It consists of data packets from a router which links several LANs to the backbone. All these communications use the TCP/IP protocol suite. - Synchronous traffic. This kind of traffic corresponds to video sequences. Each frame is packetized by using as many UDP/IP frames as needed when entering FDDI.
Packetization of video traffic in IP frames allows it to be transmitted over any kind of network whenever its bandwidth and delay jitter performances satisfy the requirements of the terminal equipments. It is assumed that video traffic is transmitted in real time, so retransmissions make no sense. Therefore, the simplicity of UDP is preferred to the reliability of TCP [6]. 2.2. ATM network This network is based on Virtual Channels, and its performance corresponds to the first expected features of B-ISDN: peak rate is the only policeable traffic descriptor, and no change in the traffic descriptor is allowed during the communication [7,8]. This choice leads to the following consequences: - Users are responsible for not exceeding the contracted peak rate. - The technology giving support to this network (fiber optics) ensures a very low bit error rate. - Cell loss and delay variations within the network are very low, due to the strict conditions of access, which limit the peak rate of ATM bursts. - The connectionless service is offered over semi-permanent virtual paths and channels. 2.3. FDDI-ATM adaptor This adaptor behaves as a router since it transforms IP packets from FDDI into an ATM call sequence, and reconstructs IP packets from an incoming cell stream, as shown in Figure 2. While the use of remote MAC bridges is an appropriate strategy for providing communications within a single organization, the hierarchical addressing facility of routing allows communication between LANs of different organizations, which may use different MAC layer protocols [7]. Then, the adaptor does not intend to extend the FDDI networks but to incorporate them into the Internet community over the ATM network, so the use of a router is fully justified.
Figure 2: Protocol stack The ATM adaptation level provides several access points, which are appropriate for different kinds of services: AAL1 for circuit emulation; AAL2 for variable-rate connections; AAL3/4 for reliable data transfers; and AAL5 for simple and efficient
data communications. For LAN traffic both AAL3/4 and AAL5 are suitable [9]. AAL5 has been adopted in this work because AAL3/4 uses several overhead fields which do not have a clear application in this environment, while AAL5 performances satisfy the requirements of the work. FDDI includes a LLC/SNAP layer because it is based on medium sharing [10]. ATM does not include such a layer since in this work each service is assigned an exclusive virtual channel. The functional structure of the FDDI-ATM adaptor is shown in Figure 3. - FDDI Interface: It selects FDDI frames addressed to the adaptor and removes their MAC overheads. - Router: It removes LLC/SNAP headers in order to obtain the IP PDU. It finds out which virtual channel the IP packet is to be transmitted over by means of a lookup table indexed by the destination address field. - ATM Interface: It adds an AAL5 trailer to the IP PDU and generates a cell stream over the corresponding virtual channel at the contracted rate.
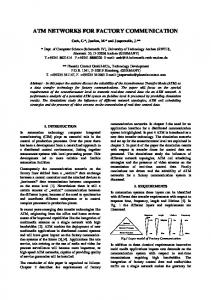
Figure 3: Functional structure of the FDDI-ATM adaptor The interface between the router and the ATM module consists of a memory area where the router stores packets. The router indicates, for each packet, its position in the interface memory and the virtual channel over which ATM transmission should occur. The ATM module segments one packet into a cell stream, whose peak rate is contracted by the user. then it indicates to the router the end of packet transmission [11]. 3. SYSTEM MODELING 3.1. Traffic modeling One of the key aspects of this work is the use of real traffic traces. This lets the results be based on real conditions rather than on suppositions led by theoretical models [12]. Asynchronous data come from traces recorded at the connecting point of the department router to the campus network of the university. This router is fed by the aggregate traffic from several LANs and interconnection devices. The traces have been obtained at different dates and times and correspond exclusively to IP traffic. Figure 4 displays the average load from each of the 31 stations devoted to
asynchronous traffic, in order to show the volume of traffic they manage. Here Payload stands for the whole IP frame, and Overhead includes MAC FDDI overheads. The total load from these stations is 1.02 Mbps. Overheads take 118.87 Kbps, so 905.66 Kbps are left for payloads.
Figure 4: Average load for each asynchronous station The shortest recorded IP packet length is 35 bytes (which corresponds to 1 ATM cell) and the longest is 1500 bytes (32 ATM cells). This is due to the fact that all LANs in the campus are based on Ethernet, and IP packet size is set to fit Ethernet frame. This allows a further study based on Ethernet instead of FDDI without significant changes in the simulation algorithms. In the case of synchronous traffic, the traces have been recorded directly at the output of video codecs using DCT-based variable bit-rate coding algorithms. Their frame frequency ranges from 10 Hz to 50 Hz, in order to avoid correlated results. Progressive sequences (1 video frame per picture) and interlaced sequences (two frames per picture) have been considered, in order to achieve a general environment. The traces are read in a circular way, i.e. when the end is reached, it restarts reading from the beginning. Table 1 shows the most important parameters of these traces. Table 1:
Characteristics of the synchronous traffic traces Interlaced
Average Bit-Rate
Average Overhead Load
Maximum Bit-Rate
640
Yes
1.86×10⁷
8.08×10⁵
3.68×10⁷
10 Hz
79
No
6.73×10⁵
3.11×10⁴
1.16×10⁶
3
25 Hz
150
No
6.90×10⁶
3.01×10⁴
9.55×10⁶
4
30 Hz
225
No
4.69×10⁶
2.08×10⁵
1.06×10⁷
Trace
Frame Frequency
Number of Frames
1
50 Hz
2
The values in the “Average Bit-Rate” column are computed by dividing the total amount of bits in the sequence by the time needed to transmit them. As the sequence bit-rate is variable, each frame may be transmitted at different bit-rates.
The “Maximum Bit-Rate” column contains the bit-rate of the most intensive frame in each sequence. Trace 1 has been provided by the Instituto Superior Tecnico in Lisbon, Portugal. Traces 2 to 4 have been obtained by Telefonica I+D in Madrid, Spain. To improve the system performance by reducing the effect of overheads, the maximum packet length has been set to a greater value than the standard 576 bytes. The chosen value is 1500 bytes in order to make the interface be compatible with Ethernet. It is low enough, compared to FDDI frame size (4500 bytes) and AAL5 maximum frame size (65536 bytes), which smooths the effects of packet losses due to single bit errors. The average load due to synchronous traffic is 32.21 Mbps. The load due to asynchronous traffic is 1.02 Mbps. Therefore, the total average load is 33.23 Mbps including overheads, so FDDI works at a third of its capacity. 3.2. FDDI modeling FDDI has been simulated by assuming that the bit-delay at every station is zero. Propagation time has been taken into account (lightwave speed). Several values of TTRT (5, 10 and 20 ms) have been tested [13], without observing significant differences among their results. Initially, TRT is set to zero for all stations. The preamble length in all FDDI frame headers has been set to 16 symbols (8 bytes) [3]. Video frames are transmitted by means of UDP/IP packets whose maximum payload length is 1500 bytes, as justified above. In order to model the system real behavior without the availability of real ATM traffic records, the simulations are carried out as follows: a) FDDI stations send traffic to one another and the adaptor. b) The adaptor generates a cell stream. c) Step a) is repeated by replacing traffic coming from the reference station by a trace recorded at step b) containing information about the packets from the reference station which have crossed the adaptor. 3.3. ATM modeling The ATM network is assumed to introduce a constant delay. This assumption is justified by the fact that this work is based on the study of IP packet delay variations, and the contribution of cell delay variations to the value of packet delay is very low. The adaptors access the ATM network through a physical link of 150 Mbps, which is equivalent to 354 Kcells per second. The cells are transmitted at most at the contracted peak rate. If a burst of packet arrivals takes place, the buffer is likely to overflow, so information may be lost. Synchronous and asynchronous connections use virtual channels which are assigned different peak rates. the ATM network is not aware of the service each connection manages. 3.4. Adaptor modeling The critical points in modeling the adaptor rely on communication among the internal stages. In order to simplify the problem, the following assumptions are made:
- The FDDI interface does not require to buffer traffic coming from the FDDI ring, as it only passes to the router the frames addressed to it and discards the rest of them, so no delay is considered at this step. - In the FDDI interface, buffering is considered only at the LAN access from the interface. At this point, packets are waiting for the interface to get the token. This buffer is supposed to be large enough to produce no packet losses. - The router processing time is always considered constant and no buffer is required for communications with the FDDI interface. - The only buffer whose losses are considered is the one located at the access point to ATM, where packets wait for their segmentation into cells, because it has shown to be the most critical. The reason is that bursty traffic uses a constant rate connection, what requires an important buffering capability with associated packet losses and delay variations. - The reassembling process is supposed to be faster than peak cell arrival, so the buffer at this point only needs to be able to hold one IP packet. Once reassembled, this packet is forwarded to the router. No losses are thus expected if the buffer is correctly sized. The buffer giving access to ATM from the adaptor is shared by all connections, and its implementation is based on dynamic memory management. It represents a trade-off between spatial and temporal optimization. The considered buffer sizes are: 64 KB, 128 KB and 256 KB. As stated above, the ATM network offers a maximum stream of 150 Mbps (which in turn is equivalent to 354 Kslots per second). Each virtual channel requests the next available slot if there is a cell to transmit, at most at the contracted cell rate. The packet output time-stamp is considered as the instant of departure of the last cell of the packet In this work, only delay variations on whole IP packets are of interest. As stated above, ATM is not considered to introduce any delay variations. Thus the timestamp used at the remote FDDI interface is the same as the one at the local adaptor output. 4. TRAFFIC MEASUREMENTS 4.1. Simulation The simulations model 60 seconds of real time system performance, what represents 2.12×10⁷ ATM slots. Asynchronous traffic acts as background traffic for both FDDIs and the first ATM adaptor. According to the destination IP network address, traffic is either processed by the adaptor or discarded. Concerning synchronous traffic, Trace 1 is taken as the reference and the effects of the system on the traffic generated from it are studied from end to end. The other three traces are studied only until the first adaptor output. As initial conditions, all buffers are empty and TRT is set to zero at all FDDI stations. A transient period of 2 seconds is allowed in order to ensure that only steady-state results are obtained. To set peak rate for video connections, the average bit rate of each trace has been taken into account. However, the direct assignment of this value to the peak rate is not adequate for two reasons:
- Video stations generate variable rate traffic, what may originate important delay variations. - Each protocol involved in the transmission adds its own overheads, as shown in Figure 5. UDP/IP introduces 28 bytes [14]; AAL5 adds 8 bytes plus a pad to reach an AAL5 PDU length multiple of 48 bytes [9], and ATM adds 5 header bytes per cell. For each virtual channel, the cells are transmitted at most at a fixed rate once the packets are segmented. The packet arrivals which make this rate be exceeded are buffered while possible. In this work, these fixed rates have been set to multiples of the average rate of the video sequence assigned to that virtual channel: 1, 1.5 and 2. In fact, factors of 1.5, 2 and 2.5 (or 150%, 200% and 250%) have been used instead, in order to consider the overheads introduced by the protocols.
Figure 5: Frame formats at the most relevant system points The average total load from asynchronous stations is 1.02 Mbps. As the main focus of the study is on video traffic, a high peak cell rate is assigned to each virtual channel associated to asynchronous stations. In this work, 1 Mbps has been assigned to each asynchronous station. All the measures on delay jitter and losses are based on IP packet statistics. The global system delay for the reference connection is also presented at a video frame level. 4.2. Measured variables The key parameters when determining quality degradation in a video service are: loss of information and delay jitter. In the environment studied in this work, losses of information take place at the buffers at the access to ATM, due to the absence of flexibility on the virtual channels cell rate. Another source of information losses is the reception of excessively delayed information. The importance of these losses depends on both the receiver specifications and the internetwoking environment behavior, so their quantification is more subjective.
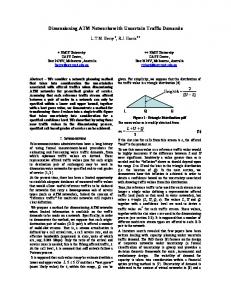
Delay variations are evaluated from three components: the adaptor access delay through FDDI; the delay imposed by the router-ATM interface; and delay on FDDI access from the remote router. The delay between the FDDI interface and the router is assumed to be constant. These delays are considered at both frame and packet levels. This intends to ease the quantification of their importance. 4.3. Results The delay variation introduced by each of the elements in the studied environment is shown in Figure 6.
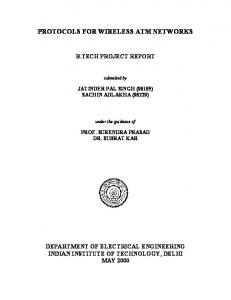
Figure 6: Delay variation measured at each analyzed point The following facts are interesting to be remarked: - The main source of delay variation is the ATM adaptor, because ATM has to transform a variable rate traffic sequence into a less flexible cell stream. A suitable buffer is then required, what is the origin of delays. FDDI is better suited for variable rate traffic as it is based on medium sharing. All these facts confirm the greater importance of the adaptor buffer, and hence the interest in its sizing. - The destination FDDI introduces less delay than the local FDDI despite their similar load. The source FDDI station is likely to deal with bursts of packets, which is the origin of queues and delays. These bursts are smoothed by the ATM network before arriving to the remote adaptor, so buffer occupancy and therefore the introduced delay are lower. Figure 6 shows results corresponding to a medium buffer size (128 KB) and a medium peak virtual channel rate (200%). All the other possible graphs show a similar pattern, but horizontally compressed or expanded according to buffer size and virtual channel rate values. Global video frame delay variations for different buffer sizes and virtual channel capacities are shown in Figure 7. This delay is computed as the difference between the generation of the video frame and the reception of the last packet from the frame. Delay variations grow with increasing buffer sizes. The lower the virtual
Figure 7: End-to-end delay variation for the studied virtual channel bandwidths (150%, 200%, 250%)
channel capacities, the stronger the delay variations. If video frame reception relies on one frame buffer, packets arriving with a delay above one frame period (e.g. 20 ms for 50 Hz sequences, as is the case of the reference trace) will have to be discarded. If two buffers are available, delays of up to 40 ms are allowed, and so on. If only one buffer is available, the number of discarded packets is very large, except for high virtual channel rates. If two frames are allowed, this number becomes nonsignificant at just a peak rate of 200% the average rate. For low virtual channel rates and large buffer sizes, the buffer empties slowly, so buffer occupancy increases and therefore delay becomes higher. Table 2 shows packet losses from the reference sequence due to overflows in the ATM access buffer and to excessive delays at reception (i.e. higher than 20 or 40 ms). Table 2:
Packet losses due to overflows and excessive delays Reason for packet losses
150%
200%
250%
128 KB
256 KB
2.4%
0.87%
0.4%
Delay > 20 ms
0.8636%
3.538%
4.623%
Delay > 40 ms
-
0.7407%
3.4968%
-
-
Overflows
Overflows
64 KB
0.29%
Delay > 20 ms
0.1144%
1.272%
1.272%
Overflows
0.00011%
-
-
All other cases do not show any packet loss. These results lead to a first conclusion: A growing buffer size reduces its losses, but the use of a low rate virtual channel may lead to transmission of excessively delayed information. Thus a long burst may reach the remote endpoint later than needed. Moreover, this obsolete information may also delay next packets in the connection. Therefore, in some cases it is better to use short buffers when transmitting real time traffic. Figure 8 shows buffer occupancy levels occurred at all studied situations. When the bandwidth of the connections is suitably dimensioned, an average-sized buffer is rarely filled up. But if some connections have been allocated too little bandwidth, the trend is to use all the available buffer capacity. This case yields excessive packet losses even for the rest of the connections sharing the buffer.
Figure 8: Buffer occupancy for each virtual channel at each buffer size To avoid both problems, the effects of limiting the time a packet can be buffered have been studied. Next section shows the results of this study. 5. RESULTS WITH LIMITED BUFFERING TIME This policy consists of removing packets which have been buffered longer than a time-out period. This is applied for all buffered packets when attempting to add a new one, and for the first packet in the queue when it is going to be segmented. Figure 9 shows the global delay variation for a virtual channel peak rate of 150% the trace average rate, when using this policy with time-outs of 20 ms (one video frame period) and 12 ms. The differences with Figure 7 are more outstanding for larger buffers, so the behavior found with short buffers without time-out is achieved now with larger buffers: short delay variation and moderately high losses.
Figure 9: Effect of applying time-outs (20 and 12 ms) over global delay variations at a virtual channel rate of 150%
The behavior using time-out is similar to limiting buffer size. Nevertheless, this approach is better than reducing buffer size because all packets are given a chance to enter the buffer so that only the obsolete ones are eliminated. Small-sized buffers discard packets regardless of their delay. Figure 10 shows the results obtained in the worst case (virtual channel peak rate at 150% of average trace bit-rate). They are presented in three-column sets: The first column in the set represents the case without time-out. The second and third columns represent the cases with a 20 ms (1 video frame) and 12 ms (≈ 2/3 of a frame) time-outs, respectively. Losses are shown for local buffers of 64, 128 and 256 KB, and for remote buffer sizes in the end system of one and two video frames (20 and 40 ms). Losses are classified according to its origin: overflow, time-out in the adaptor buffer, or excessively delayed information arrival in the end system.
Figure 10: Packet losses as a function of buffer size and maximum accepted delay
Best results are obtained with larger buffer, time-outs equal to or a little longer than one video frame and the buffer size at the end system of, at least, two frames. Larger buffers at the destination system could improve the problem of losses, but with the drawback of increasing delay and occupying large amounts of memory when using high resolution coding algorithms. The worst losses are caused by buffer overflow. In this case, all the connections may suffer from damage due to information loss in an indiscriminate way. Effectively, losses due to time-out only affect the undersized connections and, usually, only obsolete information is eliminated, what reduces losses due to excessive delay at the remote end. Excessively delayed packets have wasted system resources along all the internetworking environment, lowering the overall performance without any benefit on its communication quality. A situation to be avoided anyway is congestion in the shared buffer. It can be originated by an incorrectly-sized buffer or connection or both. Figure 11 shows buffer behavior for different sizes and time-outs when the virtual channel peak rate is 150% the average trace rate (again, the worst case). As shown in Figure 7, without time-out congestion still occurs even with large buffers. However, when using a well-dimensioned time-out, the buffer occupancy level decreases quickly, so average and large buffers never become completely congested. This ensures than new packets will always have room in the buffer, since they are only removed when they become obsolete.
Figure 11: Buffer occupancy behavior at a virtual channel rate of 150%
6. CONCLUSIONS In this work, the performance of an environment of two interconnected FDDI through an ATM network has been evaluated when combining asynchronous traffic (TCP/IP packets) and synchronous traffic (real time video). A contribution is the use of real traffic traces for modeling traffic for simulations. It has been shown than FDDI LANs are suitable for real time connections without needing the use of Hybrid Ring Control when load falls into reasonable levels (in the work, one third of the maximum capacity). The ATM network has been considered to be based on semipermanent virtual paths, where only peak bit
rate is policed. This limitation makes access to ATM become the hardest bottleneck in the system. If connections are slightly oversized, the overall performance of the system is quite good. Connection undersizing degrades its quality and seriously damage all other connections performance. Introducing a time-out for the packets prevents the buffer from being congested by excessively delayed packets and reduces delay variations for synchronous connections. This behavior improves performance of undersized connections and provides more robustness to the whole system. The work presented in this paper may be continued by extending the study to cover a full B-ISDN network, with more complex access policies and police functions. This forces to take into account new aspects such as delay jitter and cell losses. Acknowledgments The authors would like to acknowledge Telefonica I+D and the Instituto Superior Tecnico for their samples of video traffic. REFERENCES [1]
CCITT, Recommendation I.121, “Broadband Aspects of ISDN”, 1991.
[2]
S. L. Sutherland, J. Burgin, “B-ISDN Communications Magazine, vol. 31, no. 8, 1993.
[3]
Several authors, “FDDI Networking. Concepts, Standards and Practice”. IBC Technical Services Ltd, 1992
[4]
L. Mongiovì, M. Farrell, V. Trecordi, “A Proposal for Interconnecting FDDI Networks through B-ISDN”. Procedures of IEEE INFOCOM, 1991, pp. 11601167.
[5]
J. A. Manan, D. A. Harle, “Analysis of an FDDI/ATM Network Gateway”. IEE Tenth U.K. Teletraffic Symposium, 1993, pp. 13/1-13/9
[6]
T. Sakatani, T. Tajiri, “A Video/Audio Transmission System over LANs”. 5th International Workshop on Packet Video, 1993, pp. H3.1-H3.6.
[7]
M. Gerla, T.-Y. C. Tai, G. Gallassi, “Internetting LANs and MANs to BISDNs for Connectionless Traffic support”. IEEE Journal on Selected Areas in Communications, October 1993.
[8]
P. E. Boyer, D. P. Tranchier, “A reservation principle with applications to the ATM traffic control”. Computer Networks and ISDN systems, no. 24, 1992, pp. 321-324.
[9]
J. D. Cavanaugh, T. J. Salo, “Internetworking with ATM WANs”. Minnesota Supercomputer Center, Inc., 1992.
Internetworking”.
IEEE
[10] D. Katz, “Transmission of IP and ARP over FDDI Networks”. RFC 1390, cisco systems, Inc., 1993. [11] SARA Chipset Technical Manual. Transwitch Corporation, 1992.
[12] R. Cáceres, “Measurements of Wide Area Internet Traffic”. Computer Science Division, UCB, 1989. [13] R. Jain, “Performance Analysis of FDDI Token Ring Networks: Effects of Parameters and Guidelines for Setting TTRT”. SIGCOMM’90, 1990, pp. 264275. [14] U. Black, “TCP/IP and Related Protocols”. McGraw-Hill, Inc., 1992.