Desalination 237 (2009) 305–317
Performance optimization of the humidification– dehumidification desalination process using mathematical programming S.M. Soufaria, M. Zamena, M. Amidpourb* a
b
Iranian Research and Development Center for Chemical Industries (IRDCI), PO Box 13145-1494 Tehran, Iran Department of Mechanical Engineering, K.N. Toosi University of Technology, PO Box 16765-3381, Tehran, Iran Tel. +98 (21) 8867-7272; email:
[email protected] Received 27 May 2007; Accepted 6 January 2008
Abstract In this paper the humidification–dehumidification desalination process is studied and its performance optimized using mathematical programming. An advantage of this method is consideration of the simultaneous effect of various parameters on process performance. An NLP system model is solved for three objective functions: minimization of specific thermal energy consumption, maximization of productivity and maximization of condenser heat recovery. The solutions have been improved especially from a productivity point of view in comparison with previous studies. The productivity objective function leads to the best solution if there is no limitation for the humidifier inlet water temperature. Otherwise, the specific energy objective function seems to be better than others. In the next step the effect of important parameters on optimum operation point of the HD process is analyzed and related variation curves are presented. Results reveal that the water to air mass flow rate ratio (L/G) is the most effective parameter and has an optimum value. Also the humidifier inlet water temperature will be an important parameter. The upper temperature results in more productivity and a smaller heat transfer area. But minimum specific thermal energy consumption of the system occurs at an optimum temperature. Finally, the analysis of the dehumidifier inlet water temperature shows that if the humidifier inlet water temperature is high, the specific thermal energy consumption can be decreased more through recycling of the outlet humidifier water into the dehumidifier. Keywords: Desalination; Humidification–dehumidification process; Optimization; Mathematical programming
1. Introduction Conventional desalination methods such as MSF, ME, VC and RO are suitable for large and *Corresponding author.
medium capacity fresh water production. But most remote arid areas need low capacity desalination systems. Air humidification–dehumidification (HD) desalination will be a suitable choice for fresh water production when the
0011-9164/09/$– See front matter © 2008 Elsevier B.V. All rights reserved doi:10.1016/j.desal.2008.01.024
306
S.M. Soufari et al. / Desalination 237 (2009) 305–317
demand is decentralized. HD is a low temperature process where total required thermal energy can be obtained from solar energy. Capacity of HD units is between conventional methods and solar stills [1]. Most investigations on the HD desalination process have focused on productivity and efficiency improvement. In 1990 Farid and Al-hallaj [2] constructed a HD desalination unit in Basrah, south of Iraq. The unit produced 12 L/d.m2 of solar collector surface which was about three times more than production of a single-basin solar still under the same solar conditions [3]. However, a very high pressure drop in the condenser and humidifier increased the electrical power consumption of the blower to a level which makes the process uneconomical. Then, two units of different sizes were constructed and operated in Jordan reported by Alhallaj et al. [4] and Farid et al. [5]. They found that the effect of water flow rate on heat and mass transfer coefficients is more significant than air flow rate. Also they concluded that natural circulation of air is preferred over forced circulation. Another unit was built in Malaysia by Nawayseh et al. [6]. They developed a simulation program to correlate with experimental results and studied the effect of dehumidifier, humidifier and solar collector surface on daily production of the unit. The effect of feed water flow rate on production was also studied, showing the existence of maximum desalination production. Ben Bacha et al. [7] presented a comprehensive work including modeling, simulation and experimental validation of a solar HD system and have called it the solar multiple condensation evaporation cycle (SMCEC) technique. They concluded that perfect insulation of the unit, high water temperature and flow rate at the entrance of evaporation tower, low temperature of water at the entrance of condenser and hot water recycling by injection at the top of evaporation tower can improve operation and production of system.
Nevertheless, no comprehensive research on optimization of the HD desalination process was conducted. Ben Bacha et al. [8] improved the productivity through modification of some effective parameters. But because of plurality of the effective parameters and their simultaneous effects on HD performance, the trial-and-error approach does not guide the designer to the optimal design. Hou et al. [9] utilized pinch technology to optimize performance of the HD process. They maximized condenser heat recovery through composite curves. They found that there is an optimum value for water to air flow rate ratio (L/G). But they have not taken the effect of humidifier inlet temperature and solar collector efficiency into account. In this paper an attempt is made to present a perfect simulation of a HD process and optimize the process through mathematical programming with various objective functions.
2. Principles of the HD process The HD process is based on the fact that the vapor carrying capability of air increases progressively with temperature. For example 1 kg of dry air can carry 0.5 kg of vapor when its temperature increases from 30 to 80°C. The HD unit is the distillation under atmospheric conditions by an air loop saturated with water vapor, and has three main sections: the humidifier, dehumidifier and heat source. In the humidifier, air and water, where one or both of them have been heated by an external heat source, are in contact and a certain amount of vapor, extracted by air. Hot and humid air leaves the humidifier and enters the dehumidifier. In this section, water vapor is distilled by bringing the humid air in contact with a cooled surface which causes the condensation of the vapor in the air and production of fresh water. Generally, the
S.M. Soufari et al. / Desalination 237 (2009) 305–317
307
Fig. 2. Element of the humidifier volume.
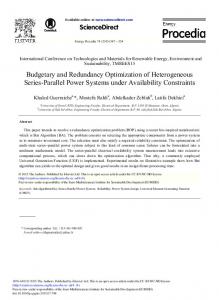
compatible with the HD process. In this paper the HD desalination process with a closed air cycle and water heating technique is studied. Fig. 1 shows the process schematically.
Fig. 1. Sketch of the HD unit with a closed air cycle and water heating.
latent heat of condensation is used for preheating the salt feed water. The HD process can be used in a closed or open air cycle. In an open air cycle, the amount of fresh air feed to the unit increases water productivity while the closed air cycle has the higher thermal efficiency. The next section is the heat source for providing the heat required for increasing air temperature and surface evaporation in the humidifier. In order to provide it air or water or both of them can be heated. Water heating techniques are more available and cheaper than air heating. The HD process will be used in ambient pressure and there is no necessity for high temperature in the evaporation process. That is why a low-grade heat source such as solar energy or waste heat from other processes can be used. Solar energy is available in areas that need drinking water and as an energy source is very
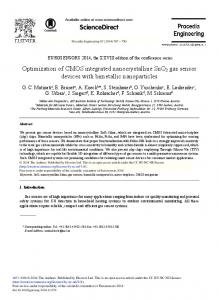
3. Mathematical modeling For mathematical modeling of the HD process, the governing equations of the process should be extracted. These equations are based on heat and mass balance. 3.1. Humidifier The balance is done on a volume element of height dz (Fig. 2). The following assumptions have been considered: C The process is operating under adiabatic conditions. C The water distribution over the packed bed is uniform and hence there is only a vertical gradient of temperature and humidity. As shown in Fig. 2 it can be written for control volume 1:
dm we dm ve m ae dωe
(1)
The following heat balance is confirmed for the C.V.2 (water side).
308
S.M. Soufari et al. / Desalination 237 (2009) 305–317
dTwe hwe aHe Twe Tie m weCwe dz
(2)
For C.V.3 (air side) two equations can be written. The first is a mass balance and the second is a heat balance:
de kae a Me ie e dz m ae
(3)
dTae hae a He Tie Tae m ae Cae eCve dz
(4)
Fig. 3. Element of dehumidifier volume.
C C.V. 2: Finally heat balance for interface is as follows:
H we a He Twe Tie d z hac a He Tie Tae d z Lve kac a Mc ie c d z
(5)
4
3
10 T 7.06 10 Tie 0.077 2 ie
(8)
C C.V. 3
The interface is assumed to be a film of saturated air. Therefore Tie and ωie are dependent variables. Stocker and Jones [10] introduced an experimental relation for evaluation of absolute humidity according to temperature which has a suitable accuracy:
ie f exp Tie 2.19 106 Tie3 1.85
d Twc hwc a Hc Tic Twc dz m wc Cwc
d c kac a Mc c ic m ac dz
(9)
h a T T d Tac ac Hc ac ic dz m ac Cac c Cvc
(10)
(6) And for the interface:
hwc a Hc Twe Tic hac a Hc Tic Tac
3.2. Dehumidifier
Lvc kac a Mc ic c
(11)
With the same assumptions for a humidifier, the governing equations of the dehumidification process are derived similarly for control volumes shown in Fig. 3. C C.V.1:
ωic is evaluated using the Stocker and Jones relation:
d m d d m vc m ac d c
ic f exp Tic
(7)
(12)
309
S.M. Soufari et al. / Desalination 237 (2009) 305–317
Lve kae ie (i ) ae (i ) hwe Twe (i ) Tie (i )
3.3. Heat source In the HD process dehumidifier outlet water needs to be heated up to the temperature required for humidifier entrance. The heat rate needed for heating of water with a constant flow rate is given as:
p T Q mC
(13)
4. Mathematical programming model Each mathematical programming model includes two parts: the objective function and constraints. Objective function will be discussed later. Basic constraints are equations presented in the previous sections. As most of these equations are differential, they should be formed as algebraic equations using a finite difference method. So, humidifier and dehumidifier towers are divided to n and m elements, respectively. By adding the constraints related to parameters such as closed air cycle, distilled water flow rate, energy consumption, pinch temperature difference and others, the primary model is given as follows:
z h a Twe (i 1) Twe (i ) 1 e we e m weCwe z h a Tie (i ) e we e m weCwe
z h a Ti (i ) e ae e m aeCe
(14)
(15)
,1 i n
(18)
ie (i ) f exp Tie (i )
,1 i n
(19)
z h a Twc ( j 1) Twc ( j ) 1 c wc c m wcCwc z h a Tic ( j ) c wc c m wc Cwc
(20)
1 j m
z h a Tac ( j 1) Tac ( j ) 1 c ac c m acCc z h a Tic ( j ) c ac c m ac Cc
(21)
1 j m
Lvc kac ic ( j ) c ( j ) hwc Twc ( j ) Tic ( j ) 1 j m
(22)
c ( j ) f exp Tac ( j )
1 j m
(23)
ic ( j ) f exp Tic ( j )
1 j m
(24)
m ae m ac
(25)
m we (1) m wc
(26)
Tae (1) Tac (1)
(27)
1 i n
m we (i 1) m we (i ) m ae ae (i 1) ae (i ) 1 i n
e (i ) f exp Tae (i )
hac Tac ( j ) Tic ( j )
1 i n
z h a Tae (i 1) Tae (i ) 1 e ae e m aeCe
(17)
hae Tae (i ) Tie (i ) ,1 i n
(16)
310
S.M. Soufari et al. / Desalination 237 (2009) 305–317
Tae ( n ) Tac (m )
(28)
Twe (i ) Tae (i ) Tpe
1 i n
(29)
Tac ( j ) Twc ( j ) Tpc
1 j m
(30)
m d m we (1) m we (n )
(31)
Q m wc Cwc Twe (1) Twc (1)
(32)
The above-mentioned set of equations and inequalities may have various solutions which objective function specifies the best one. For performance optimization of the HD process, three objective functions are more suitable: I. Minimization of specific thermal energy needed for heating of dehumidifier output water which is expressed as:
Min specific energy
Q m d
(33)
II. Maximization of distillated water flow rate to feed water flow rate ratio which is expressed as:
Max productivity
m d m wc
(34)
III. Maximization of heat recovery in the dehu-midifier, which is expressed as:
Max HR
Twc (1) Twc ( m ) Twe (1) Twc ( m )
(35)
5. Results and discussion The model was solved and the obtained results are analyzed in this section. The values of physical parameters such as heat capacity and evaporation latent heat are calculated for mean operation temperature of towers. For heat transfer
coefficients, medium values from past experiments [6,7,11] were used. Also mass transfer coefficients were evaluated by using the Lewis relation. 5.1. Comparison between objective functions In the first step, the model was solved with three objective functions for a system with feed water temperatures of 15, 20 and 25°C and a pinch temperature difference of 4°C for both humidifier and dehumidifier. Results are shown in Table 1. The maximum allowable temperature of the humidifier inlet water was assumed to be 80°C. In comparison with previous studies the solutions have been improved, especially from a productivity point of view. As shown, if humidifier inlet water temperature is fixed, all of objective functions give the same solutions. If not, the search engine finds the optimum value for this temperature; solutions are different but nearly together. In solutions obtained from the model with objective function II, to increase the evaporation rate, maximum allowable temperature of humidifier inlet water has been selected. Achieving this temperature by using solar flat plate collectors is difficult. If the required thermal energy for system is supplied through a source which can provide high temperature, this objective function will be very suitable because it gives the highest productivity and the lowest heat transfer area. Analysis of other solutions shows that both objective functions I and III are suitable for solar systems. However, solutions obtained from objective function I are either better than those given by III or the same as them with respect to the dehumidifier inlet water temperature. 5.2. Effect of important parameters on optimum operation point of system In this section in order to achieve a better
311
S.M. Soufari et al. / Desalination 237 (2009) 305–317 Table 1 Comparison of solutions with various objective functions in
Objective Twc function (EC) I II III I II III I II III I II III
15 15 15 20 20 20 25 25 25 20 20 20
Twein (°C) Fixed
Optimized 52 80 50.3 66.2 80 59.1 80 80 80
70 70 70
Ae m 2 Ac m 2 m d kg/h m d kg/h
Specific energy (Wh/kg)
Prod (%)
HR (%)
L/G
355.308 403.862 355.985 406.949 410.476 410.371 403.619 403.620 403.618
3.66 6.44 3.48 4.50 5.96 3.76 5.54 5.54 5.54
69.8 65.6 69.8 65.9 65 66.1 65.1 65.1 65.1
1.62 2.51 1.59 2.12 2.75 1.86 3.11 3.11 3.11
4.3335 2.0841 4.5320 2.8990 1.9951 3.5546 1.8624 1.8624 1.8624
8.5614 4.6040 8.9428 6.0132 4.6028 7.0474 4.7332 4.7330 4.7332
407.464
4.91
65.6
2.28
2.6025
5.5491
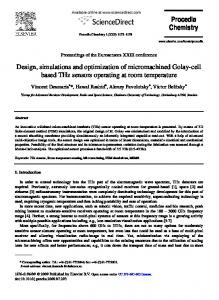
insight of the HD process, effects of variation in some parameters on specific thermal energy consumption are analyzed and discussed. It can be claimed that the water to air mass flow rate ratio (L/G) is the most important effective operating parameter of the HD desalination process. Fig. 4 shows minimum specific thermal energy consumption as a function of L/G for two states. In the first state the humidifier inlet water temperature is optimized and in the second one this temperature is imposed to the model as a fixed value. As shown the curves have a minimum point. Increment of L/G has two opposite effects. On one hand, with an increase of L/G, air is heated to a higher temperature. Therefore, because of high vapor absorption capability of air at high temperatures, productivity increases and hence specific thermal energy consumption decreases. On the other hand, a decrease of air mass flow rate rather than water mass flow rate leads to lower vapor absorption by air. Therefore, productivity decreases and hence specific thermal energy consumption increases. Before the minimum point, a second effect is stronger but after
Fig. 4. Effect of L/G on minimum specific thermal energy in consumption, Twc =20EC; ΔTPe=ΔTPc=4EC.
that the first effect becomes gradually strong and overcomes. As was predictable, the first curve is situated under the second. Also it is shown that after the optimum point, minimum specific thermal energy consumption in the first curve, contrary to the second curve, increases very slowly, which explains the high optimized temperature of the humidifier inlet water.
312
S.M. Soufari et al. / Desalination 237 (2009) 305–317
Fig. 5. Optimum productivity as a function of L/G, in Twc =20EC; ΔTPe=ΔTPc=4EC.
Fig. 7. Effect of the humidifier inlet water temperature on minimum specific thermal energy consumption, in Twc =20EC; ΔTPe=ΔTPc=4EC.
Figs. 5 and 6 show that with increase of L/G optimum productivity is increased and optimum required heat transfer area for humidifier and dehumidifier is decreased. Another important parameter specified in Fig. 4 is the humidifier inlet water temperature. Fig. 7 shows the minimum specific thermal energy consumption as a function of this temperature. This curve has also an optimum point. At temperatures lower than optimum value, an increase of minimum specific thermal energy consumption is more intense. Fig. 8 shows that with an increase of the humidifier inlet water
Fig. 6. Optimum humidifier and dehumidifier surfaces as in a function of L/G, Twc =20EC; ΔTPe=ΔTPc=4EC.
Fig. 8. Optimum L/G as a function of the humidifier inlet in water temperature, Twc =20EC; ΔTPe=ΔTPc=4EC.
temperature, the optimum L/G is increased. In addition, the upper temperature results in more optimum productivity and less optimum heat transfer area of the humidifier and dehumidifier as shown in Figs. 9 and 10, respectively. Humidifier and dehumidifier heat transfer areas are other parameters that affect the performance of the HD process. Figs. 11 and 12 show minimum specific thermal energy consumption of the system as a function of the humidifier and dehumidifier heat transfer area respectively. As a result, if the humidifier and dehumidifier area is more than optimum required area, the minimum specific thermal energy consumption more greatly increases.
S.M. Soufari et al. / Desalination 237 (2009) 305–317
Fig. 9. Optimum productivity as a function of in the humidifier inlet water temperature, Twc =20EC; ΔTPe=ΔTPc=4EC.
Fig. 11. Effect of humidifier heat transfer area on minimum specific thermal energy consumption, in Twc =20EC; ΔTPe=ΔTPc=4EC.
Fig. 13. Effect of the dehumidifier inlet water temperature on minimum specific thermal energy consumption, ΔTPe=ΔTPc=4EC.
313
Fig. 10. Optimum humidifier and dehumidifier heat transfer area vs. the humidifier inlet water temperature, in Twc =20EC; ΔTPe=ΔTPc=4EC.
Fig. 12. Effect of dehumidifier heat transfer area on minimum specific thermal energy consumption, in Twc =20EC; ΔTPe=ΔTPc=4EC.
Finally effect of dehumidifier inlet water temperature on minimum specific thermal energy consumption of HD system is analyzed. One might say that this is temperature of salt water at project zone. It is specified and does not need to be analyzed. But in the next section a method for modifying this temperature will be presented which results in decreasing specific thermal energy consumption. Fig. 13 shows the minimum specific thermal energy consumption of the system as a function of dehumidifier inlet water temperature for different humidifier inlet water temperatures. A special manner of variation of
314
S.M. Soufari et al. / Desalination 237 (2009) 305–317 in humidifier and dehumidifier as a function of T wc , respectively.
5.3. Greater decrease of specific thermal energy consumption using recycling
Fig. 14. Optimum L/G as a function of the dehumidifier in inlet water temperature, Twe =20EC; ΔTPe=ΔTPc=4EC.
Fig. 15. Optimum humidifier and dehumidifier surfaces as a function of the dehumidifier inlet water temperature, in Twe =20EC; ΔTPe=ΔTPc=4EC.
curves is interesting. All curves have a minimum in = 13EC. Furthermore, at higher temat T wc peratures of the humidifier inlet water the curves have a second minimum that decreases with an increase of dehumidifier inlet water temperature. Figs. 14 and 15 show the optimum L/G and optimum heat transfer areas required for the
With attention to Fig. 13, the second minimum point of curve is situated at a relatively high temperature of dehumidifier inlet water. If available salt water, which should be desalinated, has a lower temperature than the second minimum point, the warm discharge of the humidifier can be mixed with feed water to increase the temperature of the dehumidifier inlet water. As an example, for a system with a feed salt water temperature of 20EC and a maximum allowable humidifier inlet water temperature of 80EC, optimum results with and without recycling are presented in Table 2. It is observed that minimum specific thermal energy consumption has been decreased by about 9%. In addition the productivity has been increased to more than 2.7 times that is very considerable. Also humidifier surface has been reduced to half while the dehumidifier surface has been decreased a little. But the important weakness of this design is the requirement of a high temperature for the humidifier inlet water. Providing this temperature using solar flat-plate collectors is very difficult and moreover needs more collector surface. Fig. 16 shows that at temperatures higher than 72EC, minimum specific thermal energy consumption can be decreased using recycling, and the higher temperature results in greater reduction. In Fig. 17 the opti-
Table 2 Comparison of two systems with and without recycling Recycled percent
in (°C) Twe
in Twc (EC)
Specific energy (Wh/Kg)
Prod (%)
L/G
0 69.4
66.2 80
20 41.1
406.949 371.039
4.50 12.40
2.12 4.93
Ae m d
m2 kg/h
2.8990 1.5023
Ac m d
m2 kg/h
6.0132 5.8694
S.M. Soufari et al. / Desalination 237 (2009) 305–317
Fig. 16. Effect of recycling on minimum specific thermal energy consumption, Tfeed = 20EC; ΔTPe=ΔTPc=4EC.
Fig. 18. Effect of recycling ratio on minimum specific in thermal energy consumption, Twe =75EC; Tfeed = 20EC; ΔTPe=ΔTPc=4EC.
mum value of the recycling ratio is shown. Fig. 18 shows the effect of the recycling ratio on the minimum specific thermal energy consumpin tion of a system with Twe = 75EC and feed water temperature of 20EC. This curve is similar to the curves of Fig. 13 because an increase of the recycling rate is equivalent to an increase of the dehumidifier inlet water temperature. Fig. 19 shows the minimum specific thermal energy needed as a function of feed water temperature for two states of with and without recycling. It is observed that if the feed water temperature is less
315
Fig. 17. Optimum recycling ratio as a function of the humidifier inlet water temperature, Tfeed = 20EC; ΔTPe = ΔTPc=4EC.
Fig. 19. Effect of feed water temperature on minimum in specific thermal energy consumption, Twe, max =80EC; ΔTPe=ΔTPc=4EC.
than 13°C or more than 16°C, minimum specific thermal energy consumption of system can be decreased using recycling. Fig. 20 shows the optimum recycling ratio. Two other choices can be proposed for recycling of the humidifier outlet water: recycling into the humidifier inlet and mixing with the dehumidifier outlet water. Both of these were inserted into the model. Solving the model showed that not only they cannot reduce specific
316
S.M. Soufari et al. / Desalination 237 (2009) 305–317 in is high, productivity can be increased If T we by recycling humidifier discharge water into the dehumidifier. Also, more recycling results in less humidifier surface and more dehumidifier surface.
7. Symbols
Fig. 20. Optimum recycling ratio as a function of the feed in water temperature, Twe, max =80EC; ΔTPe=ΔTPc=4EC.
thermal energy consumption but also increase it. The reason seems to be a decrease of the humidifier outlet water temperature. In the model medium values resulting from past experimental works [6,7,11] were used for heat transfer coefficients. Also mass transfer coefficients were evaluated using the Lewis relation. Analyzing the effects of these coefficients will be discussed in a future paper.
6. Conclusions In this paper, a HD desalination process was optimized with three objective functions using mathematical programming. A summary of the results are as follows: The results of the three models are nearly the same, but specific energy consumption and productivity objective functions are better than the heat recovery objective function. If there is no limit for humidifier inlet water temperature, productivity seems to be the best objective function. Water to air mass flow rate ratio (L/G) and in humidifier inlet water temperature (T we ) are more effective parameters on the process performance. Both of them have an optimum value. But upper in and a higher L/G ratio led to a decrease of the T we required heat transfer area for the humidifier and dehumidifier.
A a C h k Lv m ˙ Q T z ω
— — — — — — — — — — —
Surface area, m2 Specific area, m2/m3 Specific heat, J/kgK Heat transfer coefficient, W/m2K Mass transfer coefficient, kg/m2S Evaporation latent heat, J/kg Mass flow rate, kg/s Heat transfer rate, W Temperature, K, EC Height, m Specific humidity, kg vapor/kg dry air
Subscripts a c d e H i M P v w
— — — — — — — — —
Air Condenser (dehumidifier) Distillated water Evaporator (humidifier) Heat Interface Mass Pinch Vapor Water
References [1] N.K. Nawayseh, M.M. Farid, A.Z. Omar and A. Sabrin, Solar desalination based on humidification process—II. Computer simulation, Energy Conv. Manage., 40 (1999) 1441–1461. [2] L.G. Rodriguez, Seawater desalination driven by renewable energies: A review, Desalination, 143 (2002) 103–113.
S.M. Soufari et al. / Desalination 237 (2009) 305–317 [3] M.M. Farid and F. Hamad, Performance of a singlebasin solar still, Renewable Energy, 3 (1993) 75–83. [4] S. Al-Hallaj, M.M. Farid and A.R. Tamimi, Solar desalination with humidification–dehumidification cycle: Performance of the unit, Desalination, 120 (1998) 273–280. [5] M.M. Farid, N.K. Nawayseh, S. Al-Hallaj and A.R. Tamimi, Solar desalination with humidification dehumidification process: Studies of heat and mass transfer, Proc., Conference: SOLAR 95, Hobart, Tasmania, 1995, pp. 293–306. [6] N.K. Nawayseh, M.M. Farid, S. AL-Hallaj and A.R. Tamimi, Solar desalination based on humidification process: I–Evaluating the heat and mass transfer coefficients, Energy Conv. Mgmt., 40 (1999) 1423–1439. [7] H. BenBacha, M. Bouzguenda, M.S. Abid and A.Y. Mallej, Modeling and simulation of a water desalination station with solar multiple condensation
[8]
[9]
[10] [11]
317
evaporation cycle technique, Renewable Energy, 18 (1999) 349–365. H. BenBacha, M. Bouzguenda, T. Damak, M.S. Abid and A.Y. Mallej, A study of a water desalination station using the SMCEC technique: Product optimization, Renewable Energy, 21 (2000) 523– 536. S. Hou, S. Ye and H. Zhang, Performance optimization of solar humidification–dehumidification desalination process using pinch technology, Desalination, 183 (2005) 143–149. W.F. Stocker and J.W. Jones, Refrigeration and Air Conditioning, McGraw Hill, Singapore, 1982. J. Orfi, M. Laplante, H. Marmouch, N. Galanis, B. Benhamou, S. Ben Nasrallah and C.T. Nguyen, Experimental and theoretical study of a humidification–dehumidification water desalination system using solar energy, Desalination, 168 (2004) 151– 159.