Technical Report: SPEC-RG-2015-01
Performance-oriented DevOps: A Research Agenda SPEC RG DevOps Performance Working Group
Andreas Brunnert1 , André van Hoorn2 , Felix Willnecker1 , Alexandru Danciu1 , Wilhelm Hasselbring3 , Christoph Heger4 , Nikolas Herbst5 , Pooyan Jamshidi6 , Reiner Jung3 , Joakim von Kistowski5 , Anne Koziolek7 , Johannes Kroß1 , Simon Spinner5 , Christian Vögele1 , Jürgen Walter3 , Alexander Wert4 1 fortiss GmbH, München, Germany University of Stuttgart, Stuttgart, Germany 3 Kiel University, Kiel, Germany NovaTec Consulting GmbH, Leinfelden-Echterdingen, Germany 5 University of Würzburg, Würzburg, Germany 6 Imperial College London, London, United Kingdom 7 Karlsruhe Institute of Technology, Karlsruhe, Germany 2
4
DevOps Performance Working Group Mission Statement ®
The RG DevOps Performance Working Group fosters a combining software performance engineering performance management (APM) activities, e.g., agreement on definitions, specification of metrics, an methods, techniques, and tools for quantitative evaluation
Research
℠
August 7, 2015
General Topics of Interest research.spec.org • Performance and workload model extraction
www.spec.org SPE and APM Int
Contents 1
Introduction . . . . . . . . . . . . . . . . . . . . . . . . . . . . . . . . . . . . . . .
1
2
Context . . . . . . . . . . . . . . . . . . . . . . . . . . . . . . . . . . . . . . . . .
2
2.1
Enterprise Application Performance . . . . . . . . . . . . . . . . . . . . .
2
2.2
DevOps . . . . . . . . . . . . . . . . . . . . . . . . . . . . . . . . . . . . .
3
Performance Management Activities . . . . . . . . . . . . . . . . . . . . . . . . .
3
3.1
Measurement-Based Performance Evaluation . . . . . . . . . . . . . . . .
4
3.2
Model-Based Performance Evaluation . . . . . . . . . . . . . . . . . . . .
5
3.3
Performance and Workload Model Extraction . . . . . . . . . . . . . . . .
7
Software Performance Engineering During Development . . . . . . . . . . . . . .
14
4.1
Design-Time Performance Models
. . . . . . . . . . . . . . . . . . . . . .
15
4.2
Performance Awareness . . . . . . . . . . . . . . . . . . . . . . . . . . . .
16
4.3
Performance Anti-Pattern Detection . . . . . . . . . . . . . . . . . . . . .
18
4.4
Performance Change Detection . . . . . . . . . . . . . . . . . . . . . . . .
20
Application Performance Management During Operations . . . . . . . . . . . . .
22
5.1
Performance Monitoring . . . . . . . . . . . . . . . . . . . . . . . . . . . .
22
5.2
Problem Detection and Diagnosis . . . . . . . . . . . . . . . . . . . . . . .
24
5.3
Models at Runtime . . . . . . . . . . . . . . . . . . . . . . . . . . . . . . .
25
Evolution: Going Back-and-Forth between Development and Operations . . . . .
27
6.1
Capacity Planning and Management . . . . . . . . . . . . . . . . . . . . .
27
6.2
Software Architecture Optimization for Performance . . . . . . . . . . . .
29
7
Conclusion . . . . . . . . . . . . . . . . . . . . . . . . . . . . . . . . . . . . . . .
31
8
Acronyms . . . . . . . . . . . . . . . . . . . . . . . . . . . . . . . . . . . . . . . .
32
References . . . . . . . . . . . . . . . . . . . . . . . . . . . . . . . . . . . . . . . . . . .
34
3
4
5
6
i
Executive Summary DevOps is a trend towards a tighter integration between development (Dev) and operations (Ops) teams. The need for such an integration is driven by the requirement to continuously adapt enterprise applications (EAs) to changes in the business environment. As of today, DevOps concepts have been primarily introduced to ensure a constant flow of features and bug fixes into new releases from a functional perspective. In order to integrate a non-functional perspective into these DevOps concepts this report focuses on tools, activities, and processes to ensure one of the most important quality attributes of a software system, namely performance. Performance describes system properties concerning its timeliness and use of resources. Common metrics are response time, throughput, and resource utilization. Performance goals for EAs are typically defined by setting upper and/or lower bounds for these metrics and specific business transactions. In order to ensure that such performance goals can be met, several activities are required during development and operation of these systems as well as during the transition from Dev to Ops. Activities during development are typically summarized by the term Software Performance Engineering (SPE), whereas activities during operations are called Application Performance Management (APM). SPE and APM were historically tackled independently from each other, but the newly emerging DevOps concepts require and enable a tighter integration between both activity streams. This report presents existing solutions to support this integration as well as open research challenges in this area. The report starts by defining EAs and summarizes their characteristics that make performance evaluations for these systems particularly challenging. It continues by describing our understanding of DevOps and explaining the roots of this trend to set the context for the remaining parts of the report. Afterwards, performance management activities that are common in both life cycle phases are explained, until the particularities of SPE and APM are discussed in separate sections. Finally, the report concludes by outlining activities and challenges to support the rapid iteration between Dev and Ops. Keywords DevOps; Software Performance Engineering; Application Performance Management. Acknowledgements This work has been supported by the Research Group of the Standard Performance Evaluation Corporation (SPEC), by the German Federal Ministry of Education and Research (Andr´e van Hoorn, grant no. 01IS15004 (diagnoseIT)), and by the European Commission (Pooyan Jamshidi, grant no. FP7-ICT-2011-8-318484 (MODAClouds) and H2020-ICT-2014-1644869 (DICE)). SPEC, the SPEC logo, and the benchmark name SPECjEnterprise are registered trademarks of the Standard Performance Evaluation Corporation (SPEC) and the SPEC Research logo is a c 1988–2015 Standard Performance service mark of SPEC. Reprint with permission. Copyright Evaluation Corporation (SPEC). All rights reserved.
ii
Section 1. Introduction
1
Introduction
DevOps has emerged in recent years to enable faster release cycles for complex Information Technology (IT) services. DevOps is a set of principles and practices for smoothing out the gap between development and operations in order to continuously deploy stable versions of an application system (H¨ uttermann, 2012). Activities in both of these application life cycle phases often pursue opposing goals. On the one hand, operations (Ops) teams want to keep the system stable and favor fewer changes to the system. On the other hand, development (Dev) teams try to build and deploy changes to an application system frequently. DevOps therefore aims at a better integration of all activities in software development and operation of an application system life cycle outlined in Figure 1.1. This liaison reduces dispute and fosters consensus between the conflicting goals of DevOps. Automation in build, deployment, and monitoring processes are key success factors for a successful implementation of the DevOps concept. Technologies and methods used to support the DevOps concept include infrastructure as code, automation through deep modeling of systems, continuous deployment, and continuous integration (Kim et al., 2014). This report focuses on performance-relevant aspects of DevOps concepts. The coordination and execution of all activities necessary to achieve performance goals during system development are condensed as Software Performance Engineering (SPE) (Woodside et al., 2007). Corresponding activities during operations are referred to as Application Performance Management (APM) (Menasce, 2004). Recent approaches integrate these two activities and consider performance management as a comprehensive assignment (Brunnert et al., 2014a). A holistic performance management supports DevOps by integrating performance-relevant information. The report summarizes basic concepts of performance management for DevOps and use cases
Operations
Figure 1.1: Performance evaluation in the application life cycle (Standard Performance Evaluation Corporation, 2015) 1
Section 2. Context for all phases of an application life cycle. It focuses on technologies and methods in the context of performance management that drive the integration of Dev and Ops. The report aims on informing and educating DevOps-interested engineers, developers, architects, and managers as well as all readers that are interested in DevOps performance management in general. In each of the sections representative solutions are outlined. However, we do not claim that all available are covered and are happy to hear about any solution that we have missed (find our contact details on http://research.spec.org/devopswg)—especially, if they address some of the open challenges covered in this report. After introducing the context of the report in Section 2, the remaining structure is aligned to the different phases of an application life cycle. The underlying functionalities and activities to measure and predict the performance of application systems are explained in Section 3. Section 4 outlines performance management of DevOps activities in the development phase of an application system. Section 5 presents performance management DevOps activities in the operations phase. Section 6 describes how performance management can assist and improve the evolution of application systems after the initial roll-out. The report concludes with a summary and highlights challenges for further DevOps integration and performance management.
2
Context
This section provides information about the general context of this technical report. Section 2.1 will highlight the specific characteristics of enterprise applications from a performance perspective. Furthermore, in Section 2.2 we will outline the changes driven by the DevOps movement that make a new view on performance management necessary.
2.1
Enterprise Application Performance
The whole technical report focuses on a specific type of software systems, namely enterprise applications (EAs). This term is used to distinguish our perspective from other domains such as embedded systems or work in the field of high performance computing. EAs support business processes of corporations. This means that they may perform some tasks within a business process automatically, but are used by end-users at some point. Therefore, they often contain some parts that process data automatically and other parts that exhibit a user interface (UI) and require interactions from humans. In case of EAs these humans can be employees, partners, or customers. According to Grinshpan (2012), performance-relevant characteristics of EAs include the following. EAs are vital for corporate business functions, especially the performance of such systems is critical for the execution of business tasks. These systems need to be adapted continuously to an ever-changing environment and need customization in order to adjust to the unique operational practices of an organization. Their architecture represents server farms with users distributed geographically in numerous offices. EAs are accessed using a variety of front-end programs and must be able to handle pacing workload intensities. Even though we agree with the view on the performance characteristics of EAs as outlined by Grinshpan (2012), we left some of his points out on purpose. A main difference in our viewpoint is that EAs may expose UIs for customers as websites in the Internet such as in e-commerce companies like Amazon. This perspective is a bit different to the perspective of Grinshpan (2012) as he limits the user amount of EAs to a controllable number of employees or partners. Internetfacing websites may be used by an unpredictable number of customers. This characteristic poses specific challenges for capacity planning and management activities. Performance of EAs is described by the metrics response time, throughput, and resource utilization. Therefore, performance goals are typically defined by setting upper and/or lower 2
Section 3. Performance Management Activities bounds for these metrics and specific business transactions. In order to ensure that such performance goals can be met, several activities are required during development and operation of these systems as well as during the transition from Dev to Ops.
2.2
DevOps
DevOps indicates an ongoing trend towards a tighter integration between development (Dev) and operations (Ops) teams within or across organizations (Kim et al., 2014). According to Kim et al. (2014) the term DevOps was initially coined by Debios and Shafer in 2008 and became widespread used after a Flickr presentation in 20091 . The goal of the Dev and Ops integration is to enable IT organizations to react more flexibly to changes in the business environment (Sharma and Coyne, 2015). As outlined in the previous section, EAs support or enable business processes. Therefore, any change in the business environment often leads to changing requirements for an EA. This constant flow of changes is not well supported by release cycles of months or years. Therefore, a key goal of the DevOps movement is to allow for a more frequent roll-out of new features and bug fixes in a matter of minutes, hours, or days. This change can be supported by organizational and technical means. From an organizational perspective, the tighter integration of Dev and Ops teams can be realized by restructuring an organization. This can, for example, be achieved by setting up mixed Dev and Ops teams for single EAs that have end-to-end responsibility for the development and roll-out of an EA. Another example would be to set integrated (agile) processes in place that force Dev and Ops teams to work closer together. From a technical perspective this integration can be supported by automating as many routine tasks as possible. These routine tasks include things such as compiling the code, deploying new EA versions, performing regression tests, and moving an EA version from test systems to a production environment. For such purposes, Continuous Integration (CI) systems have been introduced and are now extended to Continuous Delivery (CD) or Continuous Deployment (CDE) systems (Humble and Farley, 2010). The differentiation between CI, CD, and CDE is mostly done by the amount of tasks these systems automate. Whereas CI systems often only compile and deploy a new EA version, CD systems also automate the testing tasks until an EA version that can be used as a release candidate. CDE describes an extension to CD that automatically deploys a release candidate to production. Even though the software engineering community in research and practice has already embraced the changes by introducing approaches for CI, CD, and CDE, a performance perspective for these new approaches is still missing. Specifically, the challenges of the two performance domains SPE and APM are often considered independently from each other (Brunnert et al., 2014a). In order to support the technical and organizational changes under the DevOps umbrella driven by the need to realize more frequent release cycles, this conventional thinking of looking at performance activities during Dev (SPE) and during Ops (APM) independently from each other needs to be changed. This report outlines existing technologies to support the SPE and APM integration and outlines open challenges.
3
Performance Management Activities
Even though performance management activities have slightly different challenges during Dev and Ops there are a lot of commonalities in the basic methods used. These common methods are outlined in this section. Section 3.1 starts with the most fundamental performance management activity which is the measurement-based performance evaluation. As measurement-based performance evaluation methods always have the drawback of requiring a system to measure performance metrics, model-based performance evaluation methods have been developed in order 1
http://itrevolution.com/the-convergence-of-devops/
3
Section 3. Performance Management Activities to overcome this requirement. Therefore, Section 3.2 focuses on performance modeling methods. Finally, Section 3.3 outlines existing approaches to extract performance models and open challenges for performance model extraction techniques.
3.1
Measurement-Based Performance Evaluation
Measurement-based performance evaluation describes the activity of measuring and analyzing performance characteristics from an executing EA. Measurement data can be obtained with event-driven and sampling-based techniques (Lilja, 2005; Menasc´e and Almeida, 2002). Eventdriven techniques collect a measurement whenever a relevant event occurs in the system, e.g., invocation of a certain method. Sampling-based techniques collect a measurement at fixed time intervals, e.g., every second. The tools that collect the measurements are called monitors and are divided into hardware monitors (typically part of hardware devices, e.g., Core Processing Unit (CPU), memory, and hard disk drive (HDD)) and software monitors. Integrating software monitors into an application is called instrumentation. Instrumentation techniques can be categorized into direct code modification, indirect code modification using aspect-oriented programming, or compiler modification, or middleware interception (Jain, 1991; Lilja, 2005; Kiczales et al., 1997; Menasc´e and Almeida, 2002). The instrumentation is classified as static when the instrumentation is done at design or compile time, and as dynamic if the instrumentation is done at runtime without restarting the system. The instrumentation and the execution of monitors can alter the behavior of the system at runtime. Software monitors can change the control flow by executing code that is responsible for creating measurements. They also compete for shared resources like CPU, memory, and storage. The impact of the instrumentation on response times and resource utilization is often called measurement overhead. The degree of measurement overhead depends on the instrumentation granularity (e.g., a single method, all methods of an interface, or all methods of a component), the monitoring strategy (event-driven vs. sampling-based), instrumentation strategy (static vs. dynamic), and also the types and quality of the employed monitors. What information is of interest and where the information is to be obtained depends on the performance goals and the life cycle phase of an EA. During Dev, performance metrics are usually derived using performance, load, or stress tests on a test system, whereas measurements can be directly taken from a production system. The specifics of these activities are outlined in the respective sections later in this report. However, it is important to understand that performance measurements are highly dependent on the system and the workload used to collect them. Therefore, results measured on a one system are not directly applicable for another different system. This is also true for different workloads. Therefore, special care needs to be taken when selecting workloads and test systems for measurement-based performance evaluations during Dev. An overview on available commercial performance monitoring tools is given by Gartner in its annual published report titled “Gartner’s magic quadrant for application performance monitoring” (Kowall and Cappelli, 2014). The current market leaders are Dynatrace (Dynatrace, 2015), AppDynamics (AppDynamics, 2015), NewRelic (New Relic, Inc., 2015), and Riverbed Technology (Riverbed Technology, 2015). Additionally, free and open source performance monitoring tools exist, e.g., Kieker (van Hoorn et al., 2012). Even though a lot of monitoring tools are available, there are still a lot of challenges to overcome when measuring software performance: • The configuration complexity of monitoring tools is often very high and requires a lot of expert knowledge. • Monitoring tools lack interoperability in particular with respect to data exchange and accessing raw data. 4
Section 3. Performance Management Activities • Selecting an appropriate monitoring tool requires a lot of knowledge of the particular features as some capabilities are completely missing from specific monitoring solutions. • Measurement-based performance evaluation during development requires a representative workload and usage profile (operational profile) to simulate users. In many cases, a replication of the productive system is not available. • Setting up a representative test system for measurement-based performance evaluations outside of a production environment is often associated with too much effort and cost. • The accuracy of measurement results is highly platform-dependent, the exact same measurement approach on Linux can exhibit completely different results on Windows for example. • Selecting appropriate time frames to keep historical data during operations is quite challenging. If the time period is too short it might happen that important data is lost too fast, if the period is too long a monitoring solution might run into performance problems itself due to the high amount of data it needs to manage.
3.2
Model-Based Performance Evaluation
Besides the measurement-based approach, performance behavior of a system can be evaluated using model-based based approaches. So-called performance models allow for representing performance-relevant aspects of software systems and serve as input for analytical solvers or simulation engines. Model-based approaches enable developers to predict performance metrics. This capability can be applied for various use cases within the life cycle of a software system, e.g., for capacity planning or ad-hoc analyses. The procedure is depicted in Figure 3.1. There are two forms of performance models available: analytical models and architecturelevel performance models. Common analytical models include Petri nets, Queueing Networks (QNs), Queueing Petri Nets (QPNs), or Layered Queueing Networks (LQNs) (Balsamo et al., 2004; Ardagna et al., 2014). Architecture-level performance models depict key performanceinfluencing factors of a system’s architecture, resources, and usage (Brosig et al., 2011). The UML Profile for Schedulability, Performance and Time (UML-SPT) (Object Management Group, Inc., 2005), the UML Profile for Modeling and Analysis of Real-Time and Embedded Systems (MARTE) (Object Management Group, Inc., 2011), the Palladio Component Model (PCM) (Becker et al., 2009), and the Descartes Modeling Language (DML) (Kounev et al., 2014) are examples for architecture-level performance models. The latter two models focus on performance evaluation of component-based software systems and allow to evaluate the impact of different influencing factors on software components’ performance, which are categorized by Koziolek (2010) as follows: • Component implementation: Several components can provide the same interface and functionality, but may differ in their response time or resource usage. • Required services: The response time of a service depends on the response time of its required services. • Deployment platform: Software components can be deployed on various deployment platforms, which consist of different software and hardware layers. • Usage profile: The execution time of a service can depend on the input parameter it was invoked with.
5
Section 3. Performance Management Activities Structure of System Application Server Administration
Data Access
Parser
Data Processor
Database
Business Administration
Behavior and Resource Demands of Interface Operation process
CPU demand = 150 ms
Customer
Performance Model Transformation
λ0
CPU
λ1
HDD
λ2
Execute Query CPU demand = 250 ms
Performance Model Simulator
Performance Model Solver
Response Time Utilization
Figure 3.1: Model-based performance evaluation • Resource contention: The execution time of software components depends on the waiting time it takes to contend required resources. Architecture-level performance models can be either simulated directly or automatically translated into analytical models and, then be processed by respective solvers. For instance, for PCM models different simulation engines and transformations to analytical performance models such as LQNs or stochastic regular expressions exist. Analytical solvers and simulation engines have in common that they allow for predicting performance metrics. Performance models can be created automatically either based on running applications (Brunnert et al., 2013b; Brosig et al., 2009, 2011) or based on design specifications. Regarding the latter approach, they can be derived from a variety of different design specifications such as the Unified Modeling Language (UML) including sequence, activity, and collaboration diagrams (Petriu and Woodside, 2002, 2003; Woodside et al., 2005; Brunnert et al., 2013a), execution graphs (Petriu and Woodside, 2002), use case maps (Petriu and Woodside, 2002), Specification and Description Language (SDL) (Kerber, 2001), or object-oriented specifications of systems like class, interaction, or state transition diagrams based on object-modeling techniques (Cortellessa and Mirandola, 2000). Performance models and prediction of performance metrics provide the basis to analyze various use cases, especially, to support the DevOps approach. For instance, performance models can be created for new systems during system development which intend to replace legacy systems. Their predicted metrics can then be compared with monitoring data of the existing systems from IT operations and, e.g., allow for examining whether the new system is expected to require less resources. Alternatively, performance models of existing systems can be automatically derived from IT operations, for example, using the approach by Brunnert et al. (2013b) 6
Section 3. Performance Management Activities for Java Enterprise Edition (Java EE) applications. Subsequently, design alternatives can be evaluated regarding component specifications, software configurations, or system architectures. This enables architects and developers to optimize an existing system for different purposes like efficiency, performance, but also costs and reliability (Aleti et al., 2013). System developers are also able to communicate performance metrics with IT operations and ensure a certain level of system performance across the whole system life cycle. Furthermore, model-based performance predictions can be applied to answer sizing questions. System bottlenecks can be found in different places and, for instance, examined already during system development. The ability to vary the workload in a model also allows to evaluate worst-case scenarios such as the impact of an increased number of users on a system in case of promotional actions. In this way, a system’s scalability can be examined as well by specifying increased data volumes that have to be handled by components as it may be the case in the future. Regarding the DevOps approach to combine and integrate activities from software development and IT operations, model-based performance evaluation is, for instance, useful for a) exchanging and comparing performance metrics during the whole system lifecycle, b) optimizing system design and deployment for a given production environment, and c) early performance estimation during system development. Selected challenges for model-based performance prediction include the following: • The representation of main memory as well as garbage collection is not explicitly integrated and considered in performance models, yet. • The selection of appropriate solution techniques requires a lot of expertise.
3.3
Performance and Workload Model Extraction
Performance models and workload models have to be created before we can deduce performance metrics. This section focuses on the extraction of architectural performance models, as they combine the capabilities of architectural models (e.g., UML) and analytical models (e.g., QN). Analytical models explicitly or implicitly assume resource demand of service execution per resource. However, they do not provide a natural linking of resource demands with software elements (e.g., components, operations) like architecture-level performance models useful for DevOPs process automation. In traditional long-term design scenarios models may by extracted by hand. However, manual extraction is expensive, error-prone and slow compared to automatic solutions. Especially in contexts where Dev and Ops merge and the models frequently change, automation is of great importance. The main goal of performance model extraction for DevOps is to define and build an automated extraction process for architectural performance models. Basically, architectural performance models provide a common set of features which have to be extracted. We propose to structure the extraction into the following three extraction disciplines: 1. System structure and behavior, 2. Resource demand estimation, 3. Workload Characterization. These extraction disciplines can be combined to a complete extraction process and are explained in the subsequent sections. Before, we will perform a dissociation of existing model extraction approaches and outline general challenges. Some predictive models estimate service times without linking resource demands to resources. Approaches targeting their extraction of such 7
Section 3. Performance Management Activities black-box models using, for example, genetic optimization techniques (e.g., Westermann et al. (2012) and Courtois and Woodside (2000)) are not considered in this report. These models serve as interpolation of the measurements. Neither a representation of the system architecture nor its performance-relevant factors and dependencies are extracted. Approaches to automatically construct analytical performance models, such as QN, have been proposed, e.g., by Menasc´e et al. (2005); Menasc´e et al. (2007) and Mos (2004). However, the extracted models are rather limited since they abstract the system at a very high level without taking into account its architecture and configuration. Moreover, for the extraction often imposes restrictive assumptions such as a single workload class or homogeneous servers. Others, like Kounev et al. (2011), assume the model structure to be fixed and preset (e.g., modeled by hand), and only derive model parameters using runtime monitoring data. Moreover, extraction software is often limited to a certain technology stack (e.g., Oracle WebLogic Server (Brosig et al., 2009)). We identify the following challenges and goals for future research on model extraction: • The assessment of validity and accuracy of extracted models is often based on a trial and error. An improvement would be to equip models with confidence intervals. • Model accuracy may expire if they are not updated on changes. Detection mechanisms are required to learn when models get out of date and when to update them. • Current performance modeling formalisms barely ensure the traceability between the running system and model instances. With reference to DevOps, more traceability information should be stored within the models. • The automated inspection of the System Under Analysis often requires technology-specific solutions. One solution, to enable less technology-dependent extraction tools, might be self-descriptive resources using standardized interfaces. • The extraction of performance capabilities is based on a combination of software and the (hardware) resources it is deployed at. This combined approach supports prediction accuracy but is less qualified regarding portability of insights to other platforms. One future research direction might be to extract separate models (e.g., separate middleware and application models). • Automated identification of an appropriate model granularity level. • Automated identification and extraction of parametric dependencies in call paths and resource demands. 3.3.1
System Structure and Behavior
The extraction of structure and behavior describes the configuration of the system. We subdivide the extraction into the extraction of a) software components, b) resource landscape and deployment, and c) inter-component interactions. Software systems that are assembled by predefined components may be represented by the same components in a performance model Wu and Woodside (2004). Predefined components (by the developer) are for example: web services, EJBs in Java EE applications (e.g., in Brunnert et al. (2013b); Brosig et al. (2009, 2011)), IComponent extensions in .NET or CORBA components. Those extraction techniques depend on predefined components. Existing approaches for software component extraction independent of predefined components target at source code refactoring in a classical development process. Examples for such reverse engineering tools and approaches are for example FOCUS (Ding and Medvidovic (2001)), ROMANTIC (Chardigny et al. (2008); Huchard et al. (2010)), Archimetrix (von Detten (2012)) or SoMoX (Becker et al. 8
Section 3. Performance Management Activities (2010); Krogmann (2010)). These approaches are either clustering-based, pattern-based, or combine both. They all identify components as they should be according to several software metrics. However, this does not necessarily correspond to the actual deployable structures, which is required during operation. Consequently, the identified components may be deployable in multiple parts. The reverse engineering approaches satisfy the ’Dev’ but not the ’Ops’ part of DevOps. An automated approach that works for DevOps independent of predefined component definitions is still an open issue. If no predefined components are provided, component definition requires manual effort. For manual extraction the following guidelines can be applied: i) classes that inherit from component interfaces (e.g., IComponent or EJBComponent) represent components, ii) all classes that inherit from a base class belong to the same component, iii) if component A uses component B then A is a composite component including B. Component extraction has the major challenges of technology dependency. Currently no tool that covers a wider range of component technologies is known to the authors. Besides software component identification one has to extract resource landscape and deployment. Automated identification of hardware and software resources in a system environment is already available in industry. For instance, Hyperic (2014) or Zenoss (2014) provide such functionalities. Given a list of system elements, system, network and software properties can be extracted automatically. Further, low-level aspects, like cache topology, can be extracted using open source tools like LIKWID (Treibig et al. (2010)). The deployment, which is the mapping of software to resources, can be extracted using service event logs. These logs usually contain for an executed operation (besides the execution time) identifiers that enable a mapping to the corresponding software component and the machine it was executed at. The extraction happens by the creation of one deployment component per couple of software component and resource identifier found within the event logs. The logging means no additional effort as the logs are also required for resource demand estimation. The extraction of a resource landscape in performance modeling is mostly performed semi-automatically. We ascribe this to mainly technical challenges, e.g., integration of information from different sources with many degrees of freedom (network, CPU count and clock frequency, memory, middleware, operating systems). The extraction of interactions between components differs for design time and runtime. At design time, models can be created using designer expertise and design documents (e.g., as performed in Smith and Williams (2002a); Menasc´e and Gomaa (2000); Petriu and Woodside (2002); Cortellessa and Mirandola (2000)). Commencing at a runnable state, monitoring logs can be generated. Automated extraction of structural information based on monitoring logs has the advantage that it tracks the behavior of the actual product as it is evolved. An effective architecture can be extracted which means that only executed system elements are extracted (Israr et al. (2007)). Further, runtime monitoring data enables to extract branching probabilities for different call paths (Brosig (2014)). Selected approaches for control flow extraction are by Hrischuk et al. (1999); Briand et al. (2006) and Israr et al. (2007). Hrischuk et al. (1999) and Briand et al. (2006) use monitoring information based on probes which are injected into the beginning of each response and propagated through the system. The approach of Israr et al. (2007) requires no probe information but is unable to model synchronization delays in parallel sub-paths which join together. In contemporary monitoring tools like DynaTrace, AppDynamics or Kieker the probe-based approach became standard. We identify the following major challenges for structure and behavior extraction: • Component extraction customization effort for case studies. Portability of technology dependent component extraction approaches is low. Current technology-independent component extraction approaches are considered not to be capable for a fully automated performance model extraction. 9
Section 3. Performance Management Activities • Monitoring customization effort for case studies. A complete extraction story requires a lot of tools with different interfaces to be connected. Especially, the portability and combination of multiple resource extraction approaches is a complex task. 3.3.2
Resource Demand Estimation
In architecture-level performance models, resource demands are a key parameter to enable their quantitative analysis. A resource demand describes the amount of a hardware resource needed to process one unit of work (e.g., user request, system operations, or internal actions). The granularity of resource demands depends on the abstraction level of the control flow in a performance model. Resource demands may depend on the value of input parameters. This dependency can be either captured by specifying the stochastic distributions of resource demands or by explicitly modeling parametric dependencies. The estimation of resource demands is challenging as it requires a deep integration between application performance monitoring solutions and operating system resource usage monitors in order to obtain resource demand values. Operating system monitors often only provide aggregate resource usage statistics on a per-process level. However, many applications (e.g., web and application servers) serve different types of requests with one or more processes. Profiling tools (Graham et al., 1982; Hall, 1992) are typically used during development to track down performance issues as well as to provide information on call paths and execution times of individual functions. These profiling tools rely on either fine-grained code instrumentation or statistical sampling. However, these tools typically incur high measurement overheads, severely limiting their usage during production, and leading to inaccurate or biased results. In order to avoid distorted measurements due to overheads, Kuperberg et al. (2008, 2009) propose a two-step approach. In the first step, dynamic program analysis is used to determine the number and types of bytecode instructions executed by a function. In a second step, the individual bytecode instructions are benchmarked to determine their computational overhead. However, this approach is not applicable during operations and fails to capture interactions between individual bytecode instructions. APM tools, such as Dynatrace (2015) or AppDynamics (2015), enable fine-grained monitoring of the control flow of an application, including timings of individual operations. These tools are optimized to be also applicable to production systems. Modern operating systems provide facilities to track the consumed CPU time of individual threads. This information is, for example, also exposed by the Java runtime environment. This information can be exploited to measure the CPU resource consumption of processing individual requests as demonstrated for Java by Brunnert et al. (2013b) and at the operating system level by Barham et al. (2004). This requires application instrumentation to track which threads are involved in the processing of a request. This can be difficult in heterogeneous environments using different middleware systems, database systems, and application frameworks. The accuracy of such an approach heavily depends on the accuracy of the CPU time accounting by the operating system and the extent to which request processing can be captured through instrumentation. Over the years, a number of approaches to estimate the resource demands using statistical methods have been proposed. These approaches are typically based on a combination of aggregate resource usage statistics (e.g., CPU utilization) and coarse-grained application statistics (e.g., end-to-end application response times or throughput). These approaches do not depend on a fine-grained instrumentation of the application and are therefore widely applicable to different types of systems and applications incurring only insignificant overheads. Different approaches from queuing theory and statistical methods have been proposed, e.g., response time approximation (Brosig et al., 2009; Urgaonkar et al., 2007), least-squares regression (Bard and Shatzoff, 1978; Rolia and Vetland, 1995; Pacifici et al., 2008), robust regression techniques (Cremonesi and Casale, 2007; Casale et al., 2008), cluster-wise regression (Cremonesi et al., 2010), Kalman Filter (Zheng et al., 2008; Kumar et al., 2009a; Wang et al., 2012), optimization tech10
Section 3. Performance Management Activities niques (Zhang et al., 2002; Liu et al., 2006; Menasc´e, 2008; Kumar et al., 2009b), Support Vector Machines (Kalbasi et al., 2011), Independent Component Analysis (Sharma et al., 2008), Maximum Likelihood Estimation (Kraft et al., 2009; Wang and Casale, 2013; P´erez et al., 2015), and Gibbs Sampling (Sutton and Jordan, 2011; Perez et al., 2013). These approaches differ in their required input measurement data, their underlying modeling assumptions, their output metrics, their robustness to anomalies in the input data, and their computational overhead. A detailed analysis and comparison is provided by Spinner et al. (2015). A Library for Resource Demand Estimation (LibReDE) offering ready-to-use implementations of several estimation approaches is described in Spinner et al. (2014). We identify the following areas of future research on resource demand estimation: • Current work is mainly focused on CPU resources. More work is required to address the specifics of other resource types, such as memory, network, or Input / Output (I/O) devices. The challenges with these resource types are, among others, that the utilization metric is often not as clearly defined as for CPUs, and the resource access may be asynchronous. • Comparisons between statistical estimation techniques and measurement approaches are missing. This would help to better understand their implications on accuracy and overhead. • Most approaches are focused on estimating the mean resource demand. However, in order to obtain reliable performance predictions it is also important to determine the correct distribution of the resource demands. • Modern system features (e.g., multi-core CPUs, dynamic frequency scaling, virtualization) can have a significant impact on the resource demand estimation. • Resource demand estimation techniques often require measurements for all requests during a certain time period in which a resource utilization is measured, whereas resource demand measurements can be applied for a selected set of transactions. 3.3.3
Workload Characterization and Workload Model Extraction
Workload characterization is a performance engineering activity that serves to a) study the way users (including other systems) interact with the System Under Analysis (SUA) via the systemprovided interfaces and to b) create a workload model that provides an abstract representation of the usage profile (Jain, 1991). Menasc´e and Almeida (2002) suggest to decompose the system’s global workload into workload components (e.g., distinguishing web-based interactions from client/server transactions), which are further divided into basic components. Basic components (e.g., representing businessto-business transaction types or services invoked by interactive user interactions via a web-based UI) are assigned workload intensity (e.g., arrival rates, number of user sessions over time, and think times) and service demand (e.g., average number of documents retrieved per service request) parameters. The remainder of this section focuses on the extraction of workload characteristics related to navigational profiles (Section 3.3.3.1) and workload intensity (Section 3.3.3.2). 3.3.3.1 Navigational Profiles For certain kinds of systems, the assumption of workload being an arrival of independent requests is inappropriate. A common type of enterprise applications are session-based systems. In these systems, users interact with the system in a sequence of inter-related requests, each being submitted after an elapsed think time. The notion of a navigational profile is used to refer to the session-internal behavior of users. The navigational 11
Section 3. Performance Management Activities
1.0
1.0
view items
purchase login
manage login
browse login 0.93
inventory
1.0
view items
0.48 0.67
1.0 0.07
home 1.0
logout
1.0
1.0
0.02
add to cart
cancel order 0.5
sell inventory
clear cart 0.66
0.11
shopping -cart
0.77
0.61 0.23
0.34
remove
home 1.0
0.10
0.18
0.21
purchase cart
logout
0.12
defer order
1.0
home 1.0
logout
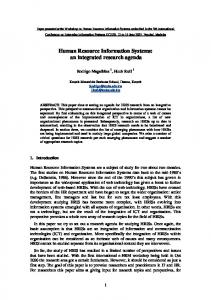
Figure 3.2: SPECjEnterprise2010 transaction types (browse, manage, and purchase) in a CBMG (Markov chain) representation (van Hoorn et al., 2014). For examples, in browse transactions, users start with a login, followed by a view item request in 100% of the cases; view items is followed by view items with a probability of 93% and by home in 7% of the cases. profile captures the possible ways or states of a workload unit (single user/customer) through the system. Note that we do not limit the scope of the targeted systems to web-based software systems but to multi-user enterprise application systems in general. The same holds for the notion of a request, which is not limited to web-based software systems. One goal of the session-based notion is to group types of users with a similar behavior. Metrics and Characteristics. For session-based systems, workloads characteristics can be divided into intra-session and inter-session characteristics. Intra-session characteristics include think times between requests and the session length, e.g., in terms of the time elapsed between the first and the last request within a session and the number of requests within a session. Inter-session characteristics include the number of sessions per user and the number of active sessions over time as a workload intensity metric. Moreover, request-based workload characteristics apply, e.g., the distribution of invoked request types observed from the server perspective. Specification and Execution of Session-Based Workloads. Two different approaches exist to specify session-based workloads, namely based on a) scripts and b) on performance models. Script-based specification is supported by essentially every load testing tool. The workflow of a single user (class) is defined in a programming-language style—sometimes even using programming languages such as Java or C++ (e.g., HP Loadrunner). These scripts, representing a single user, are then executed by a defined number of concurrent load generator threads. Even though the scripting languages provide basic support for probabilistic paths, the scripts are usually very deterministic. As opposed to this, performance models provide an abstract representation of a user session— usually including probabilistic concepts. An often-used formalism for representing naviga12
Section 3. Performance Management Activities tional profiles in session-based systems are Markov chains (Menasc´e et al., 1999; van Hoorn et al., 2008; Li and Tian, 2003), i.e., probabilistic finite state machines. For example, Menasc´e et al. (1999) introduce a formalism based on Markov chains, called Customer Behavior Model Graphs (CBMGs). In a CBMG, states represent possible interactions with the SUA. Transitions between states have associated transition probabilities and average think times. For example, Figure 3.2 depicts CBMGs for transactions types of a (modified) workload used by the industrystandard benchmark SPECjEnterprise2010 (van Hoorn et al., 2014). CBMGs can be used for workload generation (Menasc´e, 2002). As emphasized by Krishnamurthy et al. (2006) and Shams et al. (2006), limitations apply when using CBMGs for workload generation. For example, the simulation of the Markov chain may lead to violations of inter-request dependencies, i.e., to sequences of requests that do not respect the protocol of the SUA. Two items, for instance, may be removed from a shopping cart, even though only a single item has been added before. To support inter-request dependencies (and data dependencies), Shams et al. (2006) propose a workload modeling approach based on (non-deterministic) Extended Finite State Machines (EFSMs). An EFSM describes valid sequences of requests within a session. As opposed to CBMGs, transitions are not labeled with probabilities but with predicates and actions based on pre-defined state variables. The actual workload model is the combination of valid sessions obtained by simulating an EFSM along with additional workload characteristics like session inter-arrival times, think times, session lengths, and a workload mix modeling the relative frequency of request types. Van Hoorn et al. (2008; 2014) combine the aforementioned modeling approaches based on CBMGs and EFSMs. Other approaches based on analytical models employ variants of Markov chains (Barber, 2004b), Probabilistic Timed Automata (Abbors et al., 2013) and UML State Machines (Becker et al., 2009; Object Management Group, Inc., 2005, 2013). Extraction. Extractions of navigational profiles are usually based on request logs obtained from a SUA. For web-based systems, these logs (also referred to as access logs or session logs) usually include for each request the identifier of the requested service, a session identifier (if available), and timing information (time of request and duration). Data mining techniques, such as clustering, are used to extract the aforementioned formal models (Menasc´e et al., 1999; van Hoorn et al., 2014). We identify the following challenges and future directions for navigational profiles as part of workload characterization: • Most methods so far have focused on extracting and characterizing navigational profiles offline. Promising future work is to perform such extraction and characterization continuously, e.g., to use the gathered information for near-future predictions which do not only take the workload intensity into account. • Navigational profiles, or workload scripts in general, outdate very fast due to changes as part of the evolving SUA. This concerns the expected usage pattern for the application but also protocol-level details in the interaction (service identifiers, parameters, etc.). A future direction could be to utilize navigational profiles already during development. 3.3.3.2 Load Intensity Profiles A load intensity profile definition is a crucial element to complete a workload characterization. The observed or estimated arrival process of transactions (on the level of users, sessions or requests/jobs arrivals) needs to be specified. As basis to specify time-dependent arrival rates or inter-arrival times, the extraction of a usage model (see Section 3.3.3.1) should provide a classification of transaction types that are statistically indistinguishable in terms of their resource demanding characteristics. A load intensity profile 13
Section 4. Software Performance Engineering During Development is an instance of an arrival process. A workload that consists of several types of transactions is then characterized by a set of load intensity profile instances. Load intensity profiles are directly applicable in the context of any open workload scenario with a theoretically unlimited number of users, but are not limited to those (Schroeder et al., 2006). In a closed or partially closed workload scenario, with a limited number of active transactions, the arrival process can be specified within the given upper limits and zero. Any load intensity profile can be transformed into a time series containing arrival rates per sampling interval. A requirement for a load profile to appear as realistic (and not synthetic) for a given application domain is a mixture of a) one or more (overlaying) seasonal patterns, b) long term trends including trend breaks, c) characteristic bursts, and d) a certain degree of noise. These components can be combined additive or multiplicative over time as visualized in Figure 3.3.
Seasonal
Workload Units
+/×
+/×
+/×
+/×
Trends & Breaks +/×
Overlaying Seasonal +/×
+/×
Noise
Burst
Time
Figure 3.3: Elements of load intensity profiles (von Kistowski et al., 2014) At early development stages, load intensity profiles can be estimated by domain experts by defining synthetic profiles using statistical distributions or mathematical functions. At a higher abstraction level, the Descartes Load Intensity Model (DLIM) allows to descriptively define the seasonal, trends, burst, and noise elements in a wizard-like manner (von Kistowski et al., 2014). DLIM is supported by a tool-chain named Load Intensity Modeling Tool (LIMBO) (Descartes Research Group, 2015). A good starting point for a load intensity profile definition at the development stage is to analyze the load intensity of comparable systems within the same domain. If traces from comparable systems are available, a load profile model can be extracted in a semi-automated manner as described by von Kistowski et al. (2015). We identify the following open challenges in the field of load profile description and their automatic extraction: • Seasonal patterns may overlay (e.g., weekly and daily patterns) and change in their shape over time. The current extraction approaches do not fully support these scenarios.
4
Software Performance Engineering During Development
This section focuses on how a combination of model-based and measurement-based techniques can support performance evaluations during software development. First, we will focus on the 14
Section 4. Software Performance Engineering During Development challenges of how to conduct meaningful performance analyses in stages where no implementation exists (Section 4.1). During development, timely feedback and guidance on performance-relevant properties of implementation decisions is extremely valuable to developers, e.g., concerning the selection of algorithms or data structures. Support for this is provided under the umbrella of performance awareness, presented in Section 4.2. Next, in Section 4.3, we present approaches to detect performance problems automatically based on analyzing design models and runtime observations. Finally, Section 4.4 focuses on the automatic detection of performance regressions, including approaches that combine measurements and model-based performance prediction.
4.1
Design-Time Performance Models
In early software development phases like the design phase a lot of architectural, design and technology decisions must be made that can have a significant influence on the performance during operations (Koziolek, 2010). However, predicting the influence of design decisions on the performance is difficult in early stages. Many questions arise for software developers and architects during these phases. These questions include but are not limited to: • What influence does a specific design decision have on performance? • How scalable is the designed software architecture? • Given the performance of reused components/systems, can the performance goals be achieved? In the early software development phases, performance models can be used as “early warning” instrument to answer these questions (Woodside et al., 2007). The goal of using performance models is to support performance-relevant architecture design decisions. Using performance models in early development phases should also motivate software developers to engage in early performance discussions like answering what-if questions (Thereska et al., 2010). A what-if question describes a specific case for design or architectural decision like: ”What happens if we use client-side rendering?” as an alternative to ”What happens if we use server-side rendering?”. In order to create performance models, information about the system’s architecture (i.e., scenarios describing system behavior and deployment), workloads (see Section 3.3.3), and resource demands (see Section 3.3.2) is needed. However, in early phases of the software development it is challenging to create accurate performance models as the software system is not yet in production and it is difficult to collect and identify all required empirical information. Especially, it is difficult to get data about the workload and the resource demands of the application. In order to face these challenges, Barber (2004a) proposes activities to gather that kind of data: • First of all, available production data from existing versions of the software or from external services required for the new system should be analyzed. Using this data the workload, usage scenarios, and resource demands can be extracted. • If no production data is available, design and requirements documents can be analyzed regarding performance expectations for new features. Especially Service-level Agreements (SLAs) can be used as approximation for the performance of external services until measurements are available. • The resource demands can be estimated (CPU, I/O, etc.) based on the judgments from software developers. • After the identification of the available information about the design, workload and resource demands one or more drafts of the performance model should be created and first 15
Section 4. Software Performance Engineering During Development simulation results should be derived. The results can then be presented and discussed with developers and architects. Then the models should be continuously improved based on further experiments, feedbacks, results, and common sense. The challenges of using performance models in early development phases is that it is often difficult to validate the accuracy of the models until a running system exists. Performance predictions based on assumptions, interviews, and pretests can also be inaccurate and subsequently also the decisions based on these predictions. However, a model helps to capture all the collected data in a structured form (Brunnert et al., 2013a). Considering all these aspects, the following challenges exist for performance evaluations in early development phases that need to be addressed: • The trust of the architects and developers in these models can be very low. It is therefore important to make the modeling assumptions and data sources for these models transparent to their users. • Design models may be incomplete or inconsistent, especially in the early stages of software development. • Modern agile software development processes have the goal to start with the implementation as early as possible and thus may skip the design step. For such methodologies, the approaches outlined in the following section might be better applicable.
4.2
Performance Awareness
Due to time constraints during software development, non-functional aspects with respect to software quality—e.g., performance—are often neglected. Performance testing requires realistic environments, access to test data, and implies the application of specific tools. Continuously evaluating the performance of software artifacts also decreases the productivity of developers. For quality aspects such as code cleanness or bug pattern detection, a number of automatic tools supporting developers exist. Well-known examples are Checkstyle2 and FindBugs3 . Tools that focus on performance aspects are not yet widely spread, but would be very useful in providing awareness on the performance of software to developers. Performance awareness describes the availability of insights on the performance of software systems and the ability to act upon them (T˚ uma, 2014). T˚ uma divides the term performance awareness into four different dimensions: 1. The awareness of performance-relevant mechanisms, such as compiler optimizations, supports understanding the factors influencing performance. 2. The awareness of performance expectations aims at providing insights on how well software is expected to perform. 3. Performance awareness also intends to support developers with insights on the performance of software they are currently developing. 4. Performance-aware applications are intended to dynamically adapt to changing conditions. The most relevant perspectives for DevOps are the performance awareness of developers and the awareness of performance expectations. Gaining insights into the performance of the code they are currently developing is an increasingly difficult task for developers. Large application system architectures, a continuous iteration between system life cycle phases, and complex IT 2 3
http://checkstyle.sourceforge.net http://findbugs.sourceforge.net
16
Section 4. Software Performance Engineering During Development governance represent great challenges in this regard. Complex system of systems architectures often imply a geographical, cultural, organizational, and technical variety. The structure, relationships, and deployment of software components are often not transparent to developers. Due to continuous iterations between development and operations, the performance behavior of components is subject to constant change. The responsibility for components is also distributed across different organizational units, increasing the difficulty to access monitoring data. Additionally, developers require knowledge in performance engineering and in using corresponding tools. A number of approaches propose automated and integrated means to overcome these challenges and supporting developers with performance awareness. Selected existing approaches either provide performance measurements (Heger et al., 2013; Horky et al., 2015; Bureˇs et al., 2014) or performance predictions (Weiss et al., 2013; Danciu et al., 2014) to developers. A brief overview of these approaches is provided below. Measurement-based approaches collect performance data during unit tests or during runtime. Heger et al. (2013) propose an approach based on measurements collected during the execution of unit tests that integrates performance regression root cause analysis into the development environment. When regressions are detected, the approach supports the developer with information on the change and the methods causing the regression. The performance evolution of the affected method is presented graphically as a function and the methods causing the regression are displayed. Horky et al. (2015) suggest enhancements to the documentation of software libraries with information on their performance. The performance of libraries is measured using unit tests. Tests are executed on demand once the developer looks up a specific method for the first time. Tests can be executed locally or on remote machines. Measurements are then cached and refined iteratively. The approach proposed by Bureˇs et al. (2014) integrates performance evaluation and awareness methods into different phases of the development process of autonomic component ensembles. High-level performance goals are formulated during the requirement phase. As soon as software artifacts become deployable, the actual performance is measured. Developers receive feedback on the runtime performance within the Integrated Development Environment (IDE). Measurements are represented graphically as functions within a pop-up window. At runtime it may be unclear whether the observed behavior also reflects the expected one. Approaches for supporting the awareness of performance expectations provide a means to formulate, communicate, and evaluate these expectations. Bulej et al. (2012) propose the usage of the Stochastic Performance Logic (SPL) to express performance assumptions for specific methods in a hardware-independent manner. Assumptions on the performance of a method are formulated relative to another method and are not specified in time units. At runtime, assumptions are evaluated and potential violations can be reported to the developer. Bureˇs et al. employ SPL during design to capture performance goals and assign them to individual methods. These assumptions are then tested during runtime. Model-based prediction approaches aim at supporting developers with insights on the performance of software before it is deployed. The approach by Weiss et al. (2013) evaluates the performance of persistence services based on tailored benchmarks during the implementation phase. The approach enables developers to track the performance impact of changes or to compare different design alternatives. Results are displayed within the IDE as numerical values and graphically as bar charts. The approach is only applicable for Java Persistence API (JPA) services, but instructions on how to design and apply benchmark applications to other components are also provided by the authors. The approach proposed by Danciu et al. (2014) focuses on the Java EE development environment. The approach supports developers with insights on the expected response time of component operations they are currently implementing. Estimations are performed based on the component implementation and the behavior of required services. We identify the following open challenges and future research directions in the field of per17
Section 4. Software Performance Engineering During Development formance awareness: • Current approaches mainly focus on providing insights on performance but omit enabling developers to act upon them. Future research should investigate how guidance for correcting problems could be provided. • Insights compiled for the specific circumstances of developers should be collected and exchanged with Ops. Thus, new trends can be identified and corresponding measures can be taken. • The acceptance of performance awareness approaches by developers needs to be evaluated more extensive and improved. Increasing the acceptance will foster the diffusion of these approaches into industry. • The performance improvements which can be achieved by employing performance awareness approaches need to be evaluated using industry scenarios.
4.3
Performance Anti-Pattern Detection
Software design patterns (Gamma et al., 1994) provide established template-like solutions to common design problems to be used consciously during development. By contrast, software performance anti-patterns (Smith and Williams, 2000) constitute design, development, or deployment mistakes with a potential impact on the software’s performance. Hence, anti-patterns are primarily used as a feedback mechanism for different stakeholders of the software engineering process (e.g., software architects, developers, system operators, etc.). Hereby, approaches for the detection of performance anti-patterns constitute the basis for anti-pattern-based feedback. There are different approaches for performance anti-pattern detection utilizing different detection methodologies, requiring different types of artifacts and being applicable in different phases of the software engineering process. Some of these approaches can be integrated into IDEs and in this way support performance awareness (see Section 4.2) by providing direct feedback on occurring performance mistakes. 4.3.1
The Essence of Performance Anti-Patterns
There is a large body of scientific and industrial literature describing different performance antipatterns (Smith and Williams, 2000, 2002b,c, 2003; Dudney et al., 2003; Dugan et al., 2002; Boroday et al., 2005; Tene, 2015; Reitbauer, 2010; Grabner, 2010; Kopp, 2011; Still, 2013). All definitions of performance anti-patterns have in common that they describe circumstances that may lead to performance problems under certain load situations. However, the definitions of performance anti-patterns conceptually differ with respect to different dimensions. While some antipatterns describe mistakes on the architecture level (e.g., Blob anti-pattern (Smith and Williams, 2000)), others refer to problems on the implementation level (e.g., Spin Wait anti-pattern (Boroday et al., 2005)) or even deployment-related problems (e.g., Unbalanced Processing (Smith and Williams, 2002b)). Furthermore, definitions of anti-patterns differ in the level of abstraction. While some anti-patterns describe high-level symptoms of performance problems (e.g., The Ramp anti-pattern (Smith and Williams, 2002b)), other anti-patterns describe applicationinternal indicators or even root causes (e.g., Sisyphus Database Retrieval (Dugan et al., 2002)). Furthermore, anti-patterns may describe structural (e.g., Blob anti-pattern (Smith and Williams, 2000)) or behavioral patterns (Empty Semi Trucks anti-pattern (Smith and Williams, 2003)). Depending on the types of anti-patterns, different detection approaches are more or less suitable for their detection.
18
Section 4. Software Performance Engineering During Development 4.3.2
Detection Approaches
Approaches for the detection of performance anti-patterns can be divided into model-based approaches and measurement-based approaches. Their categories of approaches imply different circumstances under which they can be applied, yielding different limitations and benefits. In the following, we briefly discuss the two categories of detection approaches. Model-based Approaches Model-based approaches for the detection of performance antipatterns (Trubiani and Koziolek, 2011; Cortellessa and Frittella, 2007; Xu, 2012; Cortellessa et al., 2010) require architectural (e.g., PCM or MARTE) or analytic (e.g., LQN) performance models, as introduced in Section 3.2. Representing performance anti-patterns as rules (e.g., using predicate logic (Trubiani and Koziolek, 2011)) allows to capture structural as well as behavioral aspects of performance anti-patterns. While certain structural and behavioral aspects can be evaluated directly on the architectural model, associated performance-relevant runtime aspects can be derived by performance model analysis or simulation. Applying anti-pattern detection rules to the models allows to identify flaws in the architectural design that may impair software performance. Due to the abstraction level of architectural models, the detection scope of model-based approaches is inherently limited to architecture-level anti-patterns. In particular, performance anti-patterns that are manifested in the details of implementation cannot be detected by model-based approaches. Furthermore, due to the high dependency on the models, the detection accuracy of model-based anti-pattern detection approaches is tightly coupled to the quality (i.e., accuracy and representativeness) of the architectural models. Measurement-Based Approaches Depending on their stage of usage in the software lifecycle, measurement-based approaches can be further divided into test-based and operation-time anti-pattern detection approaches: Test-based anti-pattern detection approaches utilize performance tests (e.g., as part of integration testing (Jorgensen and Erickson, 1994)) to gather performance measurement data as basis for further reasoning on existing performance problems (Wert et al., 2013, 2014; Grechanik et al., 2012). Thereby, measurement-based approaches (see Section 3.1) are applied to retrieve performance data of interest. As monitoring tools introduce measurement overhead that may impair the accuracy of measurement data, systematic experimentation (Westermann, 2014; Wert et al., 2013) can be applied to deal with the trade-off between accurate measurement data and high-level of detail of the data. Similarly to the model-based approaches, test-based detection approaches apply analysis rules that evaluate the measurement data to identify potential performance anti-patterns. As test-based detection approaches rely on execution of the system under test, a testing environment is required that is representative to the actual production environment. In order to save costs, the testing environment is often considerably smaller than the production environment. As detection of performance anti-patterns is often relative to the performance requirements, in these cases, performance requirements need to be scaled down to the size of the testing environment in order to allow reasonable, test-based detection of performance anti-patterns. Furthermore, test-based detection approaches utilize load scripts for load generation during execution of performance tests. Hence, the detection accuracy highly depends on the quality (i.e., representativeness of real users) of the load scripts. The DevOps paradigm is the key enabler to derive representative load scripts for test-based anti-pattern detection from production workloads (Section 3.3.3). Test-based approaches analyze the implemented target system in its full level of detail. They potentially cover all types of anti-patterns: from architecturelevel via implementation-level through to structural as well as behavioral anti-patterns. Finally, test-based approaches that run fully automatic (Wert et al., 2013, 2014) can be assimilated into CI (Duvall et al., 2007) in order to provide frequent, regular feedback on potential existence of performance anti-patterns in the code of the target application. 19
Section 4. Software Performance Engineering During Development Operation-time anti-pattern detection approaches, e.g., by Parsons and Murphy (2004), are similar to test-based approaches with respect to the detection methodology. However, as they are applied on production system environments, they entail additional limitations as well as benefits. In a production environment, the measurement overhead induced by monitoring tools is a much more critical factor than with test-based approaches, as the monitoring overhead must not noticeably affect the performance of real user requests. Therefore, operation-time antipattern detection approaches apply rather coarse-grained monitoring, which affects the ability of providing detailed insights on specific root causes of performance problems. Furthermore, performance anti-patterns that are detected by operation-time approaches might already have resulted in a performance problem experienced by end users. Hence, operation-time detection of performance anti-patterns is rather reactive. However, as performance characteristics are investigated on the real system, under real load, operation-time approaches are potentially more accurate than model-based or test-based approaches. We see the following research challenges in the area of performance anti-pattern detection: • Anti-patterns are usually described in textual format. More work is needed to formalize these descriptions into machine-processable rules and algorithms. • Many approaches use fixed thresholds in their detection rules and algorithms, e.g., in order to judge whether a number of remote communications is indicative for a performance problem. This leads to context-specific and system-specific configurations. More research is needed to automatically determine suitable thresholds or to completely avoid them. • More research is also needed to better understand and formalize the relationship between symptoms, indicators, and root-causes connected to performance anti-patterns and performance problems in general.
4.4
Performance Change Detection
A key goal of a tighter integration between development and operations teams is to better cope with changes in the business environment. In order to react quickly in such situations, a high release frequency is necessary. This changes the typical software release process in a way that, instead of releasing new features or bug fixes in larger batches in a few major versions, they are released more frequently in many minor releases. The performance characteristics of EAs can change whenever new features or bug fixes are introduced in new versions. Due to this reason, it is necessary to continuously evaluate the performance of EA versions to detect performance changes before an EA version is moved to production. The previously introduced approaches during design and development cannot capture all performance-related changes. Activities during the design phase might not capture such changes because minor bug fixes or feature additions do not change the design and are thus not detectable. During the implementation phase, only changes are detectable that are caused by the code of an EA directly. Therefore, changes that are only detectable on different hardware environments (e.g., in different deployment topologies) or in specific workload scenarios must be analyzed before an EA version is released. In order to analyze such performance-related changes of EA deployments on different hardware environments or for multiple workload scenarios, measurement- and model-based performance evaluation techniques can be used. Measuring the performance of each EA version is often not feasible because maintaining appropriate test environments for all possible hardware environments and workloads is associated with a lot of cost and effort. Therefore, a mixture of model- and measurement-based performance evaluation approaches to realize performance change detection techniques are introduced in the following. 20
Section 4. Software Performance Engineering During Development Developer checks in
Deployment Pipeline in a Continuous Delivery Process
Commit Stage
Automated Capacity Testing
Automated Acceptance Test
Manual Testing
Release
Performance Change Detection Notifying Developer about Performance Change
Figure 4.1: Detecting performance change in a deployment pipeline (Brunnert and Krcmar, 2014) A measurement-based technique that can be used to detect performance changes on a low level of detail are performance unit tests (Hork´ y et al., 2015). The key idea of such performance unit tests is to ensure that regressions introduced by developer check-ins are quickly discovered. One possible implementation of performance unit testing is to use existing APM solutions during the functional unit tests. In order to make the developers aware of any performance regressions introduced by their changes in new EA versions, an integration of such tests in CI systems is often proposed (Waller et al., 2015). A measurement-based approach that requires test environments that are comparable to the final production systems is proposed by Bulej et al. (2005). The authors propose to use application-specific benchmarks to test the performance for each release. Using such benchmarks has the advantage of repeatability and also makes the results more robust compared to single performance tests. Another measurement-based approach to detect performance regressions during development is proposed by Nguyen et al. (2012). The authors propose to use so-called control charts in order to detect performance changes between two performance tests. Similar to this approach are the works by Cherkasova et al. (2008, 2009) and Mi et al. (2008). The authors propose the use of so-called application signatures. Application signatures describe the response time of specific transactions relative to the resource utilization. However, application signatures are intended to find performance changes for systems that are already in production. A model-based performance change detection process within a deployment pipeline, depicted in Figure 4.1, is proposed by Brunnert and Krcmar (2014). This approach uses monitoring data collected during automated acceptance tests in order to create models (called resource profiles). These resource profiles describe the resource demand for each transaction of an EA and are managed in a versioning repository in order to be able to access the resource profiles of previous builds. The resource profile of the current EA version is used to predict performance for predefined hardware environments and workloads. The prediction is performed with predictions derived from resource profiles of one or several previous versions. The prediction results are compared with each other used as an indicator for change. The resource profiles themselves and the check-ins that triggered a build are then analyzed in order to find the source of a change (e.g., by comparing two resource profiles). Compared to several works that introduce approaches to detect performance change, there is a relatively low amount of work on identifying the reasons for a performance change. One of the few examples is the work by Sambasivan et al. (2011). The authors propose an approach to analyze the reasons of a change based on request execution flow traces. Their approach is based on the response time behavior of single component operations involved in the request processing and their control flow. It might be interesting to combine this approach with the approach presented by Brunnert and Krcmar (2014) because the resource profiles and their prediction results provide all the necessary data for the root cause search approach presented 21
Section 5. Application Performance Management During Operations by Sambasivan et al. (2011). This would allow to detect and analyze performance change in a completely model-driven way. Even though there is a lot of work going on in the area of performance change detection, a lot of open challenges remain, such as: • Test coverage is always limited: performance changes in areas that are not covered by a test workload cannot be detected. • Model-based performance change detection techniques are always associated with the risk that aspects with impact on performance are not properly reflected in a model. • A lot of the existing model-based performance evaluation techniques focus on CPU demand, if memory, network, or HDD would cause a performance regression, it cannot be detected using such models. • Test coverage is not only limited for software itself but also in terms of the amount of workloads and hardware environments that can be tested in a reasonable time frame.
5
Application Performance Management During Operations
Once an EA is running in a production environment it is important to continuously ensure that it meets its performance goals. The activities required for this purpose are summarized by the term APM. APM activities are required regardless how well SPE activities during development outlined in the previous section have been executed. This is the case because either assumptions about the production environment or the workload can be wrong. Furthermore, performance data collected during operations provides a lot of insights for the development teams to get them from assumptions to knowledge. The key APM activities during development are outlined in this section as follows: Section 5.1 outlines one of the most fundamental activities, namely performance monitoring. Afterwards, Section 5.2 covers performance problem detection and diagnosis activities based on data collected using monitoring techniques. In order to reduce the need for manual interaction, the section concludes in Section 5.3 with existing approaches and challenges regarding the application of performance models to control the performance behavior of an EA autonomously.
5.1
Performance Monitoring
Kowall and Cappelli (2014) use the following five dimensions of APM functionality to assess the commercial market of APM tools in their yearly report: a) end-user experience monitoring (EUM), b) application topology discovery and visualization, c) user-defined transaction profiling, d) application component deep dive, and e) IT operations analytics (ITOA). The EUM dimension stresses the need to include the monitoring of client-side performance measures—particularly end-to-end response times—instead of looking at only those performance measures obtained inside the server boundaries. Major reasons for this requirement are that, nowadays, a) EAs move considerable parts of the request processing to the client, e.g., rendering of UIs in web browsers on various types of devices; and that b) networks are increasingly influencing the user-perceived performance because EAs are accessed via different types of connections (particularly mobile) and from locations all over the world. EUM is usually achieved by adding instrumentation to the scripts executed on the client side and sending back the performance measurements as part of subsequent interactions with the server. Application topology discovery and visualization comprises the ability to automatically detect and present information about the components and relationships of EA landscapes as well as to make this information analyzable. An EA landscape consists of different types of physical 22
Section 5. Application Performance Management During Operations or virtual servers hosting software components that interact with each other and with thirdparty services via different integration technologies, including synchronous remote calls and asynchronous message passing. Application topologies are usually discovered by monitoring agents deployed on the application servers, which send the obtained data to a central monitoring database. Topologies are usually represented and visualized as navigable graph-based representations depicting the system components and control flow. These graphs are enriched by aggregated performance data such as calling frequencies, latencies, response times, and success rates of transactions, as well as utilization of hardware resources. This information enables operators to get an overall picture of a system’s health state, particularly with respect to its performance, and to detect and diagnose performance problems. User-defined transaction profiling refers to the functionality of mapping implementationlevel details about executed transactions (e.g., involved classes and methods, as well as their performance properties) to their corresponding business transactions. This feature is useful in order to assess the impact of performance properties and problems to business indicators. For example, it can be evaluated which business functions, such as order processing, are affected in case certain software components are slow or even unavailable. Application component deep dive refers to the detailed tracing and presentation of call trees for transactions. The call trees include control flow information, including executed software methods, remote calls to third-party services, and exceptions that were thrown. The call tree structure is enriched by performance measurements, such as response times and execution times, as well as resource demands. Orthogonal to the previous dimensions, ITOA functionality aims to derive higher-order information from the data gathered by the first four dimensions, e.g., by employing statistical analysis techniques, including data mining. A typical example for ITOA is performance problem detection and diagnosis as presented in Section 5.2. The following list includes a summary of selected challenges regarding the current state of performance monitoring with a focus on the APM tooling infrastructure: • The most mature APM tools are closed-source software products provided by commercial vendors. These tools provide comprehensive support for monitoring heterogeneous EA landscapes, covering instrumentation support for various technologies and including novel features such as adaptive instrumentation and automatic tuning for reduced performance overhead. However, being closed source, the tools’ functionality often cannot be extended or reused for other purposes in external tools. Also, details about the functionality are generally not published. Moreover, researchers are usually not allowed to evaluate or compare their research results with the capabilities of the tools as this is not permitted according to the license agreements. • The data collection functionalities of APM tools—including data about EA topologies, transaction traces, and performance measures—are a valuable input for performance model extraction approaches, as presented Section 3.3. However, all too often, no defined interfaces exist to access this data from the tools. In order to increase the interoperability of APM platforms, open or even common interfaces are desirable. In this way, researchers can particularly contribute to the effectiveness of APM solutions by developing novel (modelbased) ITOA approaches that build on the data collected by the mature APM tools. • The configuration of APM tools, due to the system-specificity, is very complex, timeconsuming, and error prone—particularly given the aforementioned faster release and deployment cycles requiring a continuous refinement. For example, APM-specific questions such as what and where to monitor are decisions mainly taken by operations teams. However, performance models used during design time could be further exploited and extended 23
Section 5. Application Performance Management During Operations to specify operations-related monitoring aspects earlier and more systematically in the system lifecycle. An automatic configuration of APM tools is desirable, e.g., based on higher level and tool-agnostic descriptions of monitoring goals attached to architectural performance models.
5.2
Problem Detection and Diagnosis
Performance problem detection aims to reveal symptoms for present or upcoming system states with degraded or suspicious performance properties, unusually high or low response times, utilization of resources, or number of errors. The diagnosis step aims to reveal the root cause of the performance problems observed by the previously detected symptom(s). These steps are comparable to the activities during anti-pattern detection outlined in Section 4.3. However, their main difference is that problems revealed by anti-pattern detection approaches are limited to scenarios that are known to cause problems, whereas general problem detection tries to reveal problematic situations without prior knowledge. Approaches for problem detection and diagnosis can be classified based on various dimensions. In this section, we focus on when the analysis is conducted (before or after the problem occurs), who is performing it (a human or a machine), and how it is performed (based on information about the system state or individual transactions). Note that we are not aiming for a complete taxonomy and/or classification of approaches but we give examples for how performance problem detection and diagnosis can be conducted and what example approaches are. When? Reactive approaches aim to detect and diagnose problems after they occurred, using statistical techniques like detection of threshold violations or deviations from previously observed baselines. Proactive approaches aim to detect and/or diagnose problems before they occur (Salfner et al., 2010), using forecasts/predictions based on historic data for performance measures of the same system. Forecasting and prediction techniques include mature statistical techniques like time series forecasting, machine learning, as well as a combination of these techniques with model-based performance prediction incorporating architectural knowledge about the architecture (e.g., as in the approach by Rathfelder et al. (2012)). Who? Problem detection is usually achieved by setting and controlling baselines on performance measures of interest, both of which may be conducted manually or automatically. Another approach is anomaly detection (Chandola et al., 2009; Marwede et al., 2009; Ehlers et al., 2011), which aims to detect patterns in the runtime behavior that deviate from previously observed behavior. If no automatic problem detection is in place, problems will be often reported by end users or by system operators that inspect the current health state of the system. Manual diagnosis of problems is usually performed by inspecting monitored data or by reproducing and analyzing the problem in a controlled development environment, using tools like debuggers and profilers. In any case, expert knowledge about typical relationships between symptom and root cause can be used to guide the diagnosis strategy (e.g., based on the performance anti-patterns presented in Section 4.3). How? State-based problem detection and diagnosis approaches reason about aggregate behavior of system or component measures obtained from a certain observation period, e.g., response time percentiles or distributions, and total invocation counts. Note that data from individual transactions (e.g., individual response times and control flow) may be used for the aggregation and model generation, but are dropped after the aggregation step (e.g., as in the approach of Agarwal et al. (2004)). Transaction-based approaches (e.g., the approach of Kiciman and Fox (2005)) are usually triggered by symptoms of performance problems observed for (a 24
Section 5. Application Performance Management During Operations class of) transactions, e.g., high response times for a certain business transaction or error return codes. For diagnosis, the transaction’s call tree is inspected similar to the process of profiling, e.g., looking for methods with (exceptionally) high response times, high frequencies of method invocations, or exceptions thrown. The following list includes a summary of selected limitations of current approaches and research challenges: • Performance requirements, e.g., SLAs for response times, are often barely defined in practice. This makes the intuitive approach of comparing (current or predicted) performance measures with thresholds or baselines infeasible. Approaches are needed to automatically derive meaningful baselines from historic measurements. Note that a feasible trade-off of classical classification quality attributes such as false/true positives/negatives needs to be achieved to let administrators trust the performance problem detection and diagnosis solution. • Faster development and deployment cycles, in addition to potentially multiple components deployed in different versions at the same time, impose challenges to configurations of problem detection and diagnosis approaches. • Basic problem detection support, often based on automatically determined baselines, is provided by some commercial APM tools. However, for researchers, it is often hard to judge the underlying concepts, because the tools are closed source (exceptions exist) and the concepts are protected by patents or not published at all. In order to improve the comparability and interoperability of tools, open APM platforms are desirable. • Basic automatic problem detection is accepted by administrators, given that the false/true positive/negative rates are in an acceptable range. As fully automatic problem resolution is usually not accepted, future work in the performance community could be to focus more on recommender systems for problem diagnosis and resolution, which can be based on expert knowledge.
5.3
Models at Runtime
Self-adaptive or autonomic software systems use models at runtime (Salehie and Tahvildari, 2009), which continuously perform activities in a control loop, as follows: a) updating the model with monitoring data by integrating with appropriate monitoring facilities; b) learning, tuning, and adjusting model parameters by adopting appropriate self-learning techniques; c) employing the model to reason about adaptation, scaling, reconfiguration, repair, and other change decisions. Several frameworks have been developed to implement runtime engines for these activities. Recent examples include EUREMA (Vogel and Giese, 2014), iObserve (Heinrich et al., 2014), MORISIA (Vogel et al., 2011), SLAstic (van Hoorn, 2014), and Zanshin (Tallabaci and Silva Souza, 2013). Both development and operations can benefit from models at runtime in the context of DevOps, as illustrated in Figure 5.1. Initially, performance-augmented models and implementation artifacts are deployed to operations. The parameterized models at runtime are continuously updated and become more accurate by receiving runtime monitoring data. As mentioned above, the performance models may serve as a basis to dynamically control a system’s performance during operation. For instance, the updated models can be used for runtime capacity management (Section 6.1) helping the operations team to decide about the resources for the system or providing feedback for the auto-scaling mechanism. Models at runtime can have several purposes for operations teams. They can be exploited as the source for monitoring aspects of a running 25
Section 5. Application Performance Management During Operations Model Extraction
Ops
Model-based Performance Evaluation
IDE
Monitoring Performance Model
Control
System
Dev (Re-)Deployment
Figure 5.1: Models at runtime in DevOps system, to affect the system via model manipulation, and as a basis for analytical methods, such as model-based verification and model-based simulation. A promising role of models at runtime for development in the context of DevOps is to bring back the adapted model along with the associated runtime performance information to the development environment. The gathered information can be used to analyze and improve software system performance based on refined design-time artifacts such as software architectural descriptions, employing the modelbased evaluation techniques summarized in this report. Using the updated models, developers can then update the system design and the underlying code or it can be automatically updated by appropriate techniques that causally connect the models and the system (Chauvel et al., 2013) in order to improve system performance. Note that all major components in Figure 5.1 reside in both Dev and Ops since the system itself has both design-time and runtime aspects and this is the same for models and the development and operational team. Selected challenges regarding models at runtime in the context of DevOps include: • Monitoring sensors are not precise and contain noise. As a result, the parameters of the models that are required to be estimated by such monitoring data also get influenced by such measurement inaccuracies. One of the relevant challenges in such context is to develop reliable and robust estimation techniques that can update model parameters accurately given such inaccuracies in measurements. • Monitoring data is collected on an implementation level which might deviate from the model level in various degrees. For example, a monitoring record may contain the signature of the invoked operation, class, and object which must then be mapped to the corresponding component instance or type on model level. Such mapping becomes even more complicated when non-structural properties are observed. In many approaches this mapping is performed by a function that evaluates the signatures and maps them based on an algorithm to a model constructed at runtime. However, in context of pre-existing design-time models, such automatically derived runtime models may not correspond to their design-time counterparts. Therefore, design-time models in conjunction with a mapping between code and model must be available at runtime to provide a correspondence of the monitoring data to model elements. • To be able to feedback knowledge gathered during monitoring, either the runtime model must use a common meta-model with the design-time models or provide an accurate mapping between both models. In case of a common subset it is important to understand the information flow from runtime to design-time and vice versa. For example, a changed deployment at runtime must be reflected in the model.
26
Section 6. Evolution: Going Back-and-Forth between Development and Operations • Runtime models, like user behavior models, are constructed out of monitoring data which are then used to predict future user and system behavior. However, certain events, such as a sales event for a web-shop application, cannot be predicted correctly out of observed data. Therefore, it must be possible to feed in new user behaviors at runtime without affecting the predicted behavior based on observed behavior.
6
Evolution: Going Back-and-Forth between Development and Operations
After a system has been initially designed, implemented, and deployed, the evolution phase of software development starts. As phrased by Lehman’s first law of software evolution, a system “must be continually adapted or it becomes progressively less satisfactory in use” (Lehman and Ramil, 2001), and thus evolution and change are inevitable for a successful software system. In the evolution phase, development and operations can be intertwined as shown in Figure 1.1. While the system is operated continuously, development activities after initial deployment are triggered by specific change events. With respect to performance, two types of triggers are most relevant: • Changing requirements: Changed functional requirements need to be incorporated in the software architecture, software design, and implementation. Such new or changed functional requirements can newly arise in the form of new feature requests. Alternatively, these new requirements can already be on the release plan for some time before they get tackled in a next development iteration. In addition to functional requirements, new or changed quality requirements can also trigger development. Examples include requirements for better response times as the users expectations have become higher over time (as also discussed by Lehman and Ramil (2001)). • Changing environment: In addition to changing requirements, also changes of the environment may create a need to update a system’s design. For performance, the most important type of environmental change is a changing workload, both in terms of changing number of users and in terms of changing usage profile per user. A second common type of change concerns the execution environment, such as migration from on-premise to cloud. Such environmental changes, if not properly addressed, can lead to either violating performance requirements (in case of increasing workload) or inefficient operation of the system (in case of decreasing workload). In addition to workload and execution environment, changes in the quality properties of services that the SUA depends on can likewise cause the performance of the SUA to change. As a basis for performance-relevant decision making in the evolution phase, runtime information from the system’s production environment can be exploited using model-based performance evaluation techniques. As detailed in previous sections, this includes information about the system structure and behavior, as well as workload characteristics. This section focuses on two specific performance engineering activities within the evolution phase, namely capacity planning and management (Section 6.1), as well as software architecture optimization for performance (Section 6.2).
6.1
Capacity Planning and Management
Whenever an EA is being moved from development to operations, it is necessary to estimate the required capacity (i.e., the amount and type of software and hardware resources) for given workload scenarios and performance requirements. This is extremely important for completely 27
Section 6. Evolution: Going Back-and-Forth between Development and Operations new deployments, but it is also required whenever major changes in the feature set or workload of an application are expected. In case a new deployment needs to be planned, this activity is usually referred to as capacity planning. As soon as a deployment exists and its capacity needs to be adapted for changing workloads or performance requirements, this activity is referred to as capacity management. In order to plan capacity, it is important to not only consider performance goals but other perspectives such as costs. The latter includes investments in hardware infrastructure and software licenses, as well as operations expenditures, e.g., for system maintenance and energy. According to Menasc´e and Almeida (2002), capacity is considered adequately, if the performance goals are met within given cost constraints (initial and long term cost), and if the proposed deployment topology fits within the technology standards of a corporation. Therefore, estimating the required capacity for a deployment requires the creation of a workload model, a performance model, and a cost model. Nowadays, a key challenge that leads to the importance of capacity management for existing deployments is that it is often practically not feasible to evaluate the performance of all deployments of an EA during development as shown in Section 4. Therefore, operations teams cannot expect that all their specific scenarios have been evaluated. A challenge for new deployments is, that not all deployments are known at the time of a release. Furthermore, there is often a lack of information (e.g., about the resource demands of an application for specific transactions) whenever a new deployment needs to be planned. The traditional way of approaching capacity planning and management activities is to setup a test environment, execute performance tests, and use the test results as input for capacity estimations (King, 2004). As the test environments for such tests need to be comparable to the final production deployments, this approach is associated with a lot of cost and manual labor. Therefore, model-based performance evaluation techniques are proposed in research results in order to reduce these upfront investment costs (Menasc´e and Almeida, 2002). One example for a model-based capacity planning tool is proposed by Liu et al. (2004). This tool can be used to support capacity planning for business process integration middleware. A similar tool for component- and web service-based applications is proposed by Zhu et al. (2007). However, their tool is intended to be used to derive capacity estimations from designs and these estimations cannot be used for final capacity planning purposes. Brunnert et al. (2014b) use resource profiles that serve as an information sharing entity between the different parties involved in the capacity planning process. Resource profiles can be complemented with workload and hardware environment models to derive performance predictions. As all of the aforementioned approaches require a manual interaction to configure a model in a way that performance, cost, and technological constrains are met, an automated optimization is proposed by Li et al. (2010). The authors propose an automated sizing methodology for Enterprise Resource Planning systems that takes hardware and energy costs into account. This methodology tries to automatically find a deployment topology which provides adequate capacity for the lowest total cost of ownership. In addition to the previously mentioned capacity planning and management activities usually performed offline with a longer time horizon, a lot of work is currently done in the area of selfadaptation and runtime resource management (Kounev et al., 2011; van Hoorn, 2014). However, it needs to be emphasized that EA architectures need to be specifically designed to handle dynamically (de-)allocated resources during runtime. Therefore, additional research is going on in the area of dynamically scalable (often called elastic) software architectures (Brataas et al., 2013). Selected challenges in the area of capacity planning and management include the following: • Descriptions of the resource demand for EAs are still too limited in their capabilities (e.g., the amount of resource types they cover). 28
Section 6. Evolution: Going Back-and-Forth between Development and Operations • New system architectures such as big data systems require a refocus on storage performance and algorithmic complexity. • Energy consumption should be considered as part of a capacity planning activity, as it is a major cost driver in data centers nowadays (Poess and Nambiar, 2008). • The use of existing capacity planning and management approaches needs to be simplified to avoid the need to have highly-skilled performance engineers on board at the time of planning a deployment as this is often necessary in a sales process without a project team (Grinshpan, 2012).
6.2
Software Architecture Optimization for Performance
Whenever a change triggered a (re)design phase, there is also an opportunity to question the current architecture model and find potential for improvement. Architecture-based performance prediction is not limited to design decisions that are directly affected by incoming changes. Additionally, other design decisions taken can be reconsidered in the light of the changed requirements and/or changed environment. As a key aspect of the overall DevOps culture is automation, the remainder of this section will discuss existing tools that can help to automatically achieve such improvements. A number of approaches that automatically derive performance-optimized software architectures have been surveyed by Aleti et al. (2013). Up to 2011, the authors found 51 approaches that aim to optimize some performance property. These approaches usually focus on specific types of changes. For example, 37 of the approaches studied allocation of components, 6 approaches address component selection, and 20 approaches address service selection. Overall, the explored changes were allocation, hardware replication, hardware selection, software replication, scheduling, component selection, service selection, software selection, service composition, software parameters, clustering, hardware parameters, architectural pattern, partitioning, or maintenance schedules. Some approaches also considered problem-specific additional changes and 5 approaches were general, i.e., they supported the modeling of any type of change. In addition to optimizing performance, most of the approaches also take potentially conflicting additional objectives into account. Most commonly, costs of the solution are considered as well (38 approaches), followed by reliability (25), availability (18), and energy (6). Performance models extracted from production systems as outlined in Section 5.3 can be used as a basis to optimize performance. For formulating an optimization problem on an architectural performance model, it is required to specify an objective function and a list of possible changes to be explored by the optimization algorithm. Objective Function The associated solvers of the performance model already provide possible evaluation functions. Such an evaluation function takes an architectural performance model as an input and determines performance metrics, e.g., the mean response time, as an output. Selecting a performance metric of interest, such as mean response time, we can easily define an objective function for an optimization problem. Let M denote the set of all valid architectural performance models for a given architecture metamodel (e.g., all valid instances of the Palladio Component Model). Let fp : M → R denote the evaluation function that determines the selected performance metric p for a given model m ∈ M . Then, fp can serve as an objective function to optimize architecture models. In case of mean response time mrt, we aim to minimize fmrt . Possible Changes In addition to defining what the objective function is, the other major component of the optimization is defining what can be changed. When optimizing architectural models for performance, we usually want to keep the functionality of the system unchanged. 29
Section 6. Evolution: Going Back-and-Forth between Development and Operations Thus, we do not want to arbitrarily change the model, but only explore functionally-equivalent models with varying performance properties. For example, in component-based architectures, the deployment of components to servers can change without changing the functionality of the system. Likewise, assigning a cache component or replacing middleware components should not change functionality. There are different approaches on how to encode possible changes. One is to enumerate the set of open design decisions (Koziolek, 2013). For example, a decision could be on which server to allocate a component. Another example for an open decision could be whether to add a cache and where. Each open decision has a set of possible alternative options. For example, the possible options for the first design decision could be that a component can be allocated to a set of servers. As another example, the possible options for the second open design decision could be that the cache can be placed in front of a set of components or nowhere. Then, a single architectural candidate can be characterized by which option has been chosen for each open decision. One can picture this as a multidimensional decision space where each open decision is a dimension and each possible architectural candidate is a point in this space. In addition, it may be required to specify additional constraints on the decision space, such as that component A and component B may not be allocated to the same machine, e.g., due to security concerns. Thus, some of the architectural candidates in the decision space may be invalid. Optimization Problem Then, combined, we can define an optimization problem. A singleobjective optimization could be to minimize the objective function fp for the chosen performance metric of interest p over the valid architectural candidates in the decision space. If multiple objective functions are of interest, one can also formulate a multi-objective problem with several objective functions fp1 , ..., fpn and search for the so-called Pareto-optimal solutions (Deb, 2005). A solution is Pareto-optimal, if one cannot find another solution that is better or at least equal with respect to all objective functions. Even though a lot of approaches exist to automatically improve a software architecture for performance and it is known how to specify a general optimization problem based on performance models, a few major challenges remain: • All the approaches that use performance models as input for a software architecture optimization rely on the accuracy of the information represented in the model. Whenever a certain aspect of a software system is not represented, it cannot be optimized. It thus may be necessary to derive different model granularities for runtime optimization of systems and general architecture optimization. • Even though automatic performance model generation approaches exist, the specification of the possible changes to these models remains a manual step. It remains to be seen how the specification of these possibilities can be designed to make it simple for the users and thus increase the adoption rate. • Most software architecture optimization approaches surveyed by Aleti et al. (2013) are limited in that they either focus on specific possible changes only, that they only support simple performance prediction (e.g., very simple queuing models), or that they consider no or few conflicting objectives. Thus, a general optimization framework for software architectures could be devised, which could make use of a) plug-ins that interpret different architecture models (from architecture description languages to component models) and provide degree of freedom definitions and b) plug-ins to evaluate quality attributes for a given architecture model.
30
Section 7. Conclusion
7
Conclusion
This report outlined activities assisting the performance-oriented DevOps integration with the help of measurement- and model-based performance evaluation techniques. The report explained performance management activities in the whole life cycle of a software system and presented corresponding tools and studies. Following a general section about existing measurement- and model-based performance evaluation techniques, the report focused on specific activities in the development and operation phase. Afterwards, it outlined activities during the evaluation phase when a system is going back-and-forth between development and operation. A key success factor for all the integrated activities outlined in this report is the interoperability between the different tools and techniques. For example, an architect might create a deployment architecture of a software system, conduct several studies, then move the model to a tool better suited to performance analysis. For models, approaches such as the Performance Model Interchange Format (PMIF) (Smith et al., 2010) exist to help in this process. When someone from operations might want to communicate metrics to someone from development, it is necessary to be able to exchange the metrics in a common format. For this use case, formats such as the Common Information Model (CIM) Metrics Model (Distributed Management Task Force (DMTF), Inc., 2003), the Structure Metrics Meta-Model (SMM) (Object Management Group, Inc., 2012) or the performance monitoring specification of the Open Services for Lifecycle Collaboration (2014) exist. However, even though approaches exist, they need to be supported by multiple vendors in order for them to work. It is still to be seen which of these approaches and specifications might establish themselves as an industry standard. As of today the outlined approaches exist in theory and practice, but most model-based approaches are developed in academia and not in industry context. Furthermore, most development and operations activities are not tightly integrated as of today. Integrating the proposed approaches and increasing the degree of automation are key challenges for applying performance models in industry context and supporting Dev and Ops in terms of performance improvements. Several approaches focus on specific systems and need to be generalized for broader usage scenarios. Further validation on large industry projects would increase the level of trust and readiness to assume the costs and risks of applying performance models. Both, industry and academia have to address these challenges to enable a fully performance-oriented DevOps integration.
31
Section 8. Acronyms
8
Acronyms
APM
Application Performance Management
API
Application Program Interface
CBMG
Customer Behavior Model Graph
CD
Continuous Delivery
CDE
Continuous Deployment
CI
Continuous Integration
CIM
Common Information Model
CPU
Core Processing Unit
CSM
Core Scenario Model
Dev
development
DLIM
Descartes Load Intensity Model
DML
Descartes Modeling Language
EA
enterprise application
EFSM
Extended Finite State Machine
EJB
Enterprise Java Bean
EUM
end-user experience monitoring
HDD
hard disk drive
Java EE
Java Enterprise Edition
JPA
Java Persistence API
IDE
Integrated Development Environment
I/O
Input / Output
IT
Information Technology
ITOA
IT operations analytics
LibReDE
Library for Resource Demand Estimation
LIMBO
Load Intensity Modeling Tool
LQN
Layered Queueing Network
MARTE
UML Profile for Modeling and Analysis of Real-Time and Embedded Systems
PCM
Palladio Component Model
PMIF
Performance Model Interchange Format
QN
Queueing Network 32
Section 8. Acronyms QPN
Queueing Petri Net
OSLC
Open Services for Lifecycle Collaboration
Ops
operations
SDL
Specification and Description Language
SLA
Service-level Agreement
SMM
Structure Metrics Meta-Model
SPE
Software Performance Engineering
SPL
Stochastic Performance Logic
SUA
System Under Analysis
UI
user interface
UML
Unified Modeling Language
UML-SPT UML Profile for Schedulability, Performance and Time
33
References [Abbors et al. 2013] F. Abbors, T. Ahmad, D. Truscan, and I. Porres. Model-based performance testing in the cloud using the mbpet tool. In Proceedings of the 4th ACM/SPEC International Conference on Performance Engineering (ICPE ’13), pages 423–424. ACM, 2013. [Agarwal et al. 2004] M. K. Agarwal, K. Appleby, M. Gupta, G. Kar, A. Neogi, and A. Sailer. Problem determination using dependency graphs and run-time behavior models. In 15th IFIP/IEEE International Workshop on Distributed Systems: Operations and Management (DSOM 2004), volume 3278 of LNCS, pages 171–182, 2004. [Aleti et al. 2013] A. Aleti, B. Buhnova, L. Grunske, A. Koziolek, and I. Meedeniya. Software architecture optimization methods: A systematic literature review. IEEE Transactions of Software Engineering, 39(5):658–683, 2013. [AppDynamics 2015] AppDynamics. AppDynamics. https://www.appdynamics.com, 2015. [Ardagna et al. 2014] D. Ardagna, G. Casale, M. Ciavotta, J. F. P´erez, and W. Wang. Qualityof-service in cloud computing: modeling techniques and their applications. Journal of Internet Services and Applications, 5(1):11, 2014. [Balsamo et al. 2004] S. Balsamo, A. D. Marco, P. Inverardi, and M. Simeoni. Model-based performance prediction in software development: A survey. IEEE Transactions of Software Engineering, 30(5):295–310, 2004. [Barber 2004a] S. Barber. Creating effective load models for performance testing with incomplete empirical data. In Proceedings of the 6th IEEE International Workshop on Web Site Evolution (WSE ’04), pages 51–59. IEEE Computer Society, 2004a. [Barber 2004b] S. Barber. User Community Modeling Language (UCML) v1.1 for performance test workloads. http://www.perftestplus.com/ARTICLEs/ucml.pdf, 2004b. [Bard and Shatzoff 1978] Y. Bard and M. Shatzoff. Statistical methods in computer performance analysis. Current Trends in Programming Methodology, III, 1978. [Barham et al. 2004] P. Barham, A. Donnelly, R. Isaacs, and R. Mortier. Using Magpie for request extraction and workload modelling. In Proceedings of the 6th Symposium on Operating Systems Design & Implementation (OSDI’04), pages 18–18. USENIX Association, 2004. [Becker et al. 2009] S. Becker, H. Koziolek, and R. Reussner. The Palladio Component Model for model-driven performance prediction. Journal of Systems and Software, 82(1):3–22, 2009. [Becker et al. 2010] S. Becker, M. Hauck, M. Trifu, K. Krogmann, and J. Kofron. Reverse engineering component models for quality predictions. In Proceedings of the 14th European Conference on Software Maintenance and Reengineering (CSMR ’10), pages 199–202. IEEE, 2010. 34
Section References [Boroday et al. 2005] S. Boroday, A. Petrenko, J. Singh, and H. Hallal. Dynamic analysis of Java applications for multithreaded antipatterns. SIGSOFT Software Engineering Notes, 30 (4):1–7, 2005. [Brataas et al. 2013] G. Brataas, E. Stav, S. Lehrig, S. Becker, G. Kopˇcak, and D. Huljenic. CloudScale: Scalability management for cloud systems. In Proceedings of the 4th ACM/SPEC International Conference on Performance Engineering (ICPE ’13), pages 335–338. ACM, 2013. [Briand et al. 2006] L. C. Briand, Y. Labiche, and J. Leduc. Toward the reverse engineering of UML sequence diagrams for distributed Java software. IEEE Transactions of Software Engineering, 32(9):642–663, 2006. [Brosig 2014] F. Brosig. Architecture-Level Software Performance Models for Online Performance Prediction. PhD thesis, Karlsruhe Institute of Technology (KIT), Karlsruhe, Germany, 2014. [Brosig et al. 2009] F. Brosig, S. Kounev, and K. Krogmann. Automated extraction of Palladio component models from running enterprise Java applications. In Proceedings of the 1st International Workshop on Run-time mOdels for Self-managing Systems and Applications (ROSSA 2009). ACM, 2009. [Brosig et al. 2011] F. Brosig, N. Huber, and S. Kounev. Automated extraction of architecturelevel performance models of distributed component-based systems. In Proceedings of the 26th IEEE/ACM International Conference On Automated Software Engineering (ASE 2011), 2011. [Brunnert and Krcmar 2014] A. Brunnert and H. Krcmar. Detecting performance change in enterprise application versions using resource profiles. In Proceedings of the 8th International Conference on Performance Evaluation Methodologies and Tools (ValueTools ’14), 2014. [Brunnert et al. 2013a] A. Brunnert, A. Danciu, C. V¨ogele, D. Tertilt, and H. Krcmar. Integrating the Palladio-bench into the software development process of a SOA project. In Symposium on Software Performance: Joint Kieker/Palladio Days 2013, pages 30–38, 2013a. [Brunnert et al. 2013b] A. Brunnert, C. V¨ogele, and H. Krcmar. Automatic performance model generation for Java Enterprise Edition (EE) applications. In Proceedings of the 10th European Performance Engineering Workshop (EPEW ’13), volume 8168 of LNCS, pages 74–88. Springer-Verlag, 2013b. [Brunnert et al. 2014a] A. Brunnert, C. V¨ogele, A. Danciu, M. Pfaff, M. Mayer, and H. Krcmar. Performance management work. Business & Information Systems Engineering, 6(3):177–179, 2014a. [Brunnert et al. 2014b] A. Brunnert, K. Wischer, and H. Krcmar. Using architecture-level performance models as resource profiles for enterprise applications. In Proceedings of the 10th International ACM SigSoft Conference on Quality of Software Architectures (QoSA ’14), pages 53–62. ACM, 2014b. [Bulej et al. 2005] L. Bulej, T. Kalibera, and P. T˚ uma. Repeated results analysis for middleware regression benchmarking. Performance Evaluation, 60(1-4):345–358, 2005. [Bulej et al. 2012] L. Bulej, T. Bureˇs, J. Keznikl, A. Koubkov´a, A. Podzimek, and P. T˚ uma. Capturing performance assumptions using stochastic performance logic. In Proceedings of the 3rd ACM/SPEC International Conference on Performance Engineering (ICPE ’12), pages 311–322. ACM, 2012. 35
Section References [Bureˇs et al. 2014] T. Bureˇs, V. Hork´ y, M. Kit, L. Marek, and P. T˚ uma. Towards performanceaware engineering of autonomic component ensembles. In Leveraging Applications of Formal Methods, Verification and Validation, LNCS, pages 131–146. Springer-Verlag, 2014. [Casale et al. 2008] G. Casale, P. Cremonesi, and R. Turrin. Robust workload estimation in queueing network performance models. In Proceedings of the 16th Euromicro Conference on Parallel, Distributed and Network-Based Processing (PDP 2008), pages 183–187, 2008. [Chandola et al. 2009] V. Chandola, A. Banerjee, and V. Kumar. Anomaly detection: A survey. ACM Comput. Surv., 41(3):1–58, 2009. [Chardigny et al. 2008] S. Chardigny, A. Seriai, D. Tamzalit, and M. Oussalah. Extraction of component-based architecture from object-oriented systems. In Proceedings of the 7th Working IEEE/IFIP Conference on Software Architecture (WICSA 2008), pages 285–288, 2008. [Chauvel et al. 2013] F. Chauvel, N. Ferry, and B. Morin. Models@ runtime to support the iterative and continuous design of autonomic reasoners. Proceedings of the 8th International Workshop on
[email protected] (
[email protected] 2013), 2013. [Cherkasova et al. 2008] L. Cherkasova, K. M. Ozonat, N. Mi, J. Symons, and E. Smirni. Anomaly? Application change? Or workload change? Towards automated detection of application performance anomaly and change. In Proceedings of the 38th IEEE International Conference on Systems and Networks (DSN ’08), pages 452–461, 2008. [Cherkasova et al. 2009] L. Cherkasova, K. Ozonat, N. Mi, J. Symons, and E. Smirni. Automated anomaly detection and performance modeling of enterprise applications. ACM Transactions on Computer Systems, 27(3):6:1–6:32, 2009. [Cortellessa and Frittella 2007] V. Cortellessa and L. Frittella. A framework for automated generation of architectural feedback from software performance analysis. In Formal Methods and Stochastic Models for Performance Evaluation, volume 4748 of LNCS, pages 171–185. Springer-Verlag, 2007. [Cortellessa and Mirandola 2000] V. Cortellessa and R. Mirandola. Deriving a queueing network based performance model from UML diagrams. In Proceedings of the 2nd International Workshop on Software and Performance (WOSP ’00), pages 58–70. ACM, 2000. [Cortellessa et al. 2010] V. Cortellessa, A. Martens, R. Reussner, and C. Trubiani. A process to effectively identify “guilty” performance antipatterns. In Fundamental Approaches to Software Engineering, volume 6013 of LNCS, pages 368–382. Springer-Verlag, 2010. [Courtois and Woodside 2000] M. Courtois and M. Woodside. Using regression splines for software performance analysis. In Proceedings of the 2nd International Workshop on Software and Performance (WOSP ’00), pages 105–114. ACM, 2000. [Cremonesi and Casale 2007] P. Cremonesi and G. Casale. How to select significant workloads in performance models. In Proceedings of the CMG Conference (CMG 2007), 2007. [Cremonesi et al. 2010] P. Cremonesi, K. Dhyani, and A. Sansottera. Service time estimation with a refinement enhanced hybrid clustering algorithm. In Analytical and Stochastic Modeling Techniques and Applications, volume 6148 of LNCS, pages 291–305. Springer-Verlag, 2010. [Danciu et al. 2014] A. Danciu, A. Brunnert, and H. Krcmar. Towards performance awareness in Java EE development environments. In Proceedings of Symposium on Software Performance 2014 (SOSP’14), pages 152–159, 2014. 36
Section References [Deb 2005] K. Deb. Multi-Objective Optimization. In Search Methodologies. Introductory Tutorials in Optimization and Decision Support Techniques, pages 273–316. Springer-Verlag, 2005. [Descartes Research Group 2015] Descartes Research Group. LIMBO: Load Intensity Modeling Framework. http://descartes.tools/limbo, 2015. [Ding and Medvidovic 2001] L. Ding and N. Medvidovic. Focus: A light-weight, incremental approach to software architecture recovery and evolution. In Proceedings of the Working IEEE/IFIP Conference on Software Architecture (WICSA ’01), pages 191–200. IEEE, 2001. [Distributed Management Task Force (DMTF), Inc. 2003] Distributed Management Task Force (DMTF), Inc. Common Information Model (CIM) Metrics Model. http://www.dmtf.org/ sites/default/files/standards/documents/DSP0141.pdf, 2003. [Dudney et al. 2003] B. Dudney, S. Asbury, J. K. Krozak, and K. Wittkopf. J2EE antipatterns. John Wiley & Sons, 2003. [Dugan et al. 2002] R. F. Dugan, Jr., E. P. Glinert, and A. Shokoufandeh. The Sisyphus database retrieval software performance antipattern. In Proceedings of the 3rd International Workshop on Software and Performance (WOSP ’02), pages 10–16. ACM, 2002. [Duvall et al. 2007] P. M. Duvall, S. Matyas, and A. Glover. Continuous Integration: Improving Software Quality and Reducing Risk. Addison-Wesley Signature Series. Pearson Education, 2007. [Dynatrace 2015] Dynatrace. Dynatrace. http://www.dynatrace.com, 2015. [Ehlers et al. 2011] J. Ehlers, A. van Hoorn, J. Waller, and W. Hasselbring. Self-adaptive software system monitoring for performance anomaly localization. In Proceedings of the 8th IEEE/ACM International Conference on Autonomic Computing (ICAC 2011), pages 197–200. ACM, June 2011. [Gamma et al. 1994] E. Gamma, R. Helm, R. Johnson, and J. Vlissides. Design patterns: Elements of reusable object-oriented software. Pearson Education, 1994. [Grabner 2010] A. Grabner. Top 10 performance problems taken from Zappos, Monster, Thomson and Co, 2010. URL http://apmblog.compuware.com/2010/06/15/ top-10-performance-problems-taken-from-zappos-monster-and-co/. [Graham et al. 1982] S. L. Graham, P. B. Kessler, and M. K. Mckusick. Gprof: A call graph execution profiler. SIGPLAN Not., 17(6):120–126, 1982. [Grechanik et al. 2012] M. Grechanik, C. Fu, and Q. Xie. Automatically finding performance problems with feedback-directed learning software testing. In Proceedings of the 34th International Conference on Software Engineering (ICSE 2012), pages 156–166, 2012. [Grinshpan 2012] L. Grinshpan. Solving Enterprise Applications Performance Puzzles: Queuing Models to the Rescue. Wiley-IEEE Press, 1st edition, 2012. [Hall 1992] R. J. Hall. Call path profiling. In Proceedings of the 14th International Conference on Software Engineering (ICSE ’92), pages 296–306. ACM, 1992. [Heger et al. 2013] C. Heger, J. Happe, and R. Farahbod. Automated root cause isolation of performance regressions during software development. In Proceedings of the 4th ACM/SPEC International Conference on Performance Engineering (ICPE ’13), pages 27–38. ACM, 2013. 37
Section References [Heinrich et al. 2014] R. Heinrich, E. Schmieders, R. Jung, K. Rostami, A. Metzger, W. Hasselbring, R. Reussner, and K. Pohl. Integrating run-time observations and design component models for cloud system analysis. In Proceedings of the 9th Workshop on
[email protected], volume 1270, pages 41–46. CEUR, Sept. 2014. [Hork´ y et al. 2015] V. Hork´ y, P. Libic, L. Marek, A. Steinhauser, and P. T˚ uma. Utilizing performance unit tests to increase performance awareness. In Proceedings of the 6th International Conference on Performance Engineering (ICPE ’15), pages 289–300. ACM, 2015. [Horky et al. 2015] V. Horky, P. Libic, A. Steinhauser, and P. Tuma. Dos and don’ts of conducting performance measurements in Java. In Proceedings of the 6th International Conference on Performance Engineering (ICPE 2015), pages 337–340, 2015. [Hrischuk et al. 1999] C. E. Hrischuk, C. M. Woodside, J. A. Rolia, and R. Iversen. Tracebased load characterization for generating performance software models. IEEE Transactions of Software Engineering, 25(1):122–135, Jan. 1999. [Huchard et al. 2010] M. Huchard, A. D. Seriai, and A.-E. El Hamdouni. Component-based architecture recovery from object-oriented systems via relational concept analysis. In Proceedings of the 7th International Conference on Concept Lattices and Their Applications (CLA 2010), pages 259–270, 2010. [Humble and Farley 2010] J. Humble and D. Farley. Continuous Delivery: Reliable Software Releases Through Build, Test, and Deployment Automation. Addison-Wesley Professional, 1st edition, 2010. [H¨ uttermann 2012] M. H¨ uttermann. DevOps for Developers. Apress, 2012. [Hyperic 2014] Hyperic. Hyperic (2014). http://www.hyperic.com, 2014. [Israr et al. 2007] T. Israr, M. Woodside, and G. Franks. Interaction tree algorithms to extract effective architecture and layered performance models from traces. Journal of Systems and Software, 80(4):474–492, 2007. [Jain 1991] R. Jain. The Art of Computer Systems Performance Analysis. John Wiley & Sons, 1991. [Jorgensen and Erickson 1994] P. C. Jorgensen and C. Erickson. Object-oriented integration testing. Commun. ACM, 37(9):30–38, 1994. [Kalbasi et al. 2011] A. Kalbasi, D. Krishnamurthy, J. Rolia, and M. Richter. MODE: Mix driven on-line resource demand estimation. In Proceedings of the 7th International Conference on Network and Services Management, pages 1–9, 2011. [Kerber 2001] L. Kerber. Scenario-based performance evaluation of SDL/MSC-specified systems. In Performance Engineering, volume 2047 of LNCS, pages 185–201. Springer-Verlag, 2001. [Kiciman and Fox 2005] E. Kiciman and A. Fox. Detecting application-level failures in component-based internet services. IEEE Transactions on Neural Networks, 16(5):1027–1041, 2005. [Kiczales et al. 1997] G. Kiczales, J. Lamping, A. Mendhekar, C. Maeda, C. Lopes, J.-M. Loingtier, and J. Irwin. Aspect-oriented programming. In Proceedings of the 11th European Conference on Object-Oriented Programming (ECOOP ’97), volume 1241 of LNCS, pages 220–242. Springer-Verlag, 1997. 38
Section References [Kim et al. 2014] G. Kim, K. Behr, and G. Spafford. The Phoenix Project: A Novel about IT, DevOps, and Helping Your Business Win. It Revolution Press, 2014. [King 2004] B. King. Performance Assurance for IT Systems. Taylor & Francis, 2004. [Kopp 2011] M. Kopp. The top Java memory problems, 2011. URL http://apmblog. compuware.com/2011/12/15/the-top-java-memory-problems-part-2. [Kounev et al. 2011] S. Kounev, K. Bender, F. Brosig, N. Huber, and R. Okamoto. Automated simulation-based capacity planning for enterprise data fabrics. In Proceedings of the 4th International ICST Conference on Simulation Tools and Techniques (SIMUTools ’11), pages 27–36. ICST (Institute for Computer Sciences, Social-Informatics and Telecommunications Engineering), 2011. [Kounev et al. 2014] S. Kounev, F. Brosig, and N. Huber. The Descartes Modeling Language. Technical report, Department of Computer Science, University of Wuerzburg, 2014. URL http://www.descartes-research.net/dml/. [Kowall and Cappelli 2014] J. Kowall and W. Cappelli. Gartner’s magic quadrant for application performance monitoring, 2014. [Koziolek 2013] A. Koziolek. Automated Improvement of Software Architecture Models for Performance and Other Quality Attributes, volume 7 of The Karlsruhe Series on Software Design and Quality. KIT Scientific Publishing, Karlsruhe, 2013. [Koziolek 2010] H. Koziolek. Performance evaluation of component-based software systems: A survey. Performance Evaluation, 67(8):634–658, 2010. [Kraft et al. 2009] S. Kraft, S. Pacheco-Sanchez, G. Casale, and S. Dawson. Estimating service resource consumption from response time measurements. In Proceedings of the 4th International ICST Conference on Performance Evaluation Methodologies and Tools (ValueTools ’09), pages 1–10, 2009. [Krishnamurthy et al. 2006] D. Krishnamurthy, J. A. Rolia, and S. Majumdar. A synthetic workload generation technique for stress testing session-based systems. IEEE Transactions of Software Engineering, 32(11):868–882, 2006. [Krogmann 2010] K. Krogmann. Reconstruction of Software Component Architectures and Behaviour Models using Static and Dynamic Analysis. PhD thesis, Karlsruhe Institute of Technology (KIT), Karlsruhe, Germany, 2010. [Kumar et al. 2009a] D. Kumar, A. Tantawi, and L. Zhang. Real-time performance modeling for adaptive software systems. In Proceedings of the 4th International ICST Conference on Performance Evaluation Methodologies and Tools (ValueTools ’09), pages 1–10, 2009a. [Kumar et al. 2009b] D. Kumar, L. Zhang, and A. Tantawi. Enhanced inferencing: Estimation of a workload dependent performance model. In Proceedings of the 4th International ICST Conference on Performance Evaluation Methodologies and Tools (ValueTools ’09), pages 1–10, 2009b. [Kuperberg et al. 2008] M. Kuperberg, M. Krogmann, and R. Reussner. ByCounter: Portable runtime counting of bytecode instructions and method invocations. In Proceedings of the 3rd International Workshop on Bytecode Semantics, Verification, Analysis and Transformation, 2008. 39
Section References [Kuperberg et al. 2009] M. Kuperberg, M. Krogmann, and R. Reussner. TimerMeter: Quantifying accuracy of software times for system analysis. In Proceedings of the 6th International Conference on Quantitative Evaluation of SysTems (QEST) 2009, 2009. [Lehman and Ramil 2001] M. M. Lehman and J. F. Ramil. Rules and tools for software evolution planning and management. Annals of Software Engineering, 11(1):15–44, 2001. [Li et al. 2010] H. Li, G. Casale, and T. Ellahi. SLA-driven planning and optimization of enterprise applications. In Proceedings of the 1st Joint WOSP/SIPEW International Conference on Performance Engineering (ICPE ’10), pages 117–128. ACM, 2010. [Li and Tian 2003] Z. Li and J. Tian. Testing the suitability of markov chains as web usage models. In Proceedings of the 27th Annual International Conference on Computer Software and Applications (COMPSAC ’03), pages 356–361. IEEE Computer Society, 2003. [Lilja 2005] D. J. Lilja. Measuring computer performance: A practitioner’s guide. Cambridge University Press, 2005. [Liu et al. 2004] T.-K. Liu, H. Shen, and S. Kumaran. A capacity sizing tool for a business process integration middleware. In Proceedings of the IEEE International Conference on ECommerce Technology (CEC 2004), pages 195–202. IEEE, 2004. [Liu et al. 2006] Z. Liu, L. Wynter, C. H. Xia, and F. Zhang. Parameter inference of queueing models for it systems using end-to-end measurements. Performance Evaluation, 63(1):36–60, 2006. [Marwede et al. 2009] N. S. Marwede, M. Rohr, A. van Hoorn, and W. Hasselbring. Automatic failure diagnosis in distributed large-scale software systems based on timing behavior anomaly correlation. In Proceedings of the 13th European Conference on Software Maintenance and Reengineering (CSMR’09), pages 47–57. IEEE, Mar. 2009. [Menasc´e and Almeida 2002] D. Menasc´e and V. Almeida. Capacity Planning for Web Services: Metrics, Models, and Methods. Prentice Hall, 2002. [Menasc´e 2002] D. A. Menasc´e. TPC-W: A benchmark for e-commerce. IEEE Internet Computing, 6(3):83–87, 2002. [Menasce 2004] D. A. Menasce. Composing web services: A QoS view. IEEE Internet Computing, 8(6):88–90, 2004. [Menasc´e 2008] D. A. Menasc´e. Computing missing service demand parameters for performance models. In Proceedings of the CMG Conference 2008, pages 241–248, 2008. [Menasc´e and Gomaa 2000] D. A. Menasc´e and H. Gomaa. A method for design and performance modeling of client/server systems. IEEE Transactions of Software Engineering, 26(11):1066– 1085, 2000. [Menasc´e et al. 1999] D. A. Menasc´e, V. A. F. Almeida, R. Fonseca, and M. A. Mendes. A methodology for workload characterization of e-commerce sites. In Proceedings of the 1st ACM Conference on Electronic Commerce (EC ’99), pages 119–128. ACM, 1999. [Menasc´e et al. 2005] D. A. Menasc´e, M. Bennani, and H. Ruan. On the use of online analytic performance models, in self-managing and self-organizing computer systems. In Self-star Properties in Complex Information Systems, pages 128–142, 2005.
40
Section References [Menasc´e et al. 2007] D. A. Menasc´e, H. Ruan, and H. Gomaa. QoS management in serviceoriented architectures. Perform. Eval., 64(7-8):646–663, 2007. [Mi et al. 2008] N. Mi, L. Cherkasova, K. M. Ozonat, J. Symons, and E. Smirni. Analysis of application performance and its change via representative application signatures. In Proceedings of the IEEE Network Operations and Management Symposium (NOMS 2008), pages 216–223, 2008. [Mos 2004] A. Mos. A framework for adaptive monitoring and performance management of component-based enterprise applications. PhD thesis, Dublin City Universit, 2004. [New Relic, Inc. 2015] New Relic, Inc. New Relic, Inc. http://newrelic.com, 2015. [Nguyen et al. 2012] T. H. D. Nguyen, B. Adams, Z. M. Jiang, A. E. Hassan, M. Nasser, and P. Flora. Automated detection of performance regressions using statistical process control techniques. In Proceedings of the 3rd ACM/SPEC International Conference on Performance Engineering (ICPE ’12), pages 299–310. ACM, 2012. [Object Management Group, Inc. 2005] Object Management Group, Inc. UML Profile for Schedulability, Performance, and Time (SPT), version 1.1. http://www.omg.org/spec/SPTP/ 1.1/, 2005. [Object Management Group, Inc. 2011] Object Management Group, Inc. UML profile for MARTE: Modeling and Analysis of Real-Time Embedded Systems, version 1.1. http://www. omg.org/spec/MARTE/1.1/, 2011. [Object Management Group, Inc. 2012] Object Management Group, Inc. Structured metrics meta-model (smm). http://www.omg.org/spec/SMM/, 2012. [Object Management Group, Inc. 2013] Object Management Group, Inc. Modeling and Analysis of Real-time Embedded Systems (MARTE), 2013. URL www.omg.org/spec/MARTE/. [Open Services for Lifecycle Collaboration 2014] Open Services for Lifecycle Collaboration. OSLC Performance Monitoring Specification version 2.0. http://open-services.net/wiki/ performance-monitoring/OSLC-Performance-Monitoring-Specification-Version-2. 0/, 2014. [Pacifici et al. 2008] G. Pacifici, W. Segmuller, M. Spreitzer, and A. Tantawi. CPU demand for web serving: Measurement analysis and dynamic estimation. Performance Evaluation, 65 (6-7):531–553, 2008. [Parsons and Murphy 2004] T. Parsons and J. Murphy. A framework for automatically detecting and assessing performance antipatterns in component based systems using run-time analysis. In Proceedings of the 9th International Workshop on Component Oriented Programming (WCOP ’04), 2004. [Perez et al. 2013] J. F. Perez, S. Pacheco-Sanchez, and G. Casale. An offline demand estimation method for multi-threaded applications. In Proceedings of the 2012 IEEE 20th International Symposium on Modeling, Analysis & Simulation of Computer and Telecommunication Systems (MASCOTS), 2013. [P´erez et al. 2015] J. F. P´erez, G. Casale, and S. Pacheco-Sanchez. Estimating computational requirements in multi-threaded applications. IEEE Transactions on Software Engineering, 41 (3):264–278, 2015. 41
Section References [Petriu and Woodside 2002] D. C. Petriu and C. M. Woodside. Software performance models from system scenarios in use case maps. In Proceedings of the 12th International Conference on Computer Performance Evaluation, Modelling Techniques and Tools (TOOLS ’02), pages 141–158. Springer-Verlag, 2002. [Petriu and Woodside 2003] D. C. Petriu and C. M. Woodside. Performance analysis with UML. In UML for Real, pages 221–240. Springer-Verlag, 2003. [Poess and Nambiar 2008] M. Poess and R. O. Nambiar. Energy cost, the key challenge of today’s data centers: A power consumption analysis of TPC-C results. In Proceedings of the VLDB Endowment, pages 1229–1240. VLDB Endowment, 2008. [Rathfelder et al. 2012] C. Rathfelder, S. Becker, K. Krogmann, and R. Reussner. Workloadaware system monitoring using performance predictions applied to a large-scale e-mail system. In Proceedings of the Joint 10th Working IEEE/IFIP Conference on Software Architecture (WICSA) & 6th European Conference on Software Architecture (ECSA), pages 31–40, 2012. [Reitbauer 2010] M. N. A. Reitbauer. Flush and clear: O/R mapping antipatterns, 2010. URL http://www.developerfusion.com/ARTICLE/84945/ flush-and-clear-or-mapping-antipatterns. [Riverbed Technology 2015] riverbed.com, 2015.
Riverbed Technology.
Riverbed Technology.
http://www.
[Rolia and Vetland 1995] J. Rolia and V. Vetland. Parameter estimation for performance models of distributed application systems. In Proceedings of the 1995 Conference of the Centre for Advanced Studies on Collaborative Research (CASCON ’95), page 54. IBM Press, 1995. [Salehie and Tahvildari 2009] M. Salehie and L. Tahvildari. Self-adaptive software: Landscape and research challenges. ACM Transactions on Autonomous and Adaptive Systems (TAAS), 4(2):1–42, 2009. [Salfner et al. 2010] F. Salfner, M. Lenk, and M. Malek. A survey of online failure prediction methods. ACM Comput. Surv., 42(3):10:1–10:42, 2010. [Sambasivan et al. 2011] R. R. Sambasivan, A. X. Zheng, M. De Rosa, E. Krevat, S. Whitman, M. Stroucken, W. Wang, L. Xu, and G. R. Ganger. Diagnosing performance changes by comparing request flows. In Proceedings of the 8th USENIX Conference on Networked Systems Design and Implementation (NSDI ’11), pages 43–56. USENIX Association, 2011. [Schroeder et al. 2006] B. Schroeder, A. Wierman, and M. Harchol-Balter. Open versus closed: A cautionary tale. In Proceedings of the 3rd conference on Networked Systems Design & Implementation (NSDI ’06), pages 18–18. USENIX Association, 2006. [Shams et al. 2006] M. Shams, D. Krishnamurthy, and B. Far. A model-based approach for testing the performance of web applications. In Proceedings of the 3rd International Workshop on Software Quality Assurance (SOQUA ’06), pages 54–61. ACM, 2006. [Sharma et al. 2008] A. B. Sharma, R. Bhagwan, M. Choudhury, L. Golubchik, R. Govindan, and G. M. Voelker. Automatic request categorization in internet services. SIGMETRICS Perform. Eval. Rev., 36:16–25, 2008. [Sharma and Coyne 2015] S. Sharma and B. Coyne. DevOps. John Wiley & Sons, 2015.
42
Section References [Smith and Williams 2000] C. U. Smith and L. G. Williams. Software performance antipatterns. In Proceedings of the 2nd International Workshop on Software and Performance (WOSP ’00), pages 127–136. ACM, 2000. [Smith and Williams 2002a] C. U. Smith and L. G. Williams. Performance Solutions: A practical guide to creating responsive, scalable software. Addison-Wesley, 2002a. [Smith and Williams 2002b] C. U. Smith and L. G. Williams. New software performance antipatterns: More ways to shoot yourself in the foot. In Int. CMG Conference, pages 667– 674, 2002b. [Smith and Williams 2002c] C. U. Smith and L. G. Williams. Software performance antipatterns: Common performance problems and their solutions. In CMG Conference, volume 2, pages 797–806, 2002c. [Smith and Williams 2003] C. U. Smith and L. G. Williams. More new software antipatterns: Even more ways to shoot yourself in the foot. In Int. CMG Conference, pages 717–725, 2003. [Smith et al. 2010] C. U. Smith, C. M. Llad´o, and R. Puigjaner. Performance Model Interchange Format (PMIF 2): A comprehensive approach to queueing network model interoperability. Performance Evaluation, 67:548–568, 2010. [Spinner et al. 2014] S. Spinner, G. Casale, X. Zhu, and S. Kounev. LibReDE: A library for resource demand estimation. In Proceedings of the 5th ACM/SPEC International Conference on Performance Engineering (ICPE ’14), pages 227–228. ACM, 2014. [Spinner et al. 2015] S. Spinner, G. Casale, F. Brosig, and S. Kounev. Evaluating approaches to resource demand estimation. Performance Evaluation, 2015. In press. Accepted for publication. [Standard Performance Evaluation Corporation 2015] Standard Performance Evaluation Corporation. SPEC Research Group’s DevOps Performance Working Group. http://research. spec.org/devopswg/, 2015. [Still 2013] A. Still. Category archives: Performance anti-patterns, 2013. //performance-patterns.com/category/performance-anti-patterns/.
URL http:
[Sutton and Jordan 2011] C. Sutton and M. I. Jordan. Bayesian inference for queueing networks and modeling of internet services. The Annals of Applied Statistics, 5(1):254–282, 2011. [Tallabaci and Silva Souza 2013] G. Tallabaci and V. E. Silva Souza. Engineering adaptation with Zanshin: An experience report. In ICSE Workshop on Software Engineering for Adaptive and Self-Managing Systems, pages 93–102, 2013. [Tene 2015] G. Tene. Understanding application hiccups: An introduction to the open source jHiccup tool, 2015. URL http://www.azulsystems.com/webinar/ understanding-application-hiccups-on-demand. [Thereska et al. 2010] E. Thereska, B. Doebel, A. X. Zheng, and P. Nobel. Practical performance models for complex, popular applications. In Proceedings of the ACM SIGMETRICS International Conference on Measurement and Modeling of Computer Systems (SIGMETRICS ’10), pages 1–12. ACM, 2010. [Treibig et al. 2010] J. Treibig, G. Hager, and G. Wellein. Likwid: A lightweight performanceoriented tool suite for x86 multicore environments. Proceedings of the 39th International Conference on Parallel Processing Workshop (ICPPW ’10), 0:207–216, 2010. 43
Section References [Trubiani and Koziolek 2011] C. Trubiani and A. Koziolek. Detection and solution of software performance antipatterns in Palladio architectural models. In Proceedings of the 2nd ACM/SPEC International Conference on Performance Engineering (ICPE ’11), pages 19–30. ACM, 2011. [T˚ uma 2014] P. T˚ uma. Performance awareness: Keynote abstract. In Proceedings of the 5th ACM/SPEC International Conference on Performance Engineering (ICPE ’14), pages 135– 136. ACM, 2014. [Urgaonkar et al. 2007] B. Urgaonkar, G. Pacifici, P. Shenoy, M. Spreitzer, and A. Tantawi. Analytic modeling of multitier internet applications. ACM Trans. Web, 1, 2007. [van Hoorn 2014] A. van Hoorn. Model-Driven Online Capacity Management for ComponentBased Software Systems. Number 2014/6 in Kiel Computer Science Series. Department of Computer Science, Kiel University, 2014. Dissertation, Faculty of Engineering, Kiel University. [van Hoorn et al. 2008] A. van Hoorn, M. Rohr, and W. Hasselbring. Generating probabilistic and intensity-varying workload for web-based software systems. In Proceedings of the SPEC International Performance Evaluation Workshop 2008 (SIPEW ’08), volume 5119 of LNCS, pages 124–143. Springer-Verlag, 2008. [van Hoorn et al. 2012] A. van Hoorn, J. Waller, and W. Hasselbring. Kieker: A framework for application performance monitoring and dynamic software analysis. In Proceedings of the 3rd ACM/SPEC International Conference on Performance Engineering (ICPE ’12), pages 247–248. ACM, 2012. [van Hoorn et al. 2014] A. van Hoorn, C. V¨ogele, E. Schulz, W. Hasselbring, and H. Krcmar. Automatic extraction of probabilistic workload specifications for load testing session-based application systems. In Proceedings of the 8th International Conference on Performance Evaluation Methodologies and Tools (ValueTools 2014), 2014. [Vogel and Giese 2014] T. Vogel and H. Giese. Model-Driven Engineering of Self-Adaptive Software with EUREMA. ACM Transactions on Autonomous and Adaptive Systems, 8(4): 1–33, Jan. 2014. [Vogel et al. 2011] T. Vogel, A. Seibel, and H. Giese. The role of models and megamodels at runtime. Models in Software Engineering, 2011. [von Detten 2012] M. von Detten. Archimetrix: A tool for deficiency-aware software architecture reconstruction. In Proceedings of the 2012 19th Working Conference on Reverse Engineering (WCRE ’12), pages 503–504. IEEE Computer Society, 2012. [von Kistowski et al. 2014] J. von Kistowski, N. R. Herbst, and S. Kounev. Modeling variations in load intensity over time. In Proceedings of the 3rd International Workshop on Large Scale Testing (LT ’14), pages 1–4. ACM, 2014. [von Kistowski et al. 2015] J. von Kistowski, N. R. Herbst, D. Zoller, S. Kounev, and A. Hotho. Modeling and Extracting Load Intensity Profiles. In Proceedings of the 10th International Symposium on Software Engineering for Adaptive and Self-Managing Systems (SEAMS 2015), 2015. [Waller et al. 2015] J. Waller, N. C. Ehmke, and W. Hasselbring. Including performance benchmarks into continuous integration to enable DevOps. SIGSOFT Software Engineering Notes, 40(2):1–4, Mar. 2015. 44
Section References [Wang and Casale 2013] W. Wang and G. Casale. Bayesian service demand estimation using gibbs sampling. In Proceedings of the 2012 IEEE 20th International Symposium on Modeling, Analysis & Simulation of Computer and Telecommunication Systems (MASCOTS), 2013. [Wang et al. 2012] W. Wang, X. Huang, X. Qin, W. Zhang, J. Wei, and H. Zhong. Applicationlevel CPU consumption estimation: Towards performance isolation of multi-tenancy web applications. In Proceedings of the 2012 IEEE 6th International Conference on Cloud Computing (CLOUD 2012), pages 439–446, 2012. [Weiss et al. 2013] C. Weiss, D. Westermann, C. Heger, and M. Moser. Systematic performance evaluation based on tailored benchmark applications. In Proceedings of the 4th ACM/SPEC International Conference on Performance Engineering (ICPE ’13), pages 411–420. ACM, 2013. [Wert et al. 2013] A. Wert, J. Happe, and L. Happe. Supporting swift reaction: Automatically uncovering performance problems by systematic experiments. In Proceedings of the 2013 ACM/IEEE International Conference on Software Engineering (ICSE 2013), 2013. [Wert et al. 2014] A. Wert, M. Oehler, C. Heger, and R. Farahbod. Automatic detection of performance anti-patterns in inter-component communications. In Proceedings of the 10th International ACM Sigsoft Conference on Quality of Software Architectures (QoSA ’14), pages 3–12. ACM, 2014. [Westermann 2014] D. Westermann. Deriving Goal-oriented Performance Models by Systematic Experimentation. PhD thesis, Karlsruhe Institute of Technology, 2014. [Westermann et al. 2012] D. Westermann, J. Happe, R. Krebs, and R. Farahbod. Automated inference of goal-oriented performance prediction functions. In Proceedings of the 27th IEEE/ACM International Conference on Automated Software Engineering (ASE), pages 190– 199, 2012. [Woodside et al. 2007] C. M. Woodside, G. Franks, and D. C. Petriu. The future of software performance engineering. In Future of Software Engineering, (FOSE ’07), pages 171–187, May 2007. [Woodside et al. 2005] M. Woodside, D. C. Petriu, D. B. Petriu, H. Shen, T. Israr, and J. Merseguer. Performance by unified model analysis (PUMA). In Proceedings of the 5th International Workshop on Software and Performance (WOSP ’05), pages 1–12. ACM, 2005. [Wu and Woodside 2004] X. Wu and M. Woodside. Performance modeling from software components. In Proceedings of the 4th International Workshop on Software and Performance (WOSP ’04), pages 290–301. ACM, 2004. [Xu 2012] J. Xu. Rule-based automatic software performance diagnosis and improvement. Performance Evaluation, 69(11):525–550, 2012. [Zenoss 2014] Zenoss. Zenoss (2014). http://www.zenoss.com, 2014. [Zhang et al. 2002] L. Zhang, C. H. Xia, M. S. Squillante, and W. N. I. Mills. Workload service requirements analysis: A queueing network optimization approach. In Proceedings of the 10th IEEE International Symposium on Modeling, Analysis, and Simulation of Computer and Telecommunications Systems (MASCOTS 2002), page 23ff, 2002. [Zheng et al. 2008] T. Zheng, C. M. Woodside, and M. Litoiu. Performance model estimation and tracking using optimal filters. IEEE Transactions of Software Engineering, 34(3):391–406, 2008. 45
Section References [Zhu et al. 2007] L. Zhu, Y. Liu, N. B. Bui, and I. Gorton. Revel8or: Model driven capacity planning tool suite. In Proceedings of the 29th International Conference on Software Engineering (ICSE ’07), pages 797–800, 2007.
46