Personal and Ubiquitous Computing Future Impacts of the Reforestation Policy on the atmospheric parameters in Ireland: a sensitivity study including heat discomfort impacts on humans and livestock --Manuscript Draft-Manuscript Number:
PAUC-D-17-00178R1
Full Title:
Future Impacts of the Reforestation Policy on the atmospheric parameters in Ireland: a sensitivity study including heat discomfort impacts on humans and livestock
Article Type:
S.I. : Ambient Systems, Networks & Technologies
Funding Information:
Horizon 2020 Framework Programme (iSCAPE) (689954)
Abstract:
The increase of temperature attributed to anthropogenic emissions is projected to continue in future climate scenarios. Protocols and policies are being put in place in several European countries to reduce both emissions and impact of human activities on climate. The Irish Reforestation policy is a good example of such protocols. Nevertheless often contemplated policies do not take into account their potential effects on the atmospheric variables. This study aims to assess the influence of the increase of vegetation cover over Ireland, on surface temperature, livestock and human heat comfort, using the Weather Research Forecast (WRF-ARW 3.7.1) model. Multi-scale numerical simulations are performed under two scenarios: (i) a "control scenario'' considering no change in vegetation cover with respect to the prescribed one and (ii) a "green scenario'' with increased tree cover based on the introduced Irish Reforestation policy. To simulate this policy, the cropland and vegetative mosaic is substituted with evergreen broad leaf forest, increasing the total forest area from 19.7% to 36.2% of the land in the analyzed domain. This change in vegetation cover increases the temperature over the simulated domain up to 0.7°C and, moreover, it enhances both human and livestock heat discomfort during the day-time, with different magnitude all over the domain. It is concluded that the reforestation policy, which is introduced to mitigate the climate warming and greenhouse gas emissions, causes a further increase in temperature along with heat discomfort to both human and livestock.
Corresponding Author:
Arianna Valmassoi University College Dublin Dublin, IRELAND
Not applicable
Corresponding Author Secondary Information: Corresponding Author's Institution:
University College Dublin
Corresponding Author's Secondary Institution: First Author:
Arianna Valmassoi
First Author Secondary Information: Order of Authors:
Arianna Valmassoi Salem S. Gharbia Silvana Di Sabatino Prashant Kumar Francesco Pilla
Order of Authors Secondary Information: Author Comments:
The following paper has been selected from the ANT conference for the JUPC special issue. Files to modify the .tex can be requested, since the program cannot build the pdf Powered by Editorial Manager® and ProduXion Manager® from Aries Systems Corporation
Response to Reviewers:
To the editor and the anonymous reviewers, We would really like to thank everyone involved in the review process of this paper for the time you spent in helping improve the work we are doing, we really appreciate it. To reviewer 1, we really thank you so much for the comments and we addressed them in the paper, especially: 1) we introduced the background of the reforestation policy in the introduction of the paper, explaining and citing part of the documents that are relevant for the hypothesis that we made. 2) we addressed, also in the literature, few studies that investigated the afforestation impact over Europe and USA in the past years. Also, we explicitly write part of their results that match what we obtained. 3) we addressed the limitations of this study, from the modelling perspective, in the method and conclusions. While for the impact on livestock and humans we addressed them in the respective result section, as well as summarized it in the conclusions. 4) In the conclusion and method is reported the magnitude of the climate projections for 2020, we reported them as well in the conclusion. In this context we reported that the projections have the same magnitude of the increase caused by the reforestation. To reviewer 2, We thank you very much for the comments and we further improved the motivations and reasoning within the study, so that it would be easier for any PhD to proceed further in the work.
Powered by Editorial Manager® and ProduXion Manager® from Aries Systems Corporation
Click here to download Manuscript Valmassoi_et_al.tex Click here to view linked References Noname manuscript No. (will be inserted by the editor)
1 2 3 4 5 6 7 8 9 10 11 12 13 14 15 16 17 18 19 20 21 22 23 24 25 26 27 28 29 30 31 32 33 34 35 36 37 38 39 40 41 42 43 44 45 46 47 48 49 50 51 52 53 54 55 56 57 58 59 60 61 62 63 64 65
Future Impacts of the Reforestation Policy on the atmospheric parameters in Ireland: a sensitivity study including heat discomfort impacts on humans and livestock Arianna Valmassoi · Salem Gharbia · Silvana Di Sabatino · Prashant Kumar · Francesco Pilla
Received: date / Accepted: date
Abstract The increase of temperature attributed to anthropogenic emissions is projected to continue in future climate scenarios. Protocols and policies are being put in place in several European countries to reduce both emissions and impact of human activities on climate. The Irish Reforestation policy is a good example of such protocols. Nevertheless often contemplated policies do not take into account their potential effects on the atmospheric variables. This study aims to assess the influence of the increase of vegetation cover over Ireland, on surface temperature, livestock and human heat comfort, using the Weather Research Forecast (WRF-ARW 3.7.1) model. Multi-scale numerical simulations are performed under two scenarios: (i) a “control scenario” considering no change in vegetation cover with respect to the prescribed one and (ii) a “green scenario” with increased tree cover based on the introduced Irish Reforestation policy. To simulate this policy, the cropland and vegetative mosaic is substituted with evergreen broad leaf forest, increasing the total forest area from 19.7% to 36.2% of the land in the analyzed domain. This change in vegetation cover increases the temperature over the simulated domain up to 0.7o C and, moreover, it enhances both human and livestock heat discomfort during the day-time, with different magnitude all over the domain. It is concluded that the reforestation policy, which is introduced to mitigate the climate warming and greenhouse gas emissions, causes a further increase in temperature along with heat discomfort to both human and livestock. Keywords Climate change · reforestation policy · livestock · sensitivity study A. Valmassoi Urban Institute, Dept. of Planning and Environmental Policy, University College Dublin, Belfield, Dublin 14, Ireland E-mail:
[email protected]
2
1 2 3 4 5 6 7 8 9 10 11 12 13 14 15 16 17 18 19 20 21 22 23 24 25 26 27 28 29 30 31 32 33 34 35 36 37 38 39 40 41 42 43 44 45 46 47 48 49 50 51 52 53 54 55 56 57 58 59 60 61 62 63 64 65
Arianna Valmassoi et al.
1 Introduction The continued emissions of greenhouse gases (GHG) worldwide cause an increase in the temperature, even considering the intrinsic interannual variability, as it leads to further warming and changes in all components of the climate system [1]. To limit climate change, many policies for GHG emission reduction have been applied to all the European Member States as 2020 goals as well as the Forestry programme[2] in Ireland. The latter is an afforestation policy which aims to increase the forest cover from 10.7% to 18% in 2020[2]. The introduced policy is planned to positively affect different aspect of the environment as carbon sequestration, biodiversity, and it should have no impacts on the water quality and social aspects [3]. Vegetation cover and vegetative canopies strongly influence both energy and moisture surface-atmosphere fluxes[4] [5]. This is because interaction with the atmosphere is fundamentally caused by: (i) vegetation response to the incoming solar radiation and its emission in the longwave portion of the spectrum; (ii) the modification of the aerodynamic roughness length; and (iii) plant transpiration and photosynthesis processes [4]. Moreover, these are complex and non-linear interaction that can dampen or amplify the anthropogenic climate change[5]. The evaporative effect of temperate forest (as in Ireland[6]), is unclear, but generally both the albedo and the ratio of evapotranspiration to available energy is lower if compared to low vegetation and cropland[5]. This uncertain effect caused in many climate simulations both a warmer air temperature surface and soil [5] [7] [8]. Conversely, the effect on mesoscale models is less clear due to atmospheric feedbacks that impact on cloudiness[5]. Moreover, as observed in several European studies, the surface radiative temperature can be similar between forest and agricultural land if the soil is moist, but it responds differently to drought situations[5] [9]. However, the response of these two vegetation types during high temperature extremes depends on the event duration [9]. In fact, while vegetation undergoes an initial surface heating that is twice as high over forest than grassland, it maintains longer the green component[5] due to their access to deeper reservoirs of soil water. Over grass and croplands, at first, heating is suppressed by increasing evapotranspiration, which ultimately accelerates soil moisture depletion and enhances the temperature anomalies [9]. The impact of climate change on the land use has been well studied[10][11][12][13] [14]; an example being the forced migration of crop species in Europe due to variation in both temperature and precipitation patterns[12]. However, the opposite feedback effect, less considered in the past, has seen an increase of attention in the recent studies [15][16] [17][10]. Previous literature has provided evidence that conversion of all land types to agriculture resulted in cooling impacts[10][16]. Furthermore, local changes in the land use impact beyond their scale, and affect the weather and climate of a wider area[10]. In particular, few studies addressed reforestation processes [18] [19], none of which focuses on rapid anthropogenic changes. Naudts et al., 2016 found that forest management, in particular, conversion from broad-leaf to needle-leaf
Future Impacts of the Reforestation Policy
1 2 3 4 5 6 7 8 9 10 11 12 13 14 15 16 17 18 19 20 21 22 23 24 25 26 27 28 29 30 31 32 33 34 35 36 37 38 39 40 41 42 43 44 45 46 47 48 49 50 51 52 53 54 55 56 57 58 59 60 61 62 63 64 65
3
forests, and afforestation in Europe caused an atmospheric warming both due to change in albedo and heat fluxes[18]. The radiative imbalance at top of the atmosphere caused by land use change is increased by 0.12 W m−2 , of which 0.11 is largely explained by species conversion. Consequently, summer time boundary layer temperature increased by 0.12 o C[18]. A similar result was obtained by Burakowski et al, 2016 for the New England (USA) region[19]. Using the Weather Research Forecast (WRF) model, the abandoning of agriculture land (identified by cropland/grassland) in the region, since 1850, and re-growth of forests caused an increase in winter temperature from +0.5 to +3K. The general patterns observed in the study are that evergreen needle leaf forest yielded the strongest warming response and the deciduous broad leaf forest the weakest one. In particular, the strength of this warming response is linked to the increase in shortwave energy absorbed by the forest vegetation as well as the increase in sensible heat flux[19]. Climate change has an impact also on livestock[20] [21] [22], as well as on human beings [23] [24] [25] [26], through direct and indirect effects. In fact, a high confidence of accruing a reduction in animal feeding and growing rate is reported in literature[20]. In a study of the impact of the UK changing climate on dairy cow production, it is found that milk yields will be reduced and the mortality rates will increase due to the heat stress throughout the current century[21][20]. This will lead to an annual total losses amounting to around 40 million by the 2080s under a medium-high greenhouse gases emission scenario[21]. Most of the recent studies related to climate change and livestock are focused on the impact in the developing countries, as it is possible to see from Thorton et al.[22]. Developed areas, such as Central and Northern Europe, are less represented in relevant scientific literature[21]; nevertheless, these areas will be affected by climate change in the next decades[1] [12] and have almost half of the total European beef production [27]. The relationship between climate extremes, combined with extreme temperature conditions or air pollution, and human heat stress and mortality has been more widely studied [23] [28] [29] [30] [31] [32] [33]. Moreover, there is a strong correlation between the increase in deceases and temperature, with a drastic peak during heat wave events [24] [32] [23] [33]. Furthermore, climate change aggravates the risk of heat-related mortality[34] [33]. It is recognized and widely studied that southern European countries are more at risk for heat related deaths [1] [25] [35] [26] [31], but fewer concerns also countries in northern Europe in their analysis [23] [36] [24]. These areas, even with lower mean temperature, can show peaks of mortality during heat waves[31] [36] [23]. To reach the Europe 2020 objective for sustainable and inclusive growth, the Common Provisions Regulation (CPR) represent the common strategic guidelines for EU and all European Structural and Investment Funds[37]. The CPR aims to achieve the goals through thematic objectives, some of which apply to the Rural Development Regulations. Ireland, in this context carried out an analysis identifying the specific needs, which for the forestry sector is due to the currently low base of forest (11%) against the EU average (38%)[38]. For the forestry sector, it was determined that (i) forest cover and (ii) the
4
1 2 3 4 5 6 7 8 9 10 11 12 13 14 15 16 17 18 19 20 21 22 23 24 25 26 27 28 29 30 31 32 33 34 35 36 37 38 39 40 41 42 43 44 45 46 47 48 49 50 51 52 53 54 55 56 57 58 59 60 61 62 63 64 65
Arianna Valmassoi et al.
production of forest biomass for renewable energy target need to be increased, also (iii) to support forest holders in managing their plantation and (iv) maximize the environmental and social benefits[37]. One of the eleven measures determined by the Department of Agriculture, Food and the Marine is the “Afforestation and Creation of Woodland”, which aims to support the “establishment and premium payments for creation of new forests”, including “commercial afforestation, agro-forestry, forestry for fiber and native woodland establishment, with a view to providing ecosystem services”[37]. In the specific case of afforestation, the guidelines present five reforestation objectives, which are related to the tree-type to be used. Four out of five objective includes, in different percentages per hectare, conifer for timber production. However, the objective “Conifer Forest for Wood Production” clearly states that to the proper native broad-leaf species should be planted in and around the site, achieving a minimum of 90% stocking of free-growing trees evenly distributed after year 4 of plantation[39]. In the section dedicated to “Climate Change” and the impacts on the environment, there is no assessment from the atmospheric and climate perspective, if not for the potential carbon sequestration enhancement[37]. Therefore, this work aims to assess, through a sensitivity approach, the effect of the aforementioned reforestation policy on meteorological parameters, since the vegetation highly affects the climate system through atmospheric dynamics[4] not only as a sink for greenhouses gases, as suggested by the policy[2][40]. This study also considers the effect of the policy on the well-being of both livestock and humans, which is assessed through several indexes used in the literature.
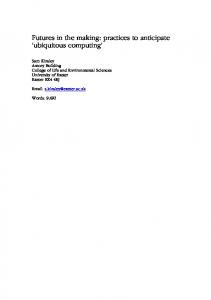
2 Method 2.1 Study area and period The study focuses on most of the land that the reforestation policy targets, as can be seen from the centering of the domains in Figure 1. The domains are designed to have the sub-domain (D04) over the Republic of Ireland, even if excluding Northern Ireland and County Donegal, due to computational costs. Ireland has a high population of livestock: 6.3 millions of cattle[41], 3.3 millions of sheep[3] and 1.5 millions of pigs[42]. The livestock has a very high density in some regions of the inland, i.e. in the south part, for the bovine, it varies from around 110,000 to 220,000 per km2 [41]; more than 370 hundreds[3] sheep are in the mid west of the country (counties Mayo and Galway). Moreover, internal economic policies are targeting the food market aiming to increase both the production and the export[43]. Hence, livestock is acquiring more importance both in the current market and in future investments[43]. Ireland has a population of 4.6 million, 62% of it lives in urban areas that cover 2.4% of the total land area [44]. Majority of the small towns, have undergone a rapid urbanization between 2006 and 2011 with a population change increase
Future Impacts of the Reforestation Policy
1 2 3 4 5 6 7 8 9 10 11 12 13 14 15 16 17 18 19 20 21 22 23 24 25 26 27 28 29 30 31 32 33 34 35 36 37 38 39 40 41 42 43 44 45 46 47 48 49 50 51 52 53 54 55 56 57 58 59 60 61 62 63 64 65
5
Fig. 1 Two-way nested simulation domain centered over Ireland.
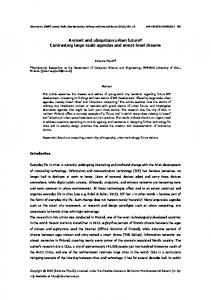
of at least 5%. The national average density in rural areas is 26 inhabitants per km2 , with a slight increase in southern counties from 2006 to 2011 [44]. Climate projections for the near future over Ireland show that an increase of the mean temperature will be observed, which is more pronounced in winter than summer [45]. Instead, with respect to precipitation, wetter winters (+14%) with more heavy precipitation events are expected as well as drier summers (-20%)[45] [46]. The impact of the reforestation policy is to be assessed on its target year, which is 2030[2]. Therefore, a suitable period for the simulation is chosen accordingly to the target year, the past temperature and precipitation fields and the IPCC projections. This paper focuses on the part of a summer season, which has similar anomalies’ order of magnitude to the aforementioned ones, and they are calculated from the gridded observational dataset Eobs[47]. These anomalies are obtained subtracting to each grid value the monthly average of the reference period considered, i.e. 1981-2010 the current World Meteorological Organization (WMO) climate normals[48]. Further, the anomalies are averaged over the Ireland Island (i.e. considering both Northern Ireland and Republic of Ireland land), with the corresponded hourly spatial standard deviation, to obtain a time series.
Fig. 2 Temperature and precipitation anomalies over the D04 area with respect to the period 1981 − 2010.
Analysing the whole precipitation and temperature series, it is observed that
6
1 2 3 4 5 6 7 8 9 10 11 12 13 14 15 16 17 18 19 20 21 22 23 24 25 26 27 28 29 30 31 32 33 34 35 36 37 38 39 40 41 42 43 44 45 46 47 48 49 50 51 52 53 54 55 56 57 58 59 60 61 62 63 64 65
Arianna Valmassoi et al.
July 2013 has a lack of precipitation from the 5th till the 21st (Figure 2, right). During the same period there are also two peaks of +4 o C anomalies (Figure 2, left). Given the two temperature maxima, the first has longer amplitude and smoother features, which reduce possible non-linear interactions with perturbations. Moreover, the chosen year is near to present-time, with a ground monitoring station at its widest spread. Therefore, the proper period to simulate is highlighted in the gray-shaded area of Figure 2 and it is from the 8th of July 2013.
2.2 Numerical simulation The sensitivity test presented herein is based on the non-hydrostatic version of the Weather Research Forecast (WRF) model (version 3.7), a widely used model for both meteorological and climatological purposes[49]. The simulations span over a five-day period, starting 8th of July 2013 00 UTC (Time zone: UTC+1), using four two-way nested domains. The smallest domain (Fig. 1) covers most of the Republic of Ireland and has a spatial resolution of 1.5 km. The resolution choice for the smallest domain is due to compromise computational costs, spatial land-use data and convection resolving in the model. The NCEP FNL (Final) Operational Global Analysis product is used as initial and boundary conditions, with a spatial resolution of 1 degree (about 100 km)[50]. The boundary condition is called by the model every 6 hours to constrain the evolution. The simulations are run with the YSU scheme for the planetary boundary layer parameterization[51] and Noah land surface model[52] for the land surface processes. However, there is no urban boundary layer parameterization due to three main reasons: (i) this is a sensitivity and economic oriented study, (ii) there is a lack of widespread urban areas (0.2% of the pixel are category 13, and most likely overestimated[53]) and (iii) the resolution is too low to capture significant urban features. The land-use characteristics are obtained from the MODIS data with the resolution of 30 seconds (about 927 m) for the 4 domains (Figure 3 left). To enhance the subgrid landuse features, the option of “surface mosaic” is used, which means that each grid point has the three most common categories, which improves the spatial representation of the forecasted variables[54]. The forest coverage over Ireland shows a high variation within the available databases[55]. The MODIS forest coverage (categories 1 to 5 in figure 3 on the left) is approximately 19.7% of the analyzed domain, which is double of what is observed in the Forestry 2010 database[56]. In the studied policy it is not specified neither a type of tree nor the locations[2], only that grants are given to private landowners to establish new forests on treeless land, preferring native vegetation [56]. In Ireland, the 72% of the native species are categorized as broad-leaf trees, which however occupies only 21.3% of the forest cover, while in the non-native ones there are also need-leaf types [57]. To simulate in numerical model these uncertainties, a sensitivity approach is preferred: specific land-use categories are substituted
Future Impacts of the Reforestation Policy
1 2 3 4 5 6 7 8 9 10 11 12 13 14 15 16 17 18 19 20 21 22 23 24 25 26 27 28 29 30 31 32 33 34 35 36 37 38 39 40 41 42 43 44 45 46 47 48 49 50 51 52 53 54 55 56 57 58 59 60 61 62 63 64 65
7
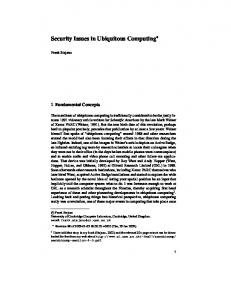
Fig. 3 Land use categories as defined in MODIS[49]. The CTR land-use is on the left. The VEG run is obtained substituting to the land category 14 (crop and natural vegetation mosaic) the number 2 ( evergreen broad-leaf).
following the previous considerations and the policy guideline. All land-use categories used are the standard from MODIS, with the parameters defined by WRF in its original distribution (information and specifics can be found in the LANDUSE.TBL in the source code). The most common tree category in MODIS is the Evergreen Broad-leaf Forest (number 2, 57% of the forest grid points), which could also include Irish native species. Also, the most common open area is crop and vegetation mosaic (category number 14). To reflect the planting of native trees on treeless areas in MODIS and the WRF model, category 14 has been replaced with the broad-leaf category number 2. This reflect the biodiversity and conservation aspect that the policy aims as beneficiary effect[56]. To assess the direct effect of the increase in vegetation, two set of land-use are used with the same model configuration and in the same time period. The first is called CTR since uses the current MODIS land-use configuration, while VEG run employs aforementioned modification (Figure 3 right). With this substitution, the vegetation cover was increased to 36.2% of the land in the domain, that is less than the double of the Reforestation policy aim. This simplified method is preferred to a set of simulations, since as already assert by McPherson et. al (2005)[58], it allows a direct confrontation of the differences between the output fields. 3 Results and discussion 3.1 Model validation The model outputs for temperature is compared against the air temperature data taken 2m above the ground for five meteorological stations (Table 1 and
8
1 2 3 4 5 6 7 8 9 10 11 12 13 14 15 16 17 18 19 20 21 22 23 24 25 26 27 28 29 30 31 32 33 34 35 36 37 38 39 40 41 42 43 44 45 46 47 48 49 50 51 52 53 54 55 56 57 58 59 60 61 62 63 64 65
Arianna Valmassoi et al.
Figure 4 left) within the area of study. The stations are not in urban areas, due to the previously discussed lack of the urban parameterization. All data are obtained from the Irish meteorological station network[59] and they cover the D04-region, as the left side of Figure 4 shows. Statistical indexes are used to assess the overall performance of model with respect to the observed data, as well as a linear regression with the hourly CTR output obtained for the stations location[59]. The Mean Bias Error (MBE), measured in Celsius degrees, the Mean Percentage Error (MPE) and the Mean Absolute Percentage Error (MAPE), as well as the slope and the r2 from the linear regression, are used as indexes and they are calculated on the whole period (Table 1). All locations, with the exception of Moore Park’s, show a linear
Table 1 Table of the indexes obtain for the 5 sites considered to validate the model. Station name
Slope
r2
MBE (o C)
MPE (%)
MAPE (%)
Gurteen Moore Park Oak Park Dublin Airport Dunsany
0.94 1.25 0.98 1.16 0.96
0.85 0.67 0.85 0.83 0.83
-1.97 -2.20 -2.82 -2.64 -2.08
-9.39 -7.43 -13.72 -13.08 -10.57
11.34 16.34 15.88 15.90 13.25
behavior both with a slope close to one and a good r-squared. This behavior is well seen in Figure 4, on the right, since all the single points are close to the quadrant bisector (black line in Figure 4 right). Only Moore Park, in blue, does not show a clear linear dependence, but a more scattered one. An underestimation of the temperature is observed in all sites, as can be seen from the negative MBE and the scatter plot. The simulations has a MPE around 10%, the negative value of this index assess the average behavior of underestimation of the measured value. On the other hand, this underestimation is an overall feature, since MAPE has a higher value than MPE. This means that some of the negative differences between observed and simulated are compensated by positive ones. The higher the difference between these two indexes, the more scattered the data, without a underestimation or overestimation, as for the Moore Park station. The underestimation observed in the simulation is expected due to the choice of the PBL scheme. In fact, from previous studies it is stated that summer periods show an underestimation of up to 2o C for the maximum temperatures for most of investigated WRF schemes. Nevertheless, it is identified as the best scheme to be used for the region[60]. Furthermore, the points on the right side of Figure 4 has been divided between night (21:00 to 4:00 UTC) and day (5:00 to 20:00 UTC). The underestimation previously described is mostly during the day and the hottest hours, while for the night time simulation approximate better the measures.
Future Impacts of the Reforestation Policy
1 2 3 4 5 6 7 8 9 10 11 12 13 14 15 16 17 18 19 20 21 22 23 24 25 26 27 28 29 30 31 32 33 34 35 36 37 38 39 40 41 42 43 44 45 46 47 48 49 50 51 52 53 54 55 56 57 58 59 60 61 62 63 64 65
9
Fig. 4 Scatter plot for the T2, observed data versus CTR simulations in the stations location, which is shown on the left side. Stations in the west coast were not chosen due to the presence of the cliffs, that as discussed in the results, is not well modeled.
3.2 Meteorological variable In this paper, only the 2-meter height temperature (referred as T2) is presented as a direct output of the simulations performed. This parameter is directly influenced by both the boundary layer and the soil physics, as well as the mesoscale circulation. This section discusses the T2 as obtained from the VEG run and the difference between the two simulations, defined as ∆T 2 = T 2V EG − T 2CT R .
Fig. 5 Average over the land of the D04 for the T2 (VEG), on the left, and the difference between the run, on the right.
Figure 5 shows the time series of T 2V EG and ∆T 2 averaged over the land of the smallest domain, with the spatial standard deviation. On average, the increase in vegetation causes an increase of the T2 (∆T 2 > 0) with the daily cycle (Figure 5 on the right). Even if the maximum of the T2 daily cycle is always after 12 UTC, the maximum of the differences is before: between 8 UTC and 11 UTC. The only exception is the first simulated day, but that could be due to the lack of a warm-up to let the perturbation reach its equilibrium. T2 shows a low spatial variability, mostly less than 0.3o C, with some regions with negative values of ∆T 2 during the night-time. Since the induced variation in the land-use has not a regular pattern (Figure 3), a specific spatial feature is not to be expected. Figure 6 shows the results obtained for the T2, averaged on the hottest hours of the days in the analyzed
10
1 2 3 4 5 6 7 8 9 10 11 12 13 14 15 16 17 18 19 20 21 22 23 24 25 26 27 28 29 30 31 32 33 34 35 36 37 38 39 40 41 42 43 44 45 46 47 48 49 50 51 52 53 54 55 56 57 58 59 60 61 62 63 64 65
Arianna Valmassoi et al.
Fig. 6 Spatial distribution of the T2 (VEG) during the hottest hours of the day ( averaged from 12 UTC to 17 UTC), on the left, and the difference between the run, on the right.
period. From the data in figure 5 right, it is obtained that the maximum in the T2 mainly are from 12 UTC to 17 UTC. The simulation has a strong horizontal temperature gradient across the sea-line, more pronounced for the west coast than the east and south ones. Most of the lands in the domain have high temperatures, from 5 to 7o C above the 1981-2010 July average. The increase in the vegetation cover leads to a positive ∆T 2 all over the land, which is more pronounced in the area with a higher occurrence. Even areas without land-use changes has an average increase of at least 0.2o C during the hottest hours of the day, i.e. Dublin County and the southern part of Cork County. On the other hand, over the ocean there is no change in the temperature, with the only exception resembled by the area near the west coast with a high negative difference. This could be due to the presence of the cliffs which may induce a change in the local circulation caused by complex terrain interactions. However, this aspect is not analyzed because it has a non-linear feature and cannot be assessed with a single perturbation run. 3.3 Thermal heat comfort index for livestock Most of the changes in temperature discussed in Section 3.1 refer to areas with a high density of livestock, but not humans. For example, in the area located between 53 N and 54 N (high positive ∆ T2), there is a bovine density that varies from around 110,000 to 183,000 per km2 [41] and for sheep, in the west-most part of that area, a population of around 370 hundreds[3]. Since also animals can experience thermal stress, this study will focus on the impact of vegetation on the livestock throughout the change in the meteorological parameters, not in the pastures. In order to quantify this effect, the
Future Impacts of the Reforestation Policy
1 2 3 4 5 6 7 8 9 10 11 12 13 14 15 16 17 18 19 20 21 22 23 24 25 26 27 28 29 30 31 32 33 34 35 36 37 38 39 40 41 42 43 44 45 46 47 48 49 50 51 52 53 54 55 56 57 58 59 60 61 62 63 64 65
11
Fig. 7 Average over the land of the D04 for the THIC calculated for VEG, on the left, and the difference between the run, on the right.
Thermal Heat Comfort Index for livestock (THIC, hereafter)[61] is calculated from the simulation output fields. THIC is an empiric function of the T2 and the wet bulb temperature(Twb ), calibrated for pigs[61], and is obtained with the following formula: T HIC = 0.72 · T 2 + 0.72 · Twb + 40.6
(1)
All the variables in eq.1 are in o C and Twb is obtained with a built-in function of the NCL libraries. This index is obtained from the hourly model output data. The same procedure used for the T2 is applied for the THIC to discuss the results. The time series of the THIC, in the VEG run, is shown in figure 7 on the left, while the difference between the two run (∆T HIC) is in figure 7 on the right. Both quantities are averaged over the land of the D04. The THIC, calculated for the VEG run, shows a daily cycle that is quite similar to the T2 one (figure 5 left). The index varies from 60, during nighttime, to 71 for the peak hours. These values are not an immediate danger for the animals, but still are quite high, considering that 75 in the limit for the “Alert” level[61]. The spatial standard deviation is at most 1, which is a low spread for the index value, and is highest during the both the minima and the maxima of the daily cycle. The influence of the increase in the vegetation on the heat comfort for the livestock will be assessed through∆T HIC. The vegetation lead to an increase of the THIC up to 0.6, with a different amplitude during the day. In fact, the effect is higher during the hottest hours of the day, rather than the night-time. In particular, ∆T HIC does not follow the same daily cycle of the THIC: the maxima of the differences are earlier the day, as they are observed between 9 and 11 UTC. Moreover, ∆T HIC has a high standard deviation, therefore it is of interest to investigate further in the spatial distribution of this index. As the index is a threshold one, the spatial distribution of the time-average of the index maxima is here analyzed, using the timespan used in the T2 case. Results are shown in figure 8 for both the VEG run, on the left, and for ∆T HIC, on the right. The THIC calculated on the variables of the VEG run, on the left, shows high values all over the west part of the country, most of the region over 72. These areas of the country with high values has also a high density and number of livestock animals[41][3]. As for the T2, also THIC has lower values for the
12
1 2 3 4 5 6 7 8 9 10 11 12 13 14 15 16 17 18 19 20 21 22 23 24 25 26 27 28 29 30 31 32 33 34 35 36 37 38 39 40 41 42 43 44 45 46 47 48 49 50 51 52 53 54 55 56 57 58 59 60 61 62 63 64 65
Arianna Valmassoi et al.
Fig. 8 Spatial distribution of THIC during the hottest hours of the day ( averaged from 12 UTC to 17 UTC), on the left, and the difference between the run, on the right.
eastern and southern coast, from 4 to 8 points lower. The influence of the changes in the vegetation, as for the T2, are scattered over the land and causes positive values of ∆ THIC. The amplitude of the positive ∆THIC varies between less than 0.2 and 0.5; the maxima are more spread over the land than for the ∆ T2, in figure 6 right. The increase of THIC interest a lot of areas that has a high density of animals, as County Mayo and Galway as well as County Limerick and County Longford. All the values of ∆THIC over the ocean are not to be considered since this index is applied to livestock only. The negative values observed on the coast of the western part are mainly caused by the negative ∆ T2, and their significance was already discussed in the previous section.
3.4 Human thermal comfort We have selected three of the most common empirical indexes for human thermal comfort for analysis. These include: the Apparent Temperature (AT), the Heat Index (HINW) and the Humidex Index ( HI) [61] [62]). Several indexes are used because none is found to perform better than the others [28]. The apparent temperature is based on the definition used by the Australian Bureau of Meteorology[63] and includes the effects of temperature, humidity and wind speed. This is the only index used that includes explicitly the wind speed, while the other indexes assume a reference one. Moreover, the AT has no explicit threshold, rather it shows an amplification of the perceived temperature, assuming not direct exposure to sunlight[61]. The HI developed by the United States National Weather Service (HINW) and it is used for heat stress early warning system. It is defined as a polynomial fit to Steadman comfort model [61] using temperature and relative humidity. HINW uses threshold to define heat stress: 27-32o C is associated with caution,
Future Impacts of the Reforestation Policy
1 2 3 4 5 6 7 8 9 10 11 12 13 14 15 16 17 18 19 20 21 22 23 24 25 26 27 28 29 30 31 32 33 34 35 36 37 38 39 40 41 42 43 44 45 46 47 48 49 50 51 52 53 54 55 56 57 58 59 60 61 62 63 64 65
13
Fig. 9 Temporal series of the ATV EG averaged over the land, on the left, and the difference between the run, on the right.
33-39o C with extreme caution, 40-51o C with danger, and above 52o C with extreme danger. The HI, developed in Canada, is defined as a bio-meteorological index to describe the discomfort perceived by the human body in hot and humid days [61]. HI is based on the dew point, but it is equivalent to dry temperature in degrees Celsius omitting the degree symbol. According to the Meteorological Service of Canada, a humidex of at least 30 causes “some discomfort”, at least 40 causes “great discomfort” and above 45 is “dangerous”, while if it hits 54, heat stroke is imminent [61]. The threshold types indexes can leads to underestimation or overestimation of the actual heat stress since they are calibrated on certain areas. In particular, it is to assume that the simulated value is most likely to underestimate the perceived distress. In fact, the Irish “orange weather alert” for hot temperature is set when the maximum temperature is above 27 o C and the “red” one is when the prediction is for at least two consecutive days [59]. This extreme condition for Irish standards, on the other side is a common feature of a typical Australian or USA summer. For all the indexes, the temporal series is analyzed for both the VEG run and the difference between the runs, as defined in section 3.2, that is indicated with the ∆-symbol. The time variation and standard deviation are obtained averaging the variables over the land in D04. It is important to notice, from Figures 9-11, that all indexes show a positive variation with the increase of the tree cover. Comparing both T2 (Figure 5, left) and AT time series for the simulated period, it is observed that there is a general decrease of the perceived temperature during night-time and an increase during the day. Moreover, the Reforestation Policy aggravates this feature, as it is observed in Figure 9 on the right. The magnitude of the differences (∆AT, defined as for T2 in Section 3.2) between the runs has always the same daily cycle, with an increase of the peaks, as well as of the spread, during the simulation period. The last day of the simulation however shows a different behavior, most likely due to the establishment of sparse precipitation in the southern counties not observed by the stations. This could be due to both model misrepresentation of stratiform precipitation so that the hourly amount is below the minimum resolution of the stations.
14
1 2 3 4 5 6 7 8 9 10 11 12 13 14 15 16 17 18 19 20 21 22 23 24 25 26 27 28 29 30 31 32 33 34 35 36 37 38 39 40 41 42 43 44 45 46 47 48 49 50 51 52 53 54 55 56 57 58 59 60 61 62 63 64 65
Arianna Valmassoi et al.
Fig. 10 Temporal series of the HIN WV EG averaged over the land, on the left, and the difference between the run, on the right.
Fig. 11 Temporal series of the HIV EG averaged over the land, on the left, and the difference between the run, on the right.
HINW values for D04 is always below the “caution” level for the vegetation run, but it is important to notice that ∆HIN W shows a strong daily cycle (Figure 13, right). Even though the variation caused by the increase in tree cover is low, is enough to get closer to the threshold. As for AT, HINW shows differences between night and day time as high as 10. This helps to reduce the heat stress during nighttime that in warm climate country cause high distress[62]. However, HINW has a lower spatial standard deviation (around 0.15o C) if compared to AT(around 0.2o C), in particular in time series of the differences. This could be due to the wind component in the AT, which is usually one of the difficult atmospheric parameters to reproduce in a mesoscale model due to its multi-scale feature. ∆HIWN maxima (0.28o on average) are lower than ∆AT ones (0.39o on average), which means that wind is playing an important role in the human heat comfort modification. HI is the only index that in some areas reach the threshold value for “some discomfort”. HI shows a high standard variation in the spatial distribution. This feature may be attributed to the calculation of the vapor pressure starting from the relative humidity. Moreover, it is the less affected by the change in vegetation during the hottest hours of the day, as can be seen in the Figures 9-10. On the other hand, while ∆HI during night-time on average is not affected, there is a high standard deviation which causes a decrease of the index.
Future Impacts of the Reforestation Policy
1 2 3 4 5 6 7 8 9 10 11 12 13 14 15 16 17 18 19 20 21 22 23 24 25 26 27 28 29 30 31 32 33 34 35 36 37 38 39 40 41 42 43 44 45 46 47 48 49 50 51 52 53 54 55 56 57 58 59 60 61 62 63 64 65
15
Fig. 12 Spatial distribution of AT during the hottest hours of the day (averaged from 12 UTC to 15 UTC), on the left, and the difference between the run, on the right.
In general, all the indexes show the maxima in the ∆-values at least an hour before the maxima of ∆T2. This could be caused by the different response of the relative humidity and wind to the change in vegetation. However, since most of the indexes are the threshold-type, it is important to investigate the spatial pattern suggested by the high standard deviation in all the figures. In particular, the most important part of the day is when there is the maxima in the indexes because it may lead to the triggering of the threshold values. In particular, the hours to average are from 12 UTC to 15 UTC due to the steep variation observed before and after this time frame. In general, all the changes in indexes spatial features show a good agreement with the change in land-use. In particular, in all spatial distributions of ∆values the maxima are in areas at lower values during the CTR run. This could imply a spreading and increasing of the heat stress across the country, Even though it never trigger the thresholds. In Figure 12, AT shows a band feature that is not observed in the other indexes, which most likely is caused by the wind component. In particular, the maxima of ∆AT is situated in the middle northern areas, like ∆THIC shown in the previous section. The maxima of the south-western area are not influenced much by the change in vegetation. HINW shows similar spatial distribution to the other indexes, with the maxima in the south-western regions. However, ∆HINW shows less spatial variation than the other indexes, which also reflect additional changes in the land-use. In fact, it is clear the spatial correspondence of the maxima with the higher density of vegetation pixel in Connaught Province. Figure 14 shows HI spatial features. In particular, it shows the “caution” threshold observed over most of the south-wester region, a highly inhabited region[44]. Even though this area does not shows the maxima in the ∆HI, it is enough to trigger the threshold.
16
1 2 3 4 5 6 7 8 9 10 11 12 13 14 15 16 17 18 19 20 21 22 23 24 25 26 27 28 29 30 31 32 33 34 35 36 37 38 39 40 41 42 43 44 45 46 47 48 49 50 51 52 53 54 55 56 57 58 59 60 61 62 63 64 65
Arianna Valmassoi et al.
Fig. 13 Spatial distribution of HINW during the hottest hours of the day ( averaged from 12 UTC to 15 UTC), on the left, and the difference between the run, on the right.
Fig. 14 Spatial distribution of HI during the hottest hours of the day ( averaged from 12 UTC to 15 UTC), on the left, and the difference between the run, on the right.
4 Conclusions This work aims to assess, through the numerical weather prediction model WRF (version 3.7), the effect of the Irish Reforestation policy on the atmosphere and climate parameters as well as the repercussions on both livestock and human beings. A simplified approach is employed by changing MODIS land use. The land characterized as “cropland and vegetative mosaic” is substituted with “evergreen broad-leaf”, which expands the forest cover from 19.7% to 36.2% of the land in the analyzed domain. Proposed changes in land use category reflect the preferred guidelines of the policy, which aims to reforest open areas with native species, which in Ireland can be categorized as broad-leaf trees. However, it is to consider that the study results are limited by the model parametrization of vegetation’s biological cycle as well as the limited number (5 in total for MODIS) of possible categories for forest land use. Even though the percentage of the increase in forest cover does not reflect the overall aim of the policy, it helps to better understand the effect of temperate forest in the contest of mesoscale atmospheric modeling. Within the study limitations, it is found that the increment in vegetation
Future Impacts of the Reforestation Policy
1 2 3 4 5 6 7 8 9 10 11 12 13 14 15 16 17 18 19 20 21 22 23 24 25 26 27 28 29 30 31 32 33 34 35 36 37 38 39 40 41 42 43 44 45 46 47 48 49 50 51 52 53 54 55 56 57 58 59 60 61 62 63 64 65
17
cover, as evergreen broad leaf forest, over Ireland is likely to cause an overall increase by up to 0.7o in air temperature at 2 meter. This feature is observed all over the simulated domain, even in areas without change in land use, and mostly zero variation over the ocean. The temperature difference between the two runs shows a strong daily cycle, with a more pronounced influence during the late morning. The thermal heat comfort for the livestock is simulated as part of this study. This index shows high peak values with a strong daily cycle that resembles the temperature one. As for the temperature, the THIC has the maximum differences during the late morning but also midday. Moreover, during the peak temperature, it is possible to observe an overall increase in the heat discomfort in the whole domain, with different magnitude. The human comfort indexes show similar behavior to the livestock one, with different magnitude and spatial feature based on the weather parameters that are accounted for. In particular, it is observed an increase of all the indexes with the magnitude related to mainly to the land use changes. It should be highlighted that even areas that are distant from land use changes are subject to an increase in all the comfort indexes. The evidences from this study suggest that an increment in the vegetation cover would lead to an increase in both the surface temperature and enhance livestock and human heat discomfort during the summer season. An implication of these findings is that land use impact on climate should be considered more closely in the policy making process. In fact, while the reforestation will increase CO2 extraction from the atmosphere, it will add to the global increase trend a local increment of air temperature. This local increase in temperature, within the study limitations, has the same magnitude of the projected change, for Ireland, as in the latest IPCC report. This aspect needs to be looked at, especially in consideration of its influence on thermal comfort of both human and livestock. The observed temperature increase in the past decades due to anthropogenic influence will continue and escalates in future scenarios. Actions and protocols are made to mitigate the GHG emissions. However, their consequences have not been examined by policy makers against their impacts on climate, which as showed here with a simplified approach, may lead to undesired side effects. Further research is needed to be done to establish the magnitude of the increase in those parameters caused by the vegetation and change in land use and land-cover caused by the application of the Irish Reforestation policy. Moreover, the THIC index should be investigated for its representativeness in cattle and sheep herds at high latitude conditions.
Acknowledgements This project has received funding from the European Unions Horizon 2020 research and innovation programme under grant agreement No 689954. This paper reflects the authors’ views. The European Commission is not liable for any use that may be made of the information contained therein.
18
1 2 3 4 5 6 7 8 9 10 11 12 13 14 15 16 17 18 19 20 21 22 23 24 25 26 27 28 29 30 31 32 33 34 35 36 37 38 39 40 41 42 43 44 45 46 47 48 49 50 51 52 53 54 55 56 57 58 59 60 61 62 63 64 65
Arianna Valmassoi et al.
References 1. B. Kirtman, S.B. Power, J.A. Adedoyin, G.J. Boer, R. Bojariu, I. Camilloni, F.J. DoblasReyes, A.M. Fiore, M. Kimoto, G.A. Meehl, M. Prather, A. Sarr, C. Sch¨ ar, R. Sutton, G.J. van Oldenborgh, G. Vecchi, H.J. Wang, Climate Change 2013 - The Physical Science Basis pp. 953–1028 (2013). DOI 10.1017/CBO9781107415324.023 2. Department of Agriculture Food and Marine, Forestry Programme 2014 2020 : Ireland. Tech. Rep. July, Department of Agriculture,Food and Marine, Ireland (2015) 3. DAFM, National Sheep and Goat Census. Tech. Rep. December, Department of Agriculture,Food and Marine, Ireland (2014) 4. R.A. McPherson, Progress in Physical Geography 31(3), 261 (2007). DOI 10.1177/0309133307079055 5. G.B. Bonan, Science 320(5882), 1444 (2008). DOI 10.1126/science.1155121. URL http://www.sciencemag.org/cgi/doi/10.1126/science.1155121 6. J.A. Foley, Science 309(5734), 570 (2005). DOI 10.1126/science.1111772. URL http://www.sciencemag.org/cgi/doi/10.1126/science.1111772 7. K.W. Oleson, G.B. Bonan, S. Levis, M. Vertenstein, Climate Dynamics 23(2), 117 (2004). DOI 10.1007/s00382-004-0426-9. URL http://link.springer.com/10.1007/s00382-004-0426-9 8. R. Betts, Atmospheric Science Letters 2(1-4), 39 (2001). DOI 10.1006/asle.2001.0023. URL http://doi.wiley.com/10.1006/asle.2001.0023 9. A.J. Teuling, S.I. Seneviratne, R. St¨ ockli, M. Reichstein, E. Moors, P. Ciais, S. Luyssaert, B. van den Hurk, C. Ammann, C. Bernhofer, E. Dellwik, D. Gianelle, B. Gielen, T. Gr¨ unwald, K. Klumpp, L. Montagnani, C. Moureaux, M. Sottocornola, G. Wohlfahrt, Nature Geoscience 3(10), 722 (2010). DOI 10.1038/ngeo950. URL http://www.nature.com/doifinder/10.1038/ngeo950 10. T. Loveland, R. Mahmood, T. Patel-Weynand, K. Karstensen, K. Beckendorf, N. Bliss, A. Carleton, Open-File, National climate assessment technical report on the impacts of climate and land use and land cover change. Tech. rep. (2012). URL https://adapt.nd.edu/resources/1040/download/of2012-1155.pdf 11. W.R. Sutton, R.I. Block, Adaptation to Climate Change in Europe and Central Asia Agriculture. Tech. rep. (2015) 12. J.E. Olesen, Danish Institute of Agricultural Sciences (2005) 13. M.L. Parry, C. Rosenzweig, A. Iglesias, M. Livermore, G. Fischer, Global Environmental Change 14(1), 53 (2004). DOI 10.1016/j.gloenvcha.2003.10.008 14. S.S. Gharbia, S.A. Alfatah, L. Gill, P. Johnston, F. Pilla, Modeling Earth Systems and Environment 2(3), 151 (2016). DOI 10.1007/s40808-016-0210-y. URL http://link.springer.com/10.1007/s40808-016-0210-y 15. S. Luyssaert, M. Jammet, P.C. Stoy, S. Estel, J. Pongratz, E. Ceschia, G. Churkina, A. Don, K. Erb, M. Ferlicoq, B. Gielen, T. Gr¨ unwald, R.A. Houghton, K. Klumpp, A. Knohl, T. Kolb, T. Kuemmerle, T. Laurila, A. Lohila, D. Loustau, M.J. McGrath, P. Meyfroidt, E.J. Moors, K. Naudts, K. Novick, J. Otto, K. Pilegaard, C.A. Pio, S. Rambal, C. Rebmann, J. Ryder, A.E. Suyker, A. Varlagin, M. Wattenbach, A.J. Dolman, Nature Climate Change 4(5), 389 (2014). DOI 10.1038/nclimate2196. URL http://www.nature.com/articles/nclimate2196 16. L.M. Kueppers, M.A. Snyder, L.C. Sloan, Geophysical Research Letters 34(3), L03703 (2007). DOI 10.1029/2006GL028679 17. A. Valmassoi, S. Gharbia, S. Stibe, S. Di Sabatino, F. Pilla, Procedia Computer Science 109, 367 (2017). DOI 10.1016/j.procs.2017.05.403. URL https://authors.elsevier.com/tracking/article/details.do?aid=10995&jid=PROCS&surname=Valmassoi http://linkinghub.elsevier.com/retrieve/pii/S1877050917310785 https://www.sciencedirect.com/science/article/pii/S1877050917310785?via%3Dihub 18. K. Naudts, Y. Chen, M.J. McGrath, J. Ryder, A. Valade, J. Otto, S. Luyssaert, Science 351(6273), 597 (2016). DOI 10.1126/science.aad7270. URL http://www.ncbi.nlm.nih.gov/pubmed/26912701 19. E.A. Burakowski, S.V. Ollinger, G.B. Bonan, C.P. Wake, J.E. Dibb, D.Y. Hollinger, Journal of Climate 29(14), 5141 (2016). DOI 10.1175/JCLI-D-15-0286.1. URL https://www.fs.fed.us/nrs/pubs/jrnl/2016/nrs 2016 burakowski 001.pdf
Future Impacts of the Reforestation Policy
1 2 3 4 5 6 7 8 9 10 11 12 13 14 15 16 17 18 19 20 21 22 23 24 25 26 27 28 29 30 31 32 33 34 35 36 37 38 39 40 41 42 43 44 45 46 47 48 49 50 51 52 53 54 55 56 57 58 59 60 61 62 63 64 65
19
20. J.R. Porter, L. Xie, A.J. Challinor, K. Cochrane, S.M. Howden, M.M. Iqbal, D.B. Lobell, M.I. Travasso, in Population and Development Review, vol. 35 (Cambridge University Press, 2009), pp. 837–839. DOI 10.1111/j.1728-4457.2009.00312.x 21. E. Wall, A. Wreford, K. Topp, D. Moran, Advances in Animal Biosciences 1(01), 53 (2010). DOI 10.1017/S2040470010001962. URL http://www.journals.cambridge.org/abstract S2040470010001962 22. P.K. Thornton, P.J. Ericksen, M. Herrero, A.J. Challinor, Global Change Biology 20(11), 3313 (2014). DOI 10.1111/gcb.12581 23. D. Mitchell, C. Heaviside, S. Vardoulakis, C. Huntingford, G. Masato, B. P Guillod, P. Frumhoff, A. Bowery, D. Wallom, M. Allen, Environmental Research Letters 11(7), 074006 (2016). DOI 10.1088/1748-9326/11/7/074006. URL http://stacks.iop.org/17489326/11/i=7/a=074006?key=crossref.6e5075a68a4ec09357b8e361a9871511 24. M. Baccini, A. Biggeri, G. Accetta, T. Kosatsky, K. Katsouyanni, A. Analitis, H.R. Anderson, L. Bisanti, D. DIppoliti, J. Danova, B. Forsberg, S. Medina, A. Paldy, D. Rabczenko, C. Schindler, P. Michelozzi, Epidemiology 19(5), 711 (2008). DOI 10.1097/EDE.0b013e318176bfcd 25. J.A. Patz, D. Campbell-Lendrum, T. Holloway, J.A. Foley, Nature 438(7066), 310 (2005). DOI 10.1038/nature04188. URL http://www.nature.com/doifinder/10.1038/nature04188 26. K. Guirguis, A. Gershunov, A. Tardy, R. Basu, Journal of Applied Meteorology and Climatology 53(1), 3 (2014). DOI 10.1175/JAMC-D-13-0130.1. URL http://journals.ametsoc.org/doi/abs/10.1175/JAMC-D-13-0130.1 27. Eurostat, Agricultural products. (2013). DOI 10.2785/45595. URL http://epp.eurostat.ec.europa.eu/cache/ITY OFFPUB/KS-FK-13-001/EN/KS-FK13-001-EN.PDF 28. A.G. Barnett, S. Tong, A.C. Clements, Environmental Research 110(6), 604 (2010). DOI 10.1016/j.envres.2010.05.006. URL http://linkinghub.elsevier.com/retrieve/pii/S0013935110000733 29. D. Lowe, K.L. Ebi, B. Forsberg, International Journal of Environmental Research and Public Health 8(12), 4623 (2011). DOI 10.3390/ijerph8124623. URL http://www.ncbi.nlm.nih.gov/pubmed/22408593 http://www.pubmedcentral.nih.gov/articlerender.fcgi?artid=PMC3290979 30. G. Luber, M. McGeehin, American Journal of Preventive Medicine 35(5), 429 (2008). DOI 10.1016/j.amepre.2008.08.021. URL http://www.ncbi.nlm.nih.gov/pubmed/18929969 31. J.M. Robine, S.L.K. Cheung, S. Le Roy, H. Van Oyen, C. Griffiths, J.P. Michel, F.R. Herrmann, Comptes Rendus - Biologies 331(2), 171 (2008). DOI 10.1016/j.crvi.2007.12.001. URL http://www.ncbi.nlm.nih.gov/pubmed/18241810 32. R. Basu, J.M. Samet. Relation between elevated ambient temperature and mortality: A review of the epidemiologic evidence (2002). DOI 10.1093/epirev/mxf007. URL http://www.ncbi.nlm.nih.gov/pubmed/12762092 33. R.D. Peng, J.F. Bobb, C. Tebaldi, L. McDaniel, M.L. Bell, F. Dominici, Environmental Health Perspectives 119(5), 701 (2011). DOI 10.1289/ehp.1002430 34. C. Mora, B. Dousset, I.R. Caldwell, F.E. Powell, R.C. Geronimo, C.R. Bielecki, C.W.W. Counsell, B.S. Dietrich, E.T. Johnston, L.V. Louis, M.P. Lucas, M.M. McKenzie, A.G. Shea, H. Tseng, T.W. Giambelluca, L.R. Leon, E. Hawkins, C. Trauernicht, Nature Climate Change 7(7), 501 (2017). DOI 10.1038/nclimate3322. URL http://www.nature.com/doifinder/10.1038/nclimate3322 35. S.C. Sherwood, M. Huber, Proceedings of the National Academy of Sciences 107(21), 9552 (2010). DOI 10.1073/pnas.0913352107. URL http://www.pnas.org/cgi/doi/10.1073/pnas.0913352107 36. D. D’Ippoliti, P. Michelozzi, C. Marino, F. De’Donato, B. Menne, K. Katsouyanni, U. Kirchmayer, A. Analitis, M. Medina-Ram´ on, A. Paldy, R. Atkinson, S. Kovats, L. Bisanti, A. Schneider, A. Lefranc, C. I˜ niguez, C.A. Perucci, Environmental health : a global access science source 9(1), 37 (2010). DOI 10.1186/1476-069X-9-37. URL http://www.ehjournal.net/content/9/1/37 37. R. Edwards, B.M. Miema, R. Henry, R.M. Watters, Ireland’s Forestry Programme 2014-2020 Strategic Environmental Assessment (SEA) Non-Technical Summary. Tech. rep. (2014). URL
20
1 2 3 4 5 6 7 8 9 10 11 12 13 14 15 16 17 18 19 20 21 22 23 24 25 26 27 28 29 30 31 32 33 34 35 36 37 38 39 40 41 42 43 44 45 46 47 48 49 50 51 52 53 54 55 56 57 58 59 60 61 62 63 64 65
38. 39. 40. 41. 42. 43. 44. 45. 46.
47. 48.
49. 50.
51. 52.
53. 54. 55. 56. 57. 58.
59. 60. 61.
Arianna Valmassoi et al. https://www.agriculture.gov.ie/media/migration/forestry/forestryprogramme20142020/ForestryProgramme20142020NonTechnicalSummary230215.pdf Department of Agriculture Food and the Marine, Afforestation Grant and Premium Scheme. Tech. rep. (2015) F. Department of Agriculture, the Marine, Felling and Reforestation Policy. Tech. rep. (2017). URL www.agriculture.gov.ie/forestservice Environmental Protection Agency, Ireland’s Climate Strategy to 2020 and beyond. Tech. Rep. July (2012) F. Department Agriculture, the Marine, AIM Statistics Report 2013 1. Tech. rep., Department of Agriculture,Food and Marine, Ireland (2013) CentralStatisticsOffice, CSO statistical release Livestock Survey December. Tech. rep. (2014) D. Pascual Serrano, C. Vera Pasamontes, R. Gir´ on Moreno, Modelos animales de dolor neurop´ atico. Tech. Rep. 2 (2016). DOI 10.1017/CBO9781107415324.004 CSO, Profile 1- Town and Country. April (2012) C. O’ Dowd, M. Coleman, D. Martin, Air Pollution and Climate Change Interactions. Tech. rep. (2013) S.S. Gharbia, L. Gill, P. Johnston, F. Pilla, Modeling Earth Systems and Environment 2(2), 102 (2016). DOI 10.1007/s40808-016-0154-2. URL http://link.springer.com/10.1007/s40808-016-0154-2 M.R. Haylock, N. Hofstra, A.M.G. Klein Tank, E.J. Klok, P.D. Jones, M. New, Journal of Geophysical Research Atmospheres 113(20) (2008). DOI 10.1029/2008JD010201 O. Baddour, World Meteorological Organization Commission for Climatology Management Group Meeting Climate Normals. Tech. Rep. October, World Meteorological Organization WMO (2011). URL http://www.wmo.int/pages/prog/wcp/ccl/mg/documents/mg2011/CCl-MG-2011Doc 10 climatenormals1.pdf W. Skamarock, J. Klemp, J. Dudhi, D. Gill, D. Barker, M. Duda, X.Y. Huang, W. Wang, J. Powers, Technical Report (June), 113 (2008). DOI 10.5065/D6DZ069T U.D.o.C. National Centers for Environmental Prediction, National Weather Service, NOAA. NCEP FNL Operational Model Global Tropospheric Analyses, continuing from July 1999 (2000). URL https://doi.org/10.5065/D6M043C6 S.Y. Hong, Y. Noh, J. Dudhia, Monthly Weather Review 134(9), 2318 (2006). DOI 10.1175/MWR3199.1. URL http://journals.ametsoc.org/doi/abs/10.1175/MWR3199.1 F. Chen, J. Dudhia, Monthly Weather Review 129(4), 587 (2001). DOI 10.1175/1520-0493(2001)129¡0587:CAALSH¿2.0.CO;2. URL http://journals.ametsoc.org/doi/abs/10.1175/15200493%282001%29129%3C0587%3ACAALSH%3E2.0.CO%3B2 D. Potere, A. Schneider, S. Angel, D. Civco, International Journal of Remote Sensing 30(24), 6531 (2009). DOI 10.1080/01431160903121134 D. Li, E. Bou-Zeid, M. Barlage, F. Chen, J.A. Smith, Journal of Geophysical Research Atmospheres 118(21), 11918 (2013). DOI 10.1002/2013JD020657 J. Devaney, B. Barrett, F. Barrett, J. Redmond, J. O’Halloran, PLoS ONE 10(8), 1 (2015). DOI 10.1371/journal.pone.0133583 Forest Service, The Second National Forest Inventory Republic of Ireland Main Findings (2013) P. Perrin, J. Martin, S. Barron, F. O’Neil, K. McNutt, A. Delaney, National survey of native woodland in Ireland. Tech. rep., NPWS, Ireland (2008) R.A. McPherson, D.J. Stensrud, Monthly Weather Review 133(8), 2178 (2005). DOI 10.1175/MWR2968.1. URL http://journals.ametsoc.org/doi/abs/10.1175/MWR2968.1 http://journals.ametsoc.org/doi/pdf/10.1175/MWR2968.1 MetEireann. Weather Observing Network. URL http://www.met.ie/about/weatherobservingstations/ M. Garc´ıa-D´ıez, J. Fern´ andez, L. Fita, C. Yag¨ ue, Quarterly Journal of the Royal Meteorological Society 139(671), 501 (2013). DOI 10.1002/qj.1976 J.R. Buzan, K. Oleson, M. Huber, Geoscientific Model Development 8(2), 151 (2015). DOI 10.5194/gmd-8-151-2015
Future Impacts of the Reforestation Policy
1 2 3 4 5 6 7 8 9 10 11 12 13 14 15 16 17 18 19 20 21 22 23 24 25 26 27 28 29 30 31 32 33 34 35 36 37 38 39 40 41 42 43 44 45 46 47 48 49 50 51 52 53 54 55 56 57 58 59 60 61 62 63 64 65
21
62. M.V. Guarino, A. Martilli, S. Di Sabatino, L.S. Leo, Volume 1D, Symposia: Transport Phenomena in Mixing; Turbulent Flows; Urban Fluid Mechanics; Fluid Dynamic Behavior of Complex Particles; Analysis of Elementary Processes in Dispersed Multiphase Flows; Multiphase Flow With Heat/Mass Transfer in Process Tec 1D, V01DT28A006 (2014). DOI 10.1115/FEDSM2014-21572 63. R.G. Steadman. Norms of apparent temperature in Australia (1994)
Signed form
Click here to download Authorship change form Authorizform.pdf