ISSN:2229-6093 G Sathish et al ,Int.J.Computer Technology & Applications,Vol 3 (1), 383-391
Personal Authentication System using Hand Vein Biometric G. Sathish*1
Dr. S.V. Saravanan2
Research Scholar, Anna University of Technology, Coimbatore Email :
[email protected] *Corresponding author
Principal, Christ the King Engineering College Coimbatore – 641104. Email :
[email protected]
Dr. S. Narmadha3
Dr. S. Uma Maheswari4
Professor and Head, Dept. of Information Technology, Hindusthan Institute of Technology, Coimbatore - 641032. Email :
[email protected]
Associate Professor, Dept. of ECE Coimbatore Institute of Technology, Coimbatore – 641014. Email :
[email protected]
Abstract With an increasing emphasis on security, automated personal identification using hand vein biometric feature is becoming a very active topic in both research and practical applications. The objective of this work is to present a biometric authentication system for high security physical access control based on hand vein pattern. Hand vein biometric is selected, as it is foolproof, offers higher security and reliable for identification. The feature extraction stage consists of removal of the noise inherent using various filtering techniques and extraction of the most discriminating information present in the images using Discrete Wavelet Transform and Adaptive Thresholding techniques. The proposed recognition system makes use of hausdorff distance as matching parameter. The biometric system developed was tested on WASET hand vein image database of Chinese Academy of Sciences Institute of Automation is used and the system is implemented in MATLAB. The proposed approach found to report higher verification accuracy of 99.5%. Keywords- Hand vein, Discrete Wavelet Transform, Filtering, Adaptive Thresholding, Hausdorff Distance, WASET
1. Introduction Recently, security in many situations is receiving more attention because of increase of crime rate aided with latest technology which has pressed researchers to
IJCTA | JAN-FEB 2012 Available
[email protected]
scrutinize for better security provisions. Security has been important in the view of privacy protection with the advance of internet technology. Traditional personal verification methods such as passwords, personal identification numbers (PINS), magnetic swipe cards, keys and smart cards offer very limited security and are unreliable. Consequently, biometrics which involves the analysis of human biological, physical and behavioural characteristics has been developed to ensure more reliable security. Compared to traditional methods, biometric features are harder for intruders to copy and forge. Biometric individual authentication is used in many fields as an approach for security. Biometrics is the technique of verifying a person's identity from a physical characteristic (e.g. fingerprint, handprint, face, scent, thermal image, or iris pattern), or personal trait (e.g. voice pattern, handwriting, or acoustic signature). Biometric identification may be preferred over traditional methods (e.g. passwords, smart-cards) because its information is virtually impossible to steal. Hand vein recognition has more advantages compared to other biometric feature authentication technology such as fingerprint, iris, face, and so on. The advantages of this recognition are as follows: [1]. Live Body Identification: The hand vein biometric feature authentication system acquires a vein image which can be taken only at live body, thus the vein image at non-live hand cannot be read and taken, and accordingly no identification and authentication can be made. Therefore, no falsification can be done.
383
ISSN:2229-6093 G Sathish et al ,Int.J.Computer Technology & Applications,Vol 3 (1), 383-391
[2]. Internal Features: The hand vein biometric feature authentication system extracts the vein pattern inside a hand rather than the outside features of a hand for authenticating that person. So there are no barriers for identification and verification from the damnification, wear and tear, the dry and the wet of hand surface. [3]. Non-Contact: When the hand vein biometric feature authentication system extracts the vein pattern, the hand is not in contact with the device instead hand is just easily stretched and the capturing of vein pattern is completed. Due to non-contact, it is hygienic and nonduplicating and has no negative image associated with crime. [4]. High Security: Since the system has got the three features: live body, internal features and non-contact, there is no falsification, no barrier for identification and no misuse by evil-doers, thus it holds high security grade and can be used at high level security places
2. Literature Review Research work on hand vein patterns are mostly carried out on the palmer part, the dorsal part and on finger veins. Vein patterns in the palmer region are made use of by Malki et al. [1]. They have opted cellular neural networks for feature extraction and reported 99.5% authentication by direct image comparison. However, the results are not projected in terms of false detection error rates. Thermal vein patterns in the dorsal part [2,3,4] of the hand are extensively studied by Wang et al. [3,5,6]. Their lucid presentation on FIR (Far Infra Red) and NIR (Near Infra Red) imaging methods to capture vein patterns is illuminating. Using Hausdorff distance for matching, they have shown 0% FAR (False Acceptance rate) and FRR (False Rejection Rate) with a suitable threshold. However their experiments are carried out on very small database (only 30 users) thus creating doubts on their validity to large datasets. Lin et al. [7] have applied multi-resolution filters that extract dominant points by filtering out the miscellaneous features from vein patterns in the hand dorsa. However, their experimental results indicate a FAR up to 2.3 % which is considered higher than usually permissible percentages. Miura et al. [8] are concerned with the finger vein patterns and irregular shading produced by thickness of finger bones and muscles using line tracking operations with randomly varied start points and achieved equal error rates of 0.145%. An artificial immune system is developed by Shimooka and Shimizu [9] based on finger vein patterns. They introduce ordinal matching and distribution of bound antibody based strategies for pattern classification. However, the experimental
IJCTA | JAN-FEB 2012 Available
[email protected]
results demonstrated on small datasets do not meet the specifications.
3. Hand Vein Recognition System The flow of the proposed system is detailed in the flowchart shown in Figure 2. Input Image taken from WASET database
Contrast Stretching
2D Wavelet Transform
Filtering Median Filtering
Image Storage
Lowpass Filtering
Highpass Filtering
Adaptive Thresholding
Hausdorff Distance Calculation Figure 1. Flowchart of the Proposed System The proposed hand vein recognition system is composed of three main stages.
3.1 Preprocessing Stage This stage includes improving the contrast of the input image by normalizing it in order to extract the most discriminating features of the hand vein. The technique used for normalization in this work is contrast stretching. Contrast stretching fixes upper and lower limits depending upon the intensity of the pixels in the image and performs darkening or brightening of the pixels within these limits while retaining the pixel values outside the limits. a) Image Normalization The proportion of the vein area varies most of the time and for convenience dimension size
384
ISSN:2229-6093 G Sathish et al ,Int.J.Computer Technology & Applications,Vol 3 (1), 383-391
normalization is done. The vein image is defined as 256×256.
vein pattern in the image and thus to find whether the two hand vein images are same or not.
b) Vein Extraction
4. Experimentation Results
The quality of images taken by the infrared collector is low. So, the image segmentation takes up a very important position in the whole process of hand vein recognition. Though there are many image segmentation methods, among them the classics are threshold method, region growing method, relaxation method, edge detection method, division and combination method. An image segmentation method is adopted chiefly as it is a local dynamic threshold method simple and effective. The principle behind the method is that first the mean and variance of the points in r×r neighborhood of every point is calculated, then binarization is performed.
The proposed system acquires the input hand vein image from the disk and based on the choice provided by the user, decides whether to compress the image for disk storage or to compare the image with the templates stored in the database after performing preprocessing and feature extraction on them.
c)
Getting Rid of Noises of Binary Image
Noises are wiped off according to their size. Then the area sizes of the black and white backgrounds are calculated. If the area size of the background is smaller than the given size, this block is considered as noise and is erased.
Figure 2. Sample Input Handvein Image taken from WASET Database
d) Image Thinning The Image thinning consists of extracting a single pixel wide framework for keeping the topological structure of the original image intact. The vein image is thinned using the combination method of general conditional thinning and templates.
3.2 Feature Extraction Stage It consists of extraction of features from the preprocessed hand vein image and also includes various filtering techniques to remove the inherent noises from the image and Discrete Wavelet Transform (DWT) to reduce the size of the image so as to store the image in the database using lesser space. Different types of noise like Gaussian noise, normal noise, Rayleigh noise, impulse noise may exist in an image acquired using an infrared scanner. These are removed in this system using Median filter, Gaussian filter and Spatial Lowpass and Highpass filters. Additionally, the feature extraction stage also makes use of Adaptive Thresholding to extract the vein patterns alone from the image.
3.3 Recognition Stage Finally, the features of the hand vein pattern of the input image are compared with those of all patterns in the database. It makes use of Hausdorff distance [10] to find the length of the whole hand
IJCTA | JAN-FEB 2012 Available
[email protected]
If the user wants compression to be performed, the system uses a 2-Dimensional Discrete Wavelet Transform (2D DWT) for performing n-level compression on the image. After wavelet processing, the template obtained is written to disk.
4.1. Contrast Stretching If the user‟s choice is comparison, some form of normalization should be done beforehand in order to provide „better‟ input for automated image processing and realize a robust system against fluctuation. Conventional pre-processing technique of contrast stretching which darkens pixels in between two pre-assigned ranges while retaining all other information is used for this purpose. The image obtained after contrast stretching is shown in figure 3. Contrast stretching (often called normalization) is a simple image enhancement technique that attempts to improve the contrast in an image by „stretching‟ the range of intensity values it contains to span a desired range of values, e.g., the full range of pixel values that the image type concerned allows. It differs from the more sophisticated histogram equalization in that it can only apply a linear scaling function to the image pixel values. As a result the „enhancement‟ is less harsh. Most implementations accept a gray level image as input and produce another gray level image as output.
385
ISSN:2229-6093 G Sathish et al ,Int.J.Computer Technology & Applications,Vol 3 (1), 383-391
Before the stretching can be performed it is necessary to specify the upper and lower pixel value limits over which the image is to be normalized. Often these limits will just be the minimum and maximum pixel values based on the image type. For example, 8-bit gray level images have the lower and upper limits „0‟ and „255‟. The lower and the upper limits can be represented as „a‟ and „b‟ respectively. The simplest sort of normalization then scans the image to find the lowest and highest pixel values currently present in the image which are represented as „c‟ and „d‟. Then each pixel P is scaled using the following function: Pout = (Pin - c) ((b – a) / (d - c)) + a (1) Values in between 1 and 2 are set to „255‟ and the values below 1 and above 2 are retained.
4.2 Filtering Techniques i)
Lowpass Spatial Filtering This is a type of smoothing filter used for blurring. Blurring is used in preprocessing steps, such as removal of small details from an image prior to object extraction, and bridging of small gaps in lines or curves. Noise reduction can be accomplished by blurring with a linear filter and also by nonlinear filtering. The filter used for lowpass (smoothing) spatial filtering would have all positive coefficients. For the creation of positive coefficients, the simplest arrangement would be a mask in which all coefficients have a value of 1. The impulse response would then be the sum of gray levels of all pixels divided by the number of pixels, i.e., the response would be the average of all the pixels in the area of the mask, the use of masks for smoothing is called neighbourhood averaging. ii)
Figure 3. Contrast Stretching
Figure 4. Image Skewing
Figure 5. Image Slicing
IJCTA | JAN-FEB 2012 Available
[email protected]
Median Filtering Smoothing filters can be used for noise reduction, in addition to blurring. If the objective is to achieve noise reduction rather than blurring, an alternative approach is to use median filers. That is, the gray level of each pixel is replaced by the median of the gray levels in a neighbourhood of that pixel, instead of by the average. This method is particularly effective when the noise pattern consists of strong, spikeless components and the characteristic to be preserved is edge sharpness. Median filters are nonlinear in nature. In order to perform median filtering in a neighbourhood of a pixel, sort the values of the pixel and its neighbours, determine the median and assign this value to the pixel. Thus, the principal function of the median filtering is to force points with distinct intensities to be more like their neighbours, actually eliminating intensity spikes that appear isolated in the area of the filter mask. iii) High Pass Spatial Filtering This is a type of sharpening filter used in the frequency domain. The principal objective of sharpening is to highlight fine detail in an image or to enhance detail that has been blurred, either in error or as a natural effect of a particular method of image acquisition. Uses of image sharpening vary and include ranging from electronic printing and medical imaging to industrial inspection and autonomous target detection in smart weapons. The filter used for highpass (sharpening) spatial filtering would have positive coefficients near its centre and negative coefficients in the outer periphery. For this, choosing a positive value in the centre location with negative coefficients in the rest of the mask meets this condition. In a sharpening filter, the sum of the coefficients is 0. Thus when the mask is over an area of constant or slowly varying gray level, the output of the mask is zero or negligible value. This filter eliminates the zero-
386
ISSN:2229-6093 G Sathish et al ,Int.J.Computer Technology & Applications,Vol 3 (1), 383-391
frequency term, thereby reducing the average graylevel value in the image to zero, reducing significantly the global contrast of the image. The original image consists of fairly fine detail over a significant portion of slowly varying background levels. The result is characterized by somewhat enhanced edges over a rather dark background. Reducing the average value of an image to zero implies that the image must have some negative gray levels. The results of highpass filtering involve some form of scaling and/or clipping. Taking the absolute value of the filtered image to make all values positive is not preferred, because large negative values would appear brightly in the image.
Figure 9. Highpass Filtering The different types of noise that may exist in an acquired image are removed in this system without affecting vein pattern regions. Impulse and normal noise are some of the unwanted data in the image that are removed using appropriate filters. Spatial Lowpass, Median filter and Highpass filters are assigned the function of noise removal. The noise removal from the input hand vein images are shown in Figures 6,7,8 and 9 respectively. 4.3 Wavelet Transform
Figure 6. 2D Lowpass Filtering
Figure 7. Lowpass Filtering
Figure 8. Median Filtering
IJCTA | JAN-FEB 2012 Available
[email protected]
Wavelet is a waveform of effectively limited duration that has an average value of zero. Wavelets are functions generated from a single function by dilation and translation. The fundamental idea behind wavelets is to analyze according to scale or resolution. Wavelets are mathematical functions that split data into different frequency components, and then study each component with a resolution matched to its scale. They have advantages over traditional Fourier methods in analyzing physical situations where the signal contains discontinuities and sharp spikes. Wavelets were developed independently in the fields of mathematics, quantum physics, electrical engineering and seismic geology. Interchanges between these fields during the last ten years have led to many new wavelet applications such as image compression, turbulence, human vision, radar, acoustical analysis and earthquake prediction. The conventional Fast Fourier Transform (FFT) based image denoising method is essentially a low pass filtering technique in which an edge is not as sharp in the reconstruction as it was in the original. But the localized nature of the wavelet transform both in time and space results in denoising with edge preservation. Wavelet transform is used to represent any arbitrary function as a superposition of wavelets. It is a form of signal analysis where a signal is of discontinuities. Wavelet transform is localised in time and space. It results in denoising with edge preservation.
387
ISSN:2229-6093 G Sathish et al ,Int.J.Computer Technology & Applications,Vol 3 (1), 383-391
Wavelet analysis is the technique which is used to perform local analysis, i.e., to analyse a localised area of a larger signal. Wavelet analysis is the breaking up of a signal into shifted and scaled versions or original (a mother) wavelet, because the signals with sharp changes might be better analysed with an irregular wavelet than with a smooth sinusoid. Local features can be described better with wavelets than sine waves or other waves. Wavelet transforms are of two types - discrete and continuous. A Discrete Wavelet Transform (DWT) is any wavelet transform for which the wavelets are discretely sampled. A key advantage it has over Fourier transforms is temporal resolution: it captures both frequency and location information. The DWT holds promise for use in edge detection. A 2D DWT is used to extract the feature from the hand vein image and produces four sub bands at every stage, each one is 1/4th the size of the input image size to that stage. These four sub bands are denoted HH, HL, LH, and LL with the first letter denoting the filter applied horizontally and the second letter the filter applied vertically (H- Highpass, L-Low-pass). The first two stages of the 2D DWT are shown in Figure 10.
Figure 10. First Two Stages of 2D DWT To obtain next course level of wavelet coefficients, the subband LL1 alone is further decomposed and sampled. Each band will be 1/4th the size of input image size to that image. The input hand vein image obtained after wavelet transform is shown in Figure 11.
Figure 11. Wavelet Transform
IJCTA | JAN-FEB 2012 Available
[email protected]
4.4 Adaptive Thresholding Thresholding is the simplest method of image segmentation. From the gray scale image, thresholding can be used to create binary images. During the thresholding process, individual pixels in an image are marked as „object‟ pixels if their value is greater than some threshold value (assuming an object to be brighter than the background) and as „background‟ pixels otherwise. This convention is known as threshold above. Variants include threshold below, which is opposite of threshold above; threshold inside, where a pixel is labelled „object‟ if its value is between two thresholds; and threshold outside, which is the opposite of threshold inside. Typically, an object pixel is given a value of „1‟ while a background pixel is given a value of „0‟. Finally, a binary image is created by coloring each pixel white or black, depending on a pixel's label. The key parameter in the thresholding process is the choice of the threshold value or values. Several different methods for choosing a threshold exist; users can manually choose a threshold value, or a thresholding algorithm can compute a value automatically, which is known as automatic thresholding. A simple method would be to choose the mean or median value, the rationale being that if the object pixels are brighter than the background, they should also be brighter than the average. In a noiseless image with uniform background and object values, the mean or median will work as accurately as the threshold specified. However this will generally not be the case. A more sophisticated approach might be to create a histogram of the image pixel intensities and use the valley point as the threshold. The histogram approach assumes that there is some average value for the background and object pixels, but that the actual pixel values have some variation around these average values. Thresholding is called adaptive thresholding when a different threshold is used for different regions in the image. This may also be known as local or dynamic thresholding.
Figure 12. Adaptive Thresholding 1
388
ISSN:2229-6093 G Sathish et al ,Int.J.Computer Technology & Applications,Vol 3 (1), 383-391
Figure 13. Adaptive Thresholding 2
Figure 16. Hausdorff Distance Calculation The extracted vein patterns of the input image can directly be compared with the templates. Hausdorff distance defined to calculate the similarity between the template and the input patterns has been adopted as matching algorithm in for this system and the output of the distance calculation is shown in Figure 16.
5. Result Analysis
Figure 14. Adaptive Thresholding 3
Figure 15. Adaptive Thresholding 4
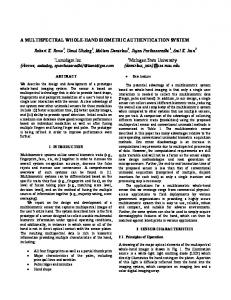
Hausdorff distance was applied to the vein features. A genuine versus imposter distribution chart was used for vein pattern matching to deduce the false acceptance rate (FAR) and the false rejection rate (FRR). False Acceptance Rate refers to the total number of unauthorized persons getting access to the system over the total number of people attempting to use the system. False Rejection Rate refers to the total number of authorized persons not getting access to the system over the total number of people attempting to get access to the system. The y-axis coordinate shows the image number and gives an idea about the total number of hand vein images in the database. The x-axis coordinate plots the hausdorff distance selected as threshold for the particular image.
The vein patterns are extracted after noise reduction and normalization. This extraction is done by the process of adaptive thresholding. The input images after adaptive thresholding are shown in the figures 12,13,14 and 15. 4.5 Hausdorff Distance Hausdorff distance is the maximum distance of a set to the nearest point in the other set. More formally, Hausdorff distance from set A to set B is a max-min function, defined as h (A, B) max maxd(a, b) (2) a A bB where a and b are points of sets A and B respectively and d(a, b) is any metric between these points.
IJCTA | JAN-FEB 2012 Available
[email protected]
Figure 17. Genuine versus Imposter Distribution The distribution chart shown in Figure 17 plots the different threshold values applied to find an optimal value. Values from 1 to 75 were used for this purpose. Imposter vein patterns were falsely assumed to be valid for vein images when the
389
ISSN:2229-6093 G Sathish et al ,Int.J.Computer Technology & Applications,Vol 3 (1), 383-391
threshold was fixed between 32 and 37. Likewise, genuine images were rejected at times when the threshold was fixed between 37 and 42. These ranges give the range of the FAR and FRR respectively. The coincidence of genuine and imposter values occur at 37 and so it was fixed as the threshold for distance calculation using Hausdorff distance. In Table 1 the threshold values for Genuine and Imposter distributions are tabulated. Table 1. Thresholds Distribution Threshold Threshold Image value for value for No. Genuine Imposter Distribution Distribution 5 2 40 10 5 42 15 7 45 20 10 47 25 12 50 30 15 52 35 17 55 40 20 57 38 22 60 33 25 62 28 27 65 23 30 67 18 32 70 13 35 72 8 37 75 Experimental results show that the method is effective and feasible with refusing recognition ratio up to 99.5%.
6. Conclusion and Future Work In this work, a procedure for hand vein feature extraction has been developed based on DWT, Adaptive Thresholding and Filtering techniques. This paper presents a hand vein recognition system tested using hand vein images from WASET (World Academy of Science, Engineering and Technology) database. The similarity between the images is calculated using Hausdorff Distance (HD). It is found from the experiments that the Hausdorff Distance between two hand vein images that belong to the same hands is 37. Based on the experimentation results, it can be concluded that the procedure proposes a reliable and accurate system for hand vein identification. The use of filters produces an uncorrelated and less redundant representation for hand vein texture compared with other techniques. The method achieved correct tracking of features of hand vein images using adaptive thresholding. Moreover, it produces very high identification results that are suitable for methodical search in large databases and access control.
IJCTA | JAN-FEB 2012 Available
[email protected]
Future directions of vein recognition technology include advanced use of hand vein recognition systems for government and military security, justice and law enforcement, healthcare, border control/airports, financial and transactional security. The personal identification technique has been tested only for the WASET database image hence testing more samples of hand vein images could extend the study. Large shareable large databases should be founded for a thorough evaluation on the efficacy of different vein recognition algorithms. Handvein images can be used as biometric watermark for securing digital images on which the authors are currently investigating and have reported improved results [11]. Further, hand vein biometric can be used to watermark images in fusion with other biometric to build a more robust multimodal high secure authentication system.
References [1]. S. Malki and L. Spaanenburg, “Hand Veins Feature Extraction using DT-CNNS”, Proc. SPIE, Vol. 6590, pp. 65900-165900, 2007. [2]. Z. Hong, L. Han, X. Wei, and D. Yingna, “Seal Imprint Verification based on Multi Supplemental Features of Multi-Classifier Fusion Decision”, Department of Computer Engineering and Applications, Harbin Engineering University, Harbin, China, Vol. 34, pp. 215-217, 2004. [3]. A.K. Jain, S. Prabhakar and S. Pankanti, “Online Fingerprint Verification”, IEEE Trans. Pattern Analysis and Machine Intelligence, Vol. 19, pp. 302-314, 2000. [4]. L. Wang and G. Leedham, “A Thermal Hand Vein Pattern Verification System”, Lecture Notes in Computer Science, Vol. 3687, No. 10, pp. 58-65, 2005. [5]. A.K. Jain, A. Ross and S. Prabhakar, “An Introduction to Biometric Recognition”, IEEE Trans. on Circuits and System for Video Technology, Special Issue on Image and VideoBased Biometrics, Vol. 14, No. 1, pp. 4-20, 2004. [6]. L. Wang and G. Leedham, “Near- and FarInfrared Imaging for Vein Pattern Biometrics”, IEEE Int. Conf. on Video Based Surveillance, Sydney, Australia, pp. 52-52, 2006. [7]. C.L. Lin and K.C. Fan, “Biometric verification using Thermal Images of Palm-dorsa Vein Patterns”, IEEE Trans. on Circuits and Systems for Video Technology, Vol. 14, pp. 199-213, 2004. [8]. N. Miura, A. Nagasaka and T. Miyatake, “Feature Extraction of Finger Vein Pattern based on Repeated Line Tracking and its Application to Personal Identification”,
390
ISSN:2229-6093 G Sathish et al ,Int.J.Computer Technology & Applications,Vol 3 (1), 383-391
Machine Vision and Applications, Vol. 15, pp. 194-203, 2004. [9]. T. Shimooka and K. Shimizu, “Artificial Immune system for Personal Identification with Finger Vein Pattern”, Lecture Notes in Computer Science, Vol. 3214, pp. 511-518, 2005. [10]. Y. Gao and M.K.H. Leung, “Line Segment Hausdroff Distance on Face Matching”, Pattern Recognition, Vol. 35, No. 2 , pp. 361-371, 2002. [11]. G. Sathish, S.V. Saravanan, S. Narmadha and S. Uma Maheswari, “A Robust Biometric dual Watermarking Technique with Hand Vein Patterns for Digital Images, Int. J. Biometrics, Vol. 3, No. 2, pp. 159-174.
IJCTA | JAN-FEB 2012 Available
[email protected]
391