lected QoS data consistent with the format of collaborative filtering. ..... should specify a file directory in the comp
Personalized QoS Prediction for Web Services via Collaborative Filtering Lingshuang Shao1,2 , Jing Zhang1,2 , Yong Wei1,2 , Junfeng Zhao1,2 , Bing Xie1,2,∗, and Hong Mei1,2 1 Software Institute, EECS, Peking University, P.R.China 2 Key Laboratory of High Confidence Software Technologies, Ministry of Education of P.R.China {shaolsh04, zhangjing04, weiyong05, zhaojf, xiebing}@sei.pku.edu.cn,
[email protected] Abstract Many researchers propose that, not only functional but also non-functional properties, also known as quality of service (QoS), should be taken into consideration when consumers select services. Consumers need to make prediction on quality of unused web services before selecting. Usually, this prediction is based on other consumers’ experiences. Being aware of different QoS experiences of consumers, this paper proposes a collaborative filtering based approach to making similarity mining and prediction from consumers’ experiences. Experimental results demonstrate that this approach can make significant improvement on the effectiveness of QoS prediction for web services.
1 Introduction It is estimated that there would be a large number of web services developed and deployed on the Internet in next several years [16]. Many researchers propose that, not only functional but also non-functional properties, also known as quality of service(QoS), should be taken into consideration when consumers select services [5][4][12][13][8]. Selecting services with desired QoS properties, such as response time and availability, is important for the success of (critical) software applications[15]. Web service QoS prediction is an important step in selecting services. During the process of selecting services, consumers would like to use the QoS data acquired by themselves. But a single consumer cannot have sufficient preacquired data for all candidate web services. For example, there are ten services that provide ticket-booking, but usually a single consumer only has tried two or three of them. Additionally, it is impractical for consumers to try all these services by themselves, because most of the web services deployed on the Internet do not permit pressure testing, and some services require consumers to pay. Therefore, if a consumer wants to find out services with desired quality, he may need to make prediction on those unused services. ∗ Corresponding
Author
To make a comparatively accurate prediction, a consumer could reuse others’ usage experiences. A straightforward reuse mechanism is to calculate the arithmetic mean of all consumers’ QoS data. However, this mechanism does not take consumers’ differences into consideration. According to our experiences, consumers often have different experiences on the quality of the same web service. These differences are caused by many factors, such as network environment, programming languages, and so on. Averaging all consumers’ QoS data results in inaccurate prediction because it ignores the factor that consumers’ have different characteristics and different QoS experiences. To address this problem, this paper proposes an approach to predicting QoS for web services, taking the similarity among consumers’ experiences into consideration. The basic assumption of this approach is that the consumers, who have similar historical experiences on some services, would have similar experiences on other services. Our approach consists of two steps. First, we figure out the similarity between each two consumers with their historical QoS data. Second, we predict the quality of unused service for consumers based on the data published by other consumers regarding the similarity . In our experiment, we applied our approach to collected QoS data of real web services coming from 136 consumers. Experimental results demonstrate that our approach can make significant improvement on the effectiveness of QoS prediction. The main contributions of this paper include: (1) a collaborative filtering based approach for mining service consumers’ similarity and predicting QoS based on objective QoS data, and (2) a QoS data collecting mechanism and an experimental design which can be reused in other QoS prediction systems. The rest of the paper is organized as follows. The following paragraphs state the motivating scenario. Section 2 describes the framework of our approach. Section 3 and Section 4 describe the design and results of our experimental study. Section 5 gives an overview of the related work. Section 6 makes a discussion on our approach and outlines our future work. Section 7 draws a conclusion of this paper.
Motivating Scenario
and collaborative filtering [9]. In these techniques, collaborative filtering has a very similar motivating problem space with ours and is easy to implement. The main idea of collaborative filtering is to recommend items to consumers regarding other customers’ experiences [9]. Collaborative filtering has been adopted in many applications for recommendations and achieved good results. However, there still exist two points which make collaborative filtering technique unable to be used directly for our problem. First, users’ experiences in collaborative systems are often subjective ratings; on the contrary, in our motivating problem, the experiences are objective QoS data. Second, the result of predicting in collaborative filtering system is represented as a number, which is different from a vector in our problem. Our approach starts from transforming the motivating problem into the standard form of collaborative filtering and normalizes the objective QoS data into a uniform range. With an modified collaborative filtering based algorithm, our approach gives out the predicting results of QoS data. Our approach consists of four key steps: 1) Data Preparation, 2) Normalization, 3) Similarity Mining and 4) Prediction Making. Data Preparation makes our collected QoS data consistent with the format of collaborative filtering. Normalization makes the values of QoS property into a uniform scope based on Gaussian approach. Similarity Mining calculates the similarity with Pearson Correlation Coefficient between two consumers based on their historical experiences. Prediction Making makes linear prediction for each QoS property based on the similarity and combine the prediction values into a quality vector.
John is assigned to be in charge of an Enterprise Application Integration (EAI) project, which requires implementing a web pages searching function. John decides to reuse some web services. Because the project involves some critical applications, the service should achieve the following QoS requirements: the response time should be shorter than 1 second and the availability should be higher than 95%. After checking service registry, John finds that there are three web search services. The service registry also provides the QoS data of these services, which are shown in Table 1. Table 1. QoS Data Service 1 Service 2 Response Time 1.4s 0.5s Availability 0.82 0.83
Service 3 0.8s 0.9
John has only tried service 1 and 2, and wants to know the quality of service 3. John does not think the data provided by the service registry is usable for him because the information provided is the arithmetic mean of the data provided by all the service consumers, which is much different from John’s experiences. John discusses with other developers and finds that almost everybody have different experiences on web services QoS. John collects the quality information for these three services from many service consumers as showed in Table 2 and wants to make a comparatively accurate prediction based on other people’s experiences. Compared to the average calculation prediction, John thinks it is more reasonable to make prediction by taking Mark and Ross’ data with higher priority because their experiences on service 1 and 2 are comparatively similar with John’s. Our motivating problem is to make a comparatively accurate prediction for John based on the quality information coming from many different service consumers.
2.1
Problem Definition
To simplify the description of our approach, we formalize the motivating problem as follows: 1. S = {s1 , s2 , ..., sm } is a set of services with similar functionality where si (1 ≤ i ≤ m) denotes one service. 2. U = {u1 , u2 , ..., ul } is the set of service consumers and ui (1 ≤ i ≤ l) denotes a service consumer. 3. Qi,j = < p1i,j , p2i,j , ..., pni,j >, pki,j ∈ R ∪ {φ, ?} Qi,j is a vector representing the quality of sj measured by consumer ui . n denotes the number of regarded QoS properties. pki,j denotes the value of k-th QoS property of service sj measured by consumer ui . The value of pki,j could be a real number , φ or ?. When ui has no QoS data on service sj for the k-th property, we denotes pki,j as φ. When denoted as ?, pki,j denotes the QoS property to making prediction on. 4. Di =< Qi ,1 , Qi ,2 , ..., Qi ,k > is a vector, denoting the QoS data collected from consumer ui . 5. T =< Di , D2 , ..., Dl > is a vector of all QoS data. For example, Table 3 represents preceding definitions. The motivation of our paper is to propose an approach to making prediction on Q1,3 based on Table 3.
Table 2. Collected QoS Data Service 1 Service 2 Service 3 John 0.4s, 0.92 1.6s, 0.8 Harry 2.8s, 0.93 3.5s, 0.98 Mark 0.9s, 0.77 0.6s, 0.85 2.34s, 0.92 Jane 1.0s, 0.56 8s, 0.78 3.0s, 0.88 Ross 0.8s, 0.9 0.9s, 0.82
2 Our Approach The basic idea of our approach is to find out similarity between the consumers with collected QoS data and then to make prediction for the unused services based on the similarity. There are many techniques to calculate consumers’ similarity, such as clustering [10], content-based filtering [1]
2.2
Data Preparation
Data collected from consumers are denoted as T =< D1 , D2 , ..., Dl >. Prediction in our approach is made for 2
u1 u2 u3 u4 u5
ilarity comes accidentally but it still suggests that ui would have similar experience on s1 with uj . Then uj ’s QoS data make much impact on predicting, which is just a coincidence and had better be avoided in QoS prediction. In our experiment (in Section 3 and Section 4), the consumers who have not provide QoS data on more than two services are excluded.
Table 3. Motivating Example s1 s2 s3 < 0.4s, 0.92 > < 1.6s, 0.8 > < ?, ? > < 2.8s, 0.93 > < 3.5s, 0.98 > < φ, φ > < 0.9s, 0.77 > < 0.6s, 0.85 > < 2.34s, 0.92 > < 1.0s, 0.56 > < 8s, 0.78 > < 3.0s, 0.88 > < 0.8s, 0.9 > < φ, φ > < 0.9s, 0.82 >
2.3
Values of QoS properties can be data type or ratio type. The value of ratio type property varies in a limited range, such as 0∼100%. The value of data type property may vary in different ranges. A typical data type property is response time, which is possible to vary in range of [0,1s] for one kind of consumers, but in range of [10s, 20s] for the other king of consumers. Data type properties should be normalized to make data in different range be fair on making prediction. To be consistent with standard collaborative filtering format, we normalize the QoS data from each consumer separately. The values which are extremely large or small will disturb the result of normalization. To avoid this, we use Gaussian approach [18] to normalize QoS data as shown in Equation (1), where pki denotes the arithmetic mean of QoS data collected from consumer ui on k-th property. σi is the standard deviation of consumer ui ’s QoS data. We use 3σi because of the 3 − σ rule, which helps to normalize the value into the range of [0,1]. It can be proven that the probability of the normalized value being in the range of [0,1] is approximately 99% [18]. We map the value out of the range of [0,1] to 0 or 1. For example, the results of normalized Response Time data in Table 4 are shown in Table 5.
single QoS property, that is, we make prediction separately for response time, availability, etc. First, we transform T into several vectors, and each of the vector contains QoS data of a unique quality property. The formalized format of the transformed results goes as follows: Di0k =< pki,1 , pki,2 , ..., pki,m > is the vector of all values for the k-th quality property collected from consumer ui , where m denotes the number of services. T 0k =< D10k , D20k , ..., Dt0k > is a vector which contains the data of the k-th quality property collected from all consumers, where t is the number of service consumers. T 0 =< T 01 , T 02 , ..., T 0l > is a vector to denote all QoS data, where l is the number of the QoS properties. T 0 is the transformed format of QoS data. For example, Table 3 is transformed into two new tables in Table 4. Table 4. Decomposed Motivating Example for QoS Properties (a) Decomposed for Response Time
u1 u2 u3 u4 u5
s1 0.4s 2.8s 0.9s 1.0s 0.8s
s2 1.6s 3.5s 0.6s 8s φ
s3 ? φ 2.34s 3.0s 0.9s
pki,j = 0.5 +
s1 0.92 0.93 0.77 0.56 0.9
s2 0.8 0.98 0.85 0.78 φ
pki,j − pki 2 ∗ 3σi
(1)
Table 5. Normalized Data of Response Time s1 s2 s3 u1 0.33 0.67 ? u2 0.33 0.67 φ u3 0.39 0.3 0.8 u4 0.3 0.73 0.44 u5 0.33 φ 0.67
(b) Decomposed for Avaliability
u1 u2 u3 u4 u5
Normalization
s3 ? φ 0.92 0.88 0.82
2.4
Second, we set a threshold to exclude some consumers’ data. There would be so many services but a consumer may only has experiences on few of them. The consumer who provides a small amount of data will not make contributions to but only disturb the statistical result. For example, there are ten services which could satisfy consumer ui ’s functional requirements, and ui wants to know the quality of service s1 . Consumer uj only provides QoS data of two of these ten, say, s1 and s2 , but quality data of s2 provided by uj has much similarity with that provided by ui . This sim-
Similarity Mining
In our approach, the similarity between ui and uj on the k-th property indicates the probability of how pki,r is similar to pkj,r . Similarity is mined from consumers’ historical experiences. As proposed by Jonathan L. Herlocker, etc. [9], when the value is continuous, Pearson correlation coefficient [17] is satisfactory for measuring similarity. Because the values of QoS properties are almost continuous, we adopt the Pearson correlation coefficient as the metric of consumers’ 3
similarity. The common presentation of Pearson correlation Another potential problem in Equation (6) is that it calcur coefficient is Equation (2), (3) and (4). lates the value by summing up (pru,i − pru ) ∗ wa,b without r regarding the sign of wa,b . P r ¯r ¯r r Considering the contribution of similarities, we adopt a i=1..m∧pra,i ∈R∧prb,i ∈R ((pa,i − pa )(pb,i − pb )) r wa,b = (2) linear function to calculate the expected value of deviation σa × σb as shown in Equation (7) - (9). The basic ideas of the aps X proach are: (1) the positive and negative correlation should σa = (pra,j − p¯ra )2 (3) be treated separately and the combination of them should be j=1..m∧pra,j ∈R weighted mean, and (2) the expected deviation for ua from ub should be ((pru,i − p¯ru ) × wa,u ), but not (pru,i − p¯ru ) as in P r p Equation (6). j=1..n∧pra,j ∈R a,j p¯ra = (4) Equation (9) is the final predicting result. δ+ is the imn pact made on ua by the consumers who have positive correIn Equation (2), wra,b is the similarity weighting between lation with ua , δ− is the impact made by the ones who have consumer ua and ub on the r-th property. An example of negative correlation, and pra,u is the weighted average of δ+ calculating the similarity for Table 5 is shown in Table 6: and δ− . δ+ and δ− are computed based on the weighted mean of (pru,i − p¯ru ) × wa,u . P r r Table 6. Similarity between consumers r ∈R (qa,i − q¯ u ) × wa,u × wa,u wa,u >0∧qa,i P δ+ = (7) u2 u3 u4 u5 wa,u >0 wa,u u1 1 −0.05 0.76 0.13 P r r r ∈R (qa,i − q¯ u ) × wa,u × |wa,u | wa,u wa,c > 0 indicates P δ− = (8) that there is more similarity between ua and ub than that wa,u . but slowly to ub and meanwhile, service sj response slowly to ua but quickly to ub . Some properties, such as availabil3 Experiment Design ity, negative similarity value does not have clear mathematic To evaluate our approach, we design an experiment and meaning. So when we make prediction on these properties, the goal of this design is to simulate the real situation of we would set the negative similarity to be zero as Equation invoking web services. We try to avoid interfering the con5. ( P sumers on manually setting parameters and collecting QoS r r ¯r ¯r i=1..m∧pr ∈R∧pr ∈R ((pa,i −pa )(pb,i −pb )) a,i b,i data. We believe the QoS data collected following this der σa ×σb wa,b = (5) r sign would be accordant to that formed in real situations. 0 wa,b to denote a virtual entity: service consumer. The client programs are developed with Java JDK 1.5, and the SOAP engine is Apache Axis 1.4. The client program could switch proxy server automatically and invoke the services through these proxy servers. Volunteers can set the parameters on how client program runs, the details about these parameters are defined in Section 3.2.
3.2
Response time is the time interval between a consumer sending message and receiving response [7]. For each record R, the value of response time is calculated by et−st. The pres i,j , which denotes the response time measured by consumer ui on service sj , is the arithmetic mean of all pres i,j calculated from R with identical sn. Availability is the probability that service will be available for use. The equation for calculating the value of availability is (10). Avai,j = (Na − Nf )/Na
In Equation (10), Avai,j is the availability measured by consumer ui on service sj . Na is the total times that ui has invoked sj , Nf is the number of times that ui fails to connect to sj or the connection is refused by sj . Network Latency is measured by the method proposed by Florian, etc. [7]. The latency measured by this method is the time interval between the TCP handshake. We can get the value for this property by calculating the average of lat in all the records with the same IPc , IPp and sn. The functionality of service would have impact on QoS, for example, the measurement of reliability depends on how the service fulfil the functionality. In our experiment, we choose response time, availability and latency because they are independent with the functionality.
Parameters Model
In our experiment, there are two types of parameters: (1) invoking parameters, which are the parameters defined in SOAP message, and (2) running parameters, which specify how the client program runs. Basically, the data types of invoking parameters include string, integer and float. To relieve the volunteers from the burden of manually specifying the parameters in SOAP, the client program could automatically generate them. When integer or float-type parameters are required, client program will randomly generated the data. Although our experiment does not depend on volunteers’ preferences, we still hope the string-type parameters to reflect the volunteers’ preference to some extent. The process of generating string-type parameters goes as follows: when the client program runs at the volunteer’s machine for the first time, the volunteer should specify a file directory in the computer and the client program could get all the file names in this directory. These file names are put into a table. Volunteers could modify this table as their preferences. When the client program needs a string-type parameter, it randomly picks up one in this table. Running parameters should be set by the volunteers before they run the client programs. These parameters specify: 1) how many times to execute the client program per day, 2) what time to start the client programs, 3) the time interval between every two times of executing the client programs and 4) how many times the client program should invoke each service during each execution.
3.3
(10)
4 Experiments and Analysis 4.1
Data Sets
To evaluate our approach, we collect invoking records from 136 consumers on 20 real web services. Some of these services are published by Google, Yahoo!, Amazon, others are published at www.xmethods.net. The consumers are formed of 28 volunteers and 63 proxy servers. It took us three weeks to collect the records and averagely each volunteer submits 200 invoking records on each service. Averagely, each volunteer has tried five proxy servers during the experiments (the proxy servers, which are always not available, are excluded automatically). Totally, records from 136 consumers are collected. We calculate the values of QoS properties from these records and make a table similar to Table 3 as our initial data set. The basic idea of our evaluation is to exclude some data out of this table, and then use the remained data to predict the excluded. In our experiment, we randomly excluded x percent data ( x denotes an integer and 0 < x < 100) from the initial table and the value of x varies from 50 to 90, with 5 as increment. The results of our approach are compared with that of common collaborative filtering technique, which differs from ours at the prediction making step as Equation (6) stated in Section 2.5. Another comparison is made between our approach and average prediction method. For pri,j , the equation for average prediction is shown in Equation (11): Pn pri,j Average = i=1 , pri,j ∈ R (11) n − ne
QoS Model
The invoking record is defined as a vector R =< IPc , IPp , sn, st, et, lat, input, output >. IPc denotes the IP address of the volunteer, and the IPp denotes the IP address of the proxy server, sn is the name of service, st denotes the time when client program sends the request, et denotes when the client program receives the response, lat is the time interval of TCP handshake between client program and service provider, input and output are request and response SOAP message. The invoking records with the same IPc and IPp are regarded as from the same service consumer. Three QoS properties, response time, availability and network latency are considered to evaluate our approach. 5
In Equation (11), pri,j denotes the value of sj measured by ui on the r-th QoS property, n is the number of all the service consumers, and ne is the number of the places to be predicted or φ on sj . For example, in Table 4, the average prediction for pk1,3 is ( pk3,3 + pk3,4 + pk3,5 ) / (5 - 2) = ( 2.34 + 3.0 + 0.9 ) / 3 = 2.08.
Comparison On Response Time
Evaluation
For each percentage x (x denotes that there are x percent data are excluded), the process to choose testing data is repeated for ten times. In each repetition, the place of excluded data has a serial number, say, i and four values are recorded for the i-th place: (1) rdi : the original value of the i-th place, (2) pd1i : the predicted data got by our method, (3) pd2i : the predicted data got by the common collaborative filtering technique, and (4) adi : the data calculated by average prediction method. For the K-th repetition, PD1K , PD2K , RDK and ADK denote the arithmetic mean value of pd1 , pd2 , rd and ad. The equations for calculating PD1 , PD2 , RD and AD are (12) and (13). An example record of PD1 , PD2 , RD and AD on response time is represented in Table 7, and the serial number, say, K, in this table denotes the K-th repetition. Pn Pn 1 pd2 1 2 i=1 pdi P DK = , P DK = i=1 i (12) n n Pn Pn adi rdi , ADK = i=1 RDK = i=1 (13) n n
1 2 ... 10
PD2 1.23s 0.75s ... 1s
RD 0.55s 0.98s ... 1.3s
Comparison on Latency
MDpr1 MDpr2 MDar
250. 200. MDpr1 MDpr2 MDar
150. 100. 50. . 90. 85. 80. 75. 70. 65. 60. 55. % Data Off
90. 85. 80. 75. 70. 65. 60. 55. % Data Off
Error (Percent)
Comparison on Availability .35 .3 .25 .2 .15 .1 .05 .
MDpr1 MDpr2 MDar
90 85 80 75 70 65 60 55 50 % Data Off
4.3
Analysis
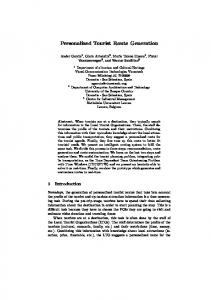
Figure 1 shows the comparison of MDpr1 (our approach), MDpr2 (common collaborative filtering) and MDar (average prediction) on response time, availability and latency separately. In each figure, the x-coordinate represents how many percentages of the total data have been excluded. From this figure, we can find that our approach and common collaborative filtering technique perform much better than average prediction. In most cases, these two approaches have about 10% to 40% optimization than average prediction. When the ratio of excluded data decreases, these two approaches present good potential to give better prediction. It demonstrates that the collaborative filtering based technique can significantly improve the effectiveness of QoS predicting. Figure 1 also shows that our approach (MDpr1 ) is slightly better than common collaborative filtering technique (MDpr2 ) when the data excluding are less than 70%. It indicates that our approach makes optimization only when the initial data is not sufficient. We argue that in real situation this insufficiency is common. We can image that it is a very heavy work load for developers to try 30% among twenty services. When the number of services increases, the insufficiency of QoS data will become more apparent.
Table 7. An example for predicted, real and average data PD1 1s 0.7s ... 0.8s
12. 10. 8. 6. 4. 2. .
Error (Mill Seconds)
Error (Second)
4.2
Figure 1. Mean Difference Comparison
AD 4s 3s ... 5s
With RD, PD1 , PD2 and AD, comparison can be made with Mean Difference Comparison among our method, the average prediction method and common collaborative filtering technique. Mean Difference Comparison compares M Dpr1 , M Dpr2 and M Dar . M Dpr1 denotes the mean difference between PD1 and RD and the equation for calculating M Dpr1 is (14). Accordingly, the equation for calculating the mean difference between AD and RD (denoted as M Dar ) is (16). The purpose for comparing M Dpr1 , M Dpr2 and M Dar is to figure out whether the data got from our method are closer to the real data than the average prediction. P10 |P Di1 − RDi | M Dpr1 = i=1 (14) P10 102 |P Di − RDi | M Dpr2 = i=1 (15) P10 10 |ADi − RDi | M Dar = i=1 (16) 10
4.4
Discussion
1.Is the number of services enough? Generally speaking, when evaluating the statistics related techniques, the data set should be large enough. The number of services in our experiment is only twenty, which is much smaller than the data set of a common statistical experiment. But it should be emphasized that these twenty services are assumed to have similar functionality. To the best of our knowledge, there are not so many services with similar functionality on the Internet. Although service technologies will develop dramatically in the future, we argue that the number of the services with similar functionality would not reach a big number in most domains. Regarding 6
this, twenty may be a suitable number for evaluating our method. 2.Is the process of simulating QoS data reasonable? As stated in Section 3.2, the process of setting running parameters are not interfered by us. The parameters for invoking services, which are randomly generated, may be not accordant to the real situation because as our experiences, the input parameters would be various for the consumers’ preferences. For example, when invoking the searching service provided by Google, some users would prefer to retrieve the web pages in Chinese, and others would prefer the pages in English. This preference has impacts on the QoS data and the randomly generated data cannot reflect such impacts. But we argue that, if the input parameters are generated according to some pre-set rules, our experimental results would be even better, because the similarity between the consumers would be easier to be identified, which contributes much to our predicting results.
This work is the basis of our work. To the best of our knowledge, there is no preceding work which proposes making QoS predicting with collaborative filtering technique. Most of the research for service recommendation is based on formalizing consumers’ preferences or service rating. And more, our approach have modified the calculation of the traditional collaborative filtering algorithm and achieves slightly enhancement. Maximilien and Singh propose a conceptual model for web service reputation [11]. In this model, users could rate services and share their experiences. N. Kokash proposes an approach to discovering services based on user previous experiences. This approach formalizes interactions between consumers and services into an implicit culture, which can be used to make recommendations to newcomers of service registries[6]. In previous work, the similarity among consumers is measured from their preferences and the ratings are based on the subjectivity of consumers. Our approach is different because the similarity mining is based on QoS data, which are objective and collected from interactions between consumers and real web services.
5 Related Work QoS-aware service discovery is a hot topic and researchers have proposed to extend standard UDDI registry to enable it. Our prediction mechanism is based on these solutions and aims to be a good complement to them. Ran proposed to extend UDDI’s “tModel” to describe QoS information and complement some interfaces to facilitate service retrieving[12]. UDDIe [13] is an another extended UDDI registry developed by Cardiff University. In UDDIe, QoS information is described as extended attributes of business service (which is one of core elements in UDDI data model). Accordingly, UDDI’s standard interfaces are extended to enable QoS-aware service discovery and QoS information publishing. UX is another extended UDDI which is proposed by Zhou, etc.[4]. This proposal adds a new server, named UX, to store QoS information, which is collected during interacting between consumers and services. Many researchers have proposed that service selection should take user preferences into consideration. Balke and Wagner employ service usage patterns and users’ needs together with users’ preference to enhance service discovery [3]. They also put forward a mechanism which enables cooperative discovery of web services [2]. Maamar, etc. propose a model for the context of web service interactions [14]. Besides user preferences, this work highlights the resource on which the web service is performed. These researches focus on providing a mechanism to formalize service consumers’ preferences, history, scenario and resource of service provider and are based on the pre-setup semantic and ontology models that need much manual work. Our work is quite different because in our approach, the similarity among consumers is mined among QoS data, which is collected automatically from interactions among consumers and services. . Collaborative filtering is a widely used method to make recommendations. Jonathan et al. propose an algorithm framework for performing collaborative filtering and this framework also provides some optimizing mechanisms [9].
6 Discussion and Future Work Our approach is based on the assumption that the consumers, who have similar historical experiences on some services, would have similar experiences on other services. The similarity between consumers is decided by many explicit and inexplicit features, such as users’ preferences and network environment. Our experimental results show the reasonability of this assumption when these features are stable (we could assume that in a not long time interval, the network environment is stable). When consumers are located in unstable environment, it needs some complementary mechanisms in our approach. In our future work, we will try some AI techniques to make our approach adaptable to such situation. In our approach, the prediction is made for each QoS property separately. This separated prediction is reasonable when the QoS properties are independent, but many QoS properties are correlative, such as response time and network latency. Prediction making on the correlative QoS properties separately may lead to some errors. A possible way to solve this problem is to use regression techniques to revise some results. In our future work, we’ll try linear regression and some other regression techniques to tackle this problem. There are many optimization techniques in collaborative filtering which have proposed in [9]. One technique which is the most possible to refine our approach is the windowbased method. The basic idea of it is that, when making prediction, only consumers’ data whose similarity is bigger than a pre-set threshold are taken into consideration. This and some other optimization mechanisms will be tried in our later refined version of this work. Other recommending techniques, such as data mining, will also be tried in our system to improve the accuracy of predicting. 7
To be simple and easy to understand, our experimental study have tried three QoS properties and achieved a satisfactory result. An ongoing work is to add more QoS properties, such as reliability, into our prototype system. Another future work is that we will deploy our system on the Internet to collect more real data to testify the approach.
[7] F. Rosenberg, C. Platzer, and S. Dustdar. Bootstrapping Performance and Dependability Attributes of Web Services. In Web Services. International Conference on, 2006, pages 205-212. [8] C. K. Fung, P. C. K. Hung, R. C. Linger, G. Wang, and GH. Walton. A service-oriented composition framework with qos management. In International Journal of Web Services Research, volume Vol. 3, 2006. [9] J.L. Herlocker, J.A. Konstan, A. Borchers, and J. Riedl. An Algorithmic Framework for Performing Collaborative Filtering. In SIGIR ’99: Proceedings of the 22nd annual international ACM SIGIR conference on Research and development in information retrieval, pages 230–237, New York, NY, USA, 1999. ACM Press. [10] A.K. Jain, M.N. Murty, and P.J. Flynn. Data Clustering: a Review. volume 31, pages 264–323, New York, NY, USA, 1999. ACM Press. [11] E.M. Maximilien, and M.P. Singh. Conceptual Model of Web Service Reputation. SIGMOD Rec., 31(4):36– 41, 2002. [12] S. Ran. A Model for Web Services Discovery with Qos. In ACM SIGecom Exchanges, Volume 4 , Issue 1, pages 1 - 10, 2003. [13] A. ShaikhAli, O.F. Rana, R. Al-Ali, D.W. Walker. UDDIe: an Extended Registry for Web services. In Applications and the Internet Workshops, 2003. Proceedings. 2003 Symposium on, pages 85- 89, 2003. [14] Z. Maamar, S.K. Mostefaoui, and Q.H. Mahmoud. Context for Personalized Web Services. In System Sciences. Proceedings of the 38th Annual Hawaii International Conference on, pages 166b– 166b, 2005. [15] A.S. Bilgin, and M.P. Singh. A DAML-Based Repository for QoS-Aware Semantic Web Service Selection. In Web Services, International Conference on, page 368-375, 2005. [16] Y. Liang, Y. Yan, and H. Liang. Composing Business Processes with Partial Observable Problem Space in Web Services Environments. In Web Services. International Conference on, pages 541 - 548, 2006. [17] RS. Pindyck, and DL. Rubinfeld. Econometrics Models and Economic Forecasts. McGraw-Hill, ISBN: 007-118831-2, 2000. [18] M. Ortega, Y. Rui, K. Chakrabarti, S. Mehrotra, TS. Huang. Supporting Similarity Queries in MARS. In ACM Multimedia, pages 403-413, 1997.
7 Conclusion Predicting QoS for web service is a very important step for service selecting. Considering the effect of similarity among users’ experiences on web services, we propose an approach based on collaborative filtering technique to improve the effectiveness of predicting. The main contributions of this paper include: (1) a collaborative filtering based approach for mining service consumers’ similarity and predicting QoS based on objective QoS data, and (2) a QoS data collecting mechanism and an experimental design which can be reused in other QoS prediction systems. Experimental results show that our approach can significantly improve the effectiveness of predicting web services QoS.
8 Acknowledgement We would like to thank Dr. Ying Pan and Prof. Lu Zhang’s valuable instructions on this paper. We would like to thank Yan Li and Xi Sun for helping us on improving our writing. This research was sponsored by the National Key Technology R&D Program of China under Grant No.2006BAH02A02, the National Nature Science Foundation of China(SN: 60473059,90412011), and the National Grand Fundamental Research 973 Program (SN: 2005CB321805) in China.
References [1] B. Marko and S. Yoav. Fab: content-based, collaborative recommendation. In Communications of the ACM, volume 40, pages 66–72, New York, NY, USA, 1997. ACM Press. [2] WT. Balke and W. Matthias. Cooperative Discovery for User-Centered Web Service Provisioning. In Web Services. International Conference on, pp. 399-404, 2003. [3] WT. Balke and W. Matthias. Towards Personalized Selection of Web Services. In WWW, 2003. [4] C. Zhou, LT. Chia, B. Silverajan, and BS. Lee. Ux: an Architecture Providing QoS-Aware and Federated Support for UDDI. In Web Services, 2003. International Conference on, pages 171-176. [5] C.K. Fung, P.C.K. Hung, and D.H. Folger. Achieving Survivability in Business Process Execution Language for Web Services (BPEL) with Exception-Flows. e-Technology, e-Commerce and e-Service, 2005. The 2005 IEEE International Conference on, pages 68 – 74. [6] N. Kokash, A. Birukou, and VD. Andrea. Web Service Discovery Based on Past User Experience. Technical report, WPI, 2007. 8