notations, they all aim at the visualization of business process models in a ... However, in conventional process modeling tools these visualizations are ... We are convinced that multiple views onto a business process model are important ... through the variable presentation of a business process model they could be ...
Perspective Oriented Business Process Visualization Stefan Jablonski and Manuel Goetz Chair for Databases and Information Systems, University of Bayreuth Universitätsstraße 30, 95447 Bayreuth, Germany Abstract. Visualizing business process models in various ways supports modelers in creation and users in understanding. Therefore we present a flexible and extensible meta model based approach to enhance business process models by multiple visualizations. These visualizations are geared to the so called perspectives of a business process model and emphasize different aspects of a business process model.
1 Introduction Most process modeling systems offer some kind of graphical notation. There are also standards like Business Process Modeling Notation (BPMN) [13] that even define the appearance of such a notation. Although these systems and standards have different notations, they all aim at the visualization of business process models in a manner that modelers and users can better grasp them to improve modeling and decrease misunderstandings. For instance, the OWL-S Editor plugin [4] for Protégé is good for modeling web services and their calling dependencies. However, the visualization is not flexible enough to change between different views on modeled web services. This would, among other things, foster the understanding of complex web service scenarios. As another example, the YAWL system itself is flexible and extensible [1], but the YAWL designer [18] concentrates on visualizing an advanced control flow model and its decomposition. New visualizations, for instance a Rule Editor, can be added, but this just adds information to a given visualization and does not introduce a different new visualization. Improvise [2] allows attachment of arbitrary and even multimedia data to common nodes in order to increase comprehensibility of a business process model. In [17] business process models are visualized three-dimensional to achieve this goal. While these approaches extend a single visualization, ARIS offers a number of different views [6] on a business process model. Among other things, there is one view to show the complete business process and there are other views that are refinements of special perspectives of a business process; for instance, one view shows the underlying organizational structure of a business process model. We principally favor the provision of different views on a business process model. However, in conventional process modeling tools these visualizations are implemented firmly. We foster in this paper an approach that provides visualizations flexibly according to the so called perspectives of a business process model. That concretely means that • we offer a set of different visualizations and • these visualizations can be flexibly applied to different perspectives of a business process model. A. ter Hofstede, B. Benatallah, and H.-Y. Paik (Eds.): BPM 2007 Workshops, LNCS 4928, pp. 144–155, 2008. © Springer-Verlag Berlin Heidelberg 2008
Perspective Oriented Business Process Visualization
145
This concept – for instance – facilitates to represent a business process model in a bubble-and-arc notation according to [16] which is depicted in Figure 6. However, it is also possible to represent the same business process model in a swimlane presentation (cf. Figure 11). Potentially, the organizational perspective (Section 0) of the same business process model is shown exclusively; but this latter model can also be extended by information about the operational or other perspectives (Figure 11). Moreover, it is possible to switch between the various presentations flexibly. We are convinced that multiple views onto a business process model are important to communicate to the modeler and/or user since business process models are complex artifacts. Being able to analyze them in multiple ways does very often facilitate their better understanding. We experienced this in multiple projects where through the variable presentation of a business process model they could be improved and could be better adjusted to the real application scenarios. The business process model visualization concept contributed in this paper is based on the so called perspective oriented process modeling which accordingly will be presented in Section 0. Section 0 then discusses the visualization concept in detail.
2 Perspective Oriented Process Modeling We pursue the approach of perspective oriented process modeling POPM ([8], [9]). The idea behind POPM is that a modeling construct consists of several orthogonal building blocks, which we call perspectives. The composition of these blocks then defines a process modeling construct, e.g. a process step. We identified five main perspectives for a basic process modeling language: • The Functional perspective identifies a process step and defines its purpose. Also the composition of a process is determined by this perspective. • The Data (flow) perspective defines data used in a process and the flow of data between process steps. Furthermore, this perspective also relates process data to (external) data models. • The Operational perspective specifies which operation (service) is invoked in order to execute a process step. It relates processes to services stemming from (external) service libraries. Execution of a process step is done after selecting a task from a worklist. The module rendering and executing the service is specified in the Operational Perspective. • The Organizational perspective defines agents (for instance users, roles) who are eligible and/or responsible to perform a process step. It relates agents to (external) organizational models/charts. These agent definitions are interpreted at execution runtime to assign tasks to people. • The Control flow or Behavioral perspective is used to define causal dependencies between modeling elements (e.g. step "B" may only be executed after step "A"). Often these dependencies are called control flow. It is crucial that this list of perspectives is neither complete nor fixed. Further perspectives can be added easily. In order to be able to support this extensibility the POPM is based on a layered meta model [7]; the layering of this meta model is borrowed from the Meta Object Facility (MOF) meta model [14] (refer to Figure 1,
146
S. Jablonski and M. Goetz
left column). It is out of the scope of this paper to define this meta model, but it has to be mentioned that perspectives are defined on the meta model level M2. On level M1, concrete occurrences of these perspectives are defined, i.e. business process types are specified. The usages of these business process types are then defined on level M0. So in principle, the description of a business process model is done on this level M0; here sub-processes, agents to execute a concrete process, applications to use within a process and data to be passed between processes are specified.
3 Visualization of Business Process Models 3.1 Using a Meta Model for Visualization We exploit the meta model structure of the POPM approach to business process modeling by organizing business process model visualizations in a similar manner as the POPM approach is organized.
Fig. 1. Relationship between meta model for business process models and its visualization
In Figure 1 the principle relationship between the meta model for business process models and its visualization is depicted. The visualization meta model distinguishes between visualizations of process types and process usages. Besides it is slightly differently structured than the meta model for business process models which is justified according to [5]. On meta level V1 pools for graphical modeling elements are contributed (Type_Presentation, Usage_Presentation) which can be taken to form different types of diagrams. For instance, one diagram for swimlanes (Figure 11) and another diagram for bubbles-and-arcs notation (Figure 6) is defined. We principally
Perspective Oriented Business Process Visualization
147
distinguish pools for process type and process usage presentations (where a process usage is an instance of a process type), although in this paper we just concentrate on usage presentation to comply with paper length instructions. The two pools for graphical modeling elements are associated with the modeling constructs (Modelling_Constructs) of the meta model for business process models. On meta level V0 concrete visualizations for process types (Type_Visualization) and process usages (Usage_Visualization) are instantiated. These two packages are connected to the corresponding process type definitions and process usage definition of the meta model for business process models. Up to now the visualization meta model describes how each process type and process usage, respectively, is presented in – possibly – different diagram types. For instance, the organizational perspective is alternatively presented as glue-box (cf. Figure 6) and as swimlane (cf. Figure 11). So, the static part of the presentation of a business process model is given. In order to layout such a process description a layout algorithm has to be provided that determines how the diverse elements of a process model are displayed. In [3] several algorithms to define such a layout are given. Since we provide presentation information for each layout explicitly in the visualization meta model, the number of layout algorithms grows in a linear manner with the number of presentations that are provided for a business process model. In this paper we do not investigate the application of layout algorithms in more detail but concentrate on the provision of presentation information in the visualization meta model. 3.2 Detailing Presentation for Process Instances on Meta Level V1 In this subsection the meta model for business process visualization will be analyzed, i.e. the right column of Figure 1 will be refined. Firstly, we detail the structure of the package Usage_Presentation (Figure 2). This package is divided into three layers. On the upper layer (Basic Shape Layer) all available graphical modeling elements are described (Figure 3); it is also described how these modeling elements can be connected. For instance, circles, rectangles and arcs are defined; moreover, it is described that arcs could connect rectangles, but it is forbidden that arcs are connected to further arcs. On the middle layer (Diagram Type Layer) of the package Usage_Presentation different types of diagrams are defined by restricting the modeling features of the package Basic_shapes. Here we define – for the time being – two different diagram types: "normal" graph structures are presented by the package Presentation_graphStructured; block structured diagrams can be derived from the package Presentation_blockStructured. Among other things, block structured diagrams allow nesting of modeling constructs (here especially: rectangles), while this nesting is forbidden for graph structures. Both packages are specializations of the package Basic_shapes what supports the reuse of visualization constructs. The lower layer (Presentation Layer) of the package Usage_Presentation defines presentations which are instantiated afterwards for the visualization of concrete business process models. These presentations are specializations of the two packages of the Diagram Type Layer. The classes of the packages of the Presentation Layer are associated with concrete classes of the business process meta model in order to define how actual business processes are visualized.
148
S. Jablonski and M. Goetz
Fig. 2. Structure of Usage_Presentation
Fig. 3. Basic shapes
In the following we detail some of the packages of Figure 2 in order to demonstrate how flexible visualizations for business process models can be enacted. 3.3 Presentations of the Diagram Type Presentation_graphStructured Graph structured diagrams (Figure 4) describe business processes through rectangles, circles and diamonds (and further elements) that are connected through arcs. Thus the classes Rectangle, Diamond and Circle of the package Basic _shapes are specialized and ConnectionPoints are assigned to those shapes in order to provide connecting points for arcs that connect those shapes in a visualization. These specializations together with the class Glue_RectangleRectangle are the main classes of the package Presentation_graphStructured while the other classes of that package mainly describe what shapes may be connected. The class Main_Rectangle can also have glue-boxes, i.e. rectangles that are glued to a Main_Rectangle. For that reason
Perspective Oriented Business Process Visualization
149
Fig. 4. Definition of graph structured diagram layout
Glue_RectangleRectangle and Main_Rectangle have associations to glue points. Glue-boxes can also be glued to a directional arc in order to provide additional information concerning that arc, e.g. the data that “flows” on an arc. As all associations defined in the Presentation_graphStructured are specializations of associations of the package Basic_Shapes, restrictions concerning the connectivity of elements are established. A glue-box, for instance, is not allowed to be connected to another element with an arc. A derived presentation of a graph structured diagram and hence a package of the Presentation Layer is the Presentation_BubbleAndArc (Figure 5). As allowed connections are already defined in the corresponding diagram type no further refinement is needed. The graphical elements are derived from the main classes in the Presentation_graphStructured and associated with modeling constructs. Additional information concerning the graphical representation on this level is the initial setting of attributes. A process step (Process_BubbleAndArc_Usage), for instance, is derived from the class Main_Rectangle and hence is allowed to be connected with arcs and to have glue-boxes; the additional graphical information in package Presentation_BubbleAndArc is the initial setting of the color which is yellow.
150
S. Jablonski and M. Goetz
Fig. 5. Derived presentation of bubble-and-arc visualization
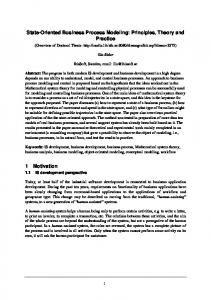
A business process model associated with an instance of the Presentation_BubbleAndArc_Usage is depicted in Figure 6 and Figure 7 whereas the process depicted in Figure 7 is a sub process of process step Pre-clinical Preparation Phase of Figure 6. Process steps bear organizations and applications as glue-boxes and are connected with directional arcs. These arcs can also have glue-boxes, which is meaningful in case of a data flow for displaying the corresponding data. This example shows an extract of a process model created in a clinical project where a hip replacement has been modeled. Figure 6 visualizes the top level process which consists of the main phases of a hip replacement, whereas Figure 7 details one of its main phase, namely Pre-clinical Preparation Phase (decomposition).
Fig. 6. Hip visualization
Prostheses
in
bubble-and-arc
Fig. 7. Pre-clinical Preparation Phase
The instantiated classes of Presentation_BubbleAndArc_Usage contain the status of the single graphical elements while a business process model is visualized. For instance, Figure 8 shows some objects needed when displaying Figure 7. Another presentation derived from the package Presentation_graphStructured is the Presentation_Functional_Usage. The main purpose of this presentation is to display the hierarchy of processes and sub-processes which is usually done by displaying a process tree. Although the two presentations are different with respect to its visualization, they are graphically derived from the same diagram type, namely Presentation_graphStructured; for instance, flows displayed as arcs when using the bubble-and-arc visualization are visualized as glue-boxes for readability reasons when
Perspective Oriented Business Process Visualization
151
Fig. 8. Resulting objects for bubble-and-arc visualization (Figure 7)
using the functional presentation. From a business process modeling point of view, these two visualizations highlight completely different aspects of a business process. As an example, the process model of Figure 6 and Figure 7 (bubble-and-arc visualization) is depicted in Figure 9 being visualized according to Presentation_Functional_Usage. This visualization was helpful while defining the process when interviewing physicians: the composition structure of the "Hip Prosthesis" could be grasped at a glance and misunderstandings could be corrected in a very early project phase.
Fig. 9. Process "Hip Prosthesis" in functional visualization
3.4 Presentations of Diagram Type Presentation_blockStructured Although the graph structured diagram type is commonly used and supports some very useful visualizations, it cannot express all visualization needed. For instance, one restriction of the graph structured presentation is that nesting is forbidden. Therefore another diagram type called block structured diagram is defined in package
152
S. Jablonski and M. Goetz
Presentation_blockStructured (Figure 10). Its main purpose is the creation of a graphical notation containing swimlanes to display dependencies between business process modeling constructs this way. Swimlanes are – from a graphical viewpoint – nested rectangles. Main classes of this presentation are Main_Rectangle and Level1_Sub-Rectangle, which are derived from Rectangle respectively Sub-Rectangle of package Basic_shapes (Figure 3). Sub-Rectangles are nested into Main_Rectangles in this presentation as Main_Rectangles represent the swimlanes. As opposed to Main_Rectangles, glue-boxes are allowed to be glued to Sub-Rectangles. Glue-Boxes are both sub-rectangles (as they are in a Main_Rectangle) and glued boxes (as they are glued to a Level1_Sub-Rectangle). Therefore the class Level2_GlueSub-Rectangle is derived from both corresponding classes in the package Basic_shapes.
Fig. 10. Definition of block structured diagram layout
All of the remaining perspectives (Figure 2) imply 1:n-dependencies with respect to their visualization purposes: • • • •
One organization is responsible for several processes One application is used for execution of several process One data usage can be produced and consumed by several processes One workflow pattern [19] can appear several times in a process model
An appropriate visualization for 1:n-dependencies is a swimlane notation, as with nesting the n elements into one swimlane the relationship is obvious. Since a swimlane notation is appropriate for displaying 1:n-dependencies, it is used for displaying the remaining perspectives. In the following, a visualization emphasizing the organizational perspective will be discussed. Again a package for a presentation is defined which is derived from Presentation_blockStructured (Figure 10). This presentation focuses on organizations
Perspective Oriented Business Process Visualization
153
and the processes organizations are responsible for. Therefore the graphical construct for an organization in the organizational presentation is specialized from Main_Rectangle which represents the swimlane. The graphical construct for a process is derived from Level1_Sub-Rectangle and hence the only element that can directly be nested in a swimlane. Remaining classes are derived from Level2_Sub-Rectangle and can be glued to a process to provide additional information concerning the processes. The example process of Figure 6 and Figure 7 visualized in an organizational visualization (Figure 11) shows the difference in layout and visualization structure compared to the diagrams instantiated and derived from the graph structured diagram type. For instance, there are no arcs defined connecting processes. In our clinical project, the organizational visualization has been used mainly for administration purposes like surgery planning. Furthermore treatment costs could be calculated more precisely as the different organizations participating in a treatment can be derived easily from this visualization. Combining these process-to-organization associations with average salaries and execution times for process steps, good calculations of the hip surgery could be derived.
Fig. 11. Organizational visualization
3.5 Evaluation and Use Cases The approach proposed offers multiple advantages. As visualization and business process modeling is defined on a meta level, it is extremely extensible and customizable in different ways. Single visualization elements, diagram types or presentations can be added, removed or modified depending on the application. This is a major advantage, especially when domain specific modeling is pursued. Here, adding new modeling constructs is a most convenient method to support application specific modeling [10]. We pursue the idea of domain specific modeling since it increases acceptance of process models by users decisively [11]. One conceptually minor customization, but important adjustment from an users' point of view, is to select appropriate graphical elements for modeling: for example, it might be very important to describe processes by circles instead of rectangles since the users are accustomed to this. Another advantage of our approach is its arbitrary customizability to process modeling methods. For instance, BPMN provides a standard visualization mechanism for business process models. Adopting this visualization mechanism can be done in a
154
S. Jablonski and M. Goetz
straightforward manner in our approach: the package Basic_shapes already contains all required modeling elements. Consequently defining a diagram type and a presentation is the only effort to support BPMN process modeling in our approach. Another advantage of our approach is the ability to include more than one business process model into a visualization. For instance, if more than one business process model share the same organizational elements (i.e. the same agents are responsible to perform the steps of the corresponding business processes), it is possible to depict these multiple business processes within one visualization. Ambition is – among other presentations – to integrate these different business processes into a swimlane presentation. The great advantage of this is that profound analysis of inter-process dependencies is made possible.
4 Conclusion The main contribution of this paper is to introduce a flexible visualization mechanism. The flexibility of the visualization is achieved by defining presentations on a meta level and associating their elements to modeling constructs. Experiences with a first prototypic implementation have confirmed that perspective oriented visualization improves the design of business process models and decreases misunderstandings between modelers and users. Furthermore the outlook of business process models can be adapted to customers' needs. The implementation of our approach is heavily making use of sophisticated modeling concepts like powertypes [11] to implement the desired flexibility and handle the mentioned problems concerning the meta levels. We did not discuss implementation details here but focused on the approach in general and especially on its effect on acceptance of process models for users. As the presented approach is that generic, it also can be used for integration purposes. For instance, several business process models can be displayed in one diagram, which is meaningful for some visualizations in order to analyze a group of business process models with respect to special aspects. Furthermore, transformation of business process models between different notations is supported whereupon we assume that these notations have been defined as presentations on level V1 before. Finally, we conclude that creating and integrating a visualization mechanism on a meta level is a adequate way to meet many modelers' and customers' special needs with maintainable effort as requirements necessary for that purpose like flexibility and extensibility are implemented on a conceptual level. Therefore reuse of graphical elements and diagram types is feasible and implementation effort is reduced a lot.
References 1. Adams, M., ter Hofstede, A.H.M., Edmond, D., van der Aalst, W.: Implementing dynamic flexibility using worklets. BPMCenter Report, vol. BPM-06-06. BPMCenter.org (2006) 2. Barghouti, N., Koutsofios, E., Cohen, E.: Improvise: Interactive Multimedia Process Visualization Environment. In: Proceedings of the Fifth European Software Engineering Conference (1995)
Perspective Oriented Business Process Visualization
155
3. Chok, S., Mareriott, K., Paton, T.: Constraint-based Diagram Beautification. In: Proceedings of the IEEE Symposium on Visual Languages (1999) 4. Elenius, D., Denker, G., Martin, D., Gilham, F., Khouri, J., Sadaati, S., Senanayake, R.: The OWL-S Editor – A Development Tool for Semantic Web Services. In: ESWC. The Semantic Web: Research and Applications, Proceedings of the Second European Semantic Web Conference, Crete, Greece, pp. 78–92 (2005) 5. Gonzalez-Perez, C., Henderson-Sellers, B.: A powertype-based metamodelling framework. Software & System Modeling 5(1), 72–90 (2006) 6. IDS Scheer: "ARIS Platform", (retrieved 2007-06-05), http://www.ids-scheer.de/sixcms/ media.php/2152/PR0207-D-BR_final.pdf 7. Jablonski, S., Volz, B., Dornstauder, S.: A Meta Modeling Framework for Domain Specific Process Management and its Implementation. Technical Report, University of Bayreuth, Department of Applied Informatics, (submitted for publication, 2007) 8. Jablonski, S.: Functional and behavioural aspects of process modelling in workflow management systems. In: Chroust, G., Benczur, A. (eds.) Proceedings of CON 1994, Workflow Management: Challenges, Paradigms and Products, Linz, Austria, R. Oldenbourg München, pp. 113–133 (1994) 9. Jablonski, S., Bussler, C.: Workflow Management: Modeling Concepts, Architecture and Implementation. Thomson International Computer Press (1996) 10. Jablonski, S., Faerber, M., Schneider, T.: A Comprehensive Modeling Language for Clinical Proceses. In: ECEH 2007. 2nd European Conference on eHealth, Oldenburg, Germany (2007) 11. Jablonski, S., Lay, R., Meiler, C., Faerber, M., Volz, B., Dornstauder, S., Götz, M., Müller, S.: Integrated Process and Data Management for Healthcare Applications. International Journal of Healthcare Information Systems and Informatics (accepted for publication) 12. Lenz, R., Kuhn, K.: Towards a continuous evolution and adaption of information systems in healthcare. International Journal of Medical Informatics 73, 75–89 (2004) 13. Object Management Group: Business Process Modeling Notation Specification (retrieved 2007-06-01), http://www.bpmn.org/Documents/OMG%20Final%20Adopted%20BPMN%2010%20Spec%2006-02-01.pdf 14. Object Management Group: Meta Object Facility Core Specification version 2.0 (2006) 15. Prodato Integration Technology: Handbook i>PM Integrated Process Manager. Software documentation, Erlangen (2005) 16. Rinderle, S., Bobrik, R., Reichert, M., Bauer, T.: Business Process Visualization – Use Cases, Challenges, Solutions. In: Proceedings of the 8th International Conference on Enterprise Information Systems, pp. 204–211 (2006) 17. Schönhaage, B., Ballegooij, A., Eliens, A.: 3D Gadgets for Business Process Visualization. In: Proceedings of the fifth symposium on Virtual reality modeling language, pp. 131–138 (2000) 18. van der Aalst, W., Aldred, L., Dumas, M., ter Hofstede, A.H.M.: Design and Implementation of the YAWL System. In: Persson, A., Stirna, J. (eds.) CAiSE 2004. LNCS, vol. 3084, Springer, Heidelberg (2004) 19. van der Aalst, W., ter Hofstede, A.H.M., Kiepuszewski, B., Barros, A.: Workflow Patterns. Distributed and Parallel Databases 14(1), 5–51 (2003)