Perspectives | Brief Communication
A Section 508–conformant HTML version of this article is available at http://dx.doi.org/10.1289/ehp.1510041.
Optimal Exposure Biomarkers for Nonpersistent Chemicals in Environmental Epidemiology http://dx.doi.org/10.1289/ehp.1510041
Summary: We discuss considerations that are essential when evaluating exposure to nonpersistent, semivolatile environmental chemicals such as phthalates and phenols (e.g., bisphenol A). A biomarker should be chosen to best represent usual personal exposures and not recent, adventitious, or extraneous exposures. Biomarkers should be selected to minimize contamination arising from collection, sampling, or analysis procedures. Pharmacokinetics should be considered; for example, nonpersistent, semivolatile chemicals are metabolized quickly, and urine is the compartment with the highest concentrations of metabolites. Because these chemicals are nonpersistent, knowledge of intraindividual reliability over the biologic window of interest is also required. In recent years researchers have increasingly used blood as a matrix for characterizing exposure to nonpersistent chemicals. However, the biologic and technical factors noted above strongly support urine as the optimal matrix for measuring nonpersistent, semivolatile, hydrophilic environmental agents.
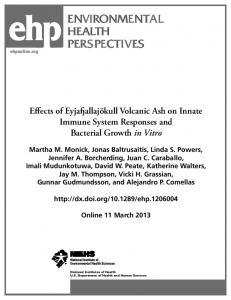
Quantification of exposure biomarkers is increasingly used to provide an integrated measure of a person’s multiple chemical-specific exposures (Pirkle et al. 1995). Yet successful exposure characterization requires more than sophisticated analytical chemistry techniques—the biomarker and matrix are also key. For general-population exposures, persistent organic pollutants (POPs) are usually measured in blood, and metabolites of non persistent chemicals such as phthalates and bisphenol A (BPA) are best measured in urine (Koch and Calafat 2009). In recent years, however, investigators have increasingly characterized exposure to nonpersistent chemicals by using other tissue matrices, particularly blood. To illustrate this trend, we identified 80 scientific articles, published in 2000–2014, that reported measuring BPA or phthalates in blood serum/plasma and other nonaqueous matrices, and that addressed topics on etiology, exposure, or metabolism (Figure 1). Urine is the preferred matrix for most nonpersistent chemicals because of their pharmacokinetics. Nonpersistent chemicals are quickly transformed to hydrophilic, polar metabolites and excreted mainly in urine (Koch and Calafat 2009). The concentration of most urinary metabolites is 30–100 times greater than concentrations in blood (Engel and Wolff 2013; National Research Council 2008). With existing analytical techniques, higher urinary concentrations facilitate quantification, whereas relatively low blood concentrations of polar biomarkers increase the likelihood that external contamination obscures true exposures. These are paramount considerations, given the increasingly recognized ubiquity of contamination. Controlled conditions of collection, storage, and processing of biospecimens are a long-acknowledged critical step for trace analyses of metals, volatile organic compounds, and POPs (Alcock et al. 1994; Ashley et al. 1992; Bolann et al. 2007). Unfortunately, the importance of preanalytic contamination sources is not as well understood for semivolatiles such as phthalates, phenols (e.g., BPA, parabens, triclosan), and similar modern nonpersistent chemicals. Rather than reflecting a person’s usual exposure over months to years, detected biomarkers of chemicals such as phthalates and BPA can represent recent use of medical equipment or treatment near the time of biospecimen collection (Jaeger and Rubin 1970; Larson et al. 1977; Vandentorren et al. 2011; Yan et al. 2009).
A 166
Extraneous contamination may occur during both the preanalytical and analytical phases. Phthalates and BPA can be detected even in the cleanest laboratories, from reagents, sampling equipment, and analytical apparatus (Fankhauser-Noti and Grob 2007; Longnecker et al. 2013; Marega et al. 2013; Markham et al. 2010; Vandenberg et al. 2014). Extraneous phenols may also come from sources such as plastics or paper products (BPA), soap (triclosan), moist towelettes (parabens), and preservatives (BPA, parabens) (Guidry et al. 2015; Longnecker et al. 2013; Ye et al. 2013). Moreover, in the field, during processing, or in the laboratory, beginning immediately after sample collection, phthalate diesters are hydrolyzed to monoesters by enzymes present in most biologic matrices (e.g., milk, serum, meconium, amniotic fluid, skin, saliva, sweat). These hydrolytic enzymes are not present in urine (Hines et al. 2009). In other words, monoesters are formed both from diesters absorbed in the body from a person’s general environment—the exposure we intend to assess—and from diesters introduced into the biospecimen itself from contaminated surfaces and medical devices. Phase I (e.g., phthalate oxidative metabolites) and phase II (e.g., phenol conjugates) metabolite biomarkers are least likely to arise from extraneous sources (Koch and Calafat 2009). Also, these metabolites exist at higher levels than the hydrolytic monoesters or free (unconjugated) phenols in urine (Hines et al. 2009; Teeguarden et al. 2013). For many phenols, no specific oxidative metabolites that can exclude contamination are currently used for biomonitoring. Instead, conjugated phenols (rather than the unconjugated species) are the most valid exposure biomarkers (Koch et al. 2012; Teeguarden et al. 2013). The short half-life of nonpersistent chemicals presents additional challenges, in that a biomarker must meet the criterion of temporality. Regardless of the matrix, intraindividual variability exists in exposure metrics over short time periods, particularly when such exposures are episodic in nature (Frederiksen et al. 2013; Koch et al. 2014; Lassen et al. 2013; Preau et al. 2010; Ye et al. 2011). However, metabolites are detectable longer in urine than in other matrices. Acceptable biomarker variability can exist because exposures arise from common, quotidian sources. Consequently, reasonable reproducibility over months to years has been found for urinary biomarker concentrations (Baird et al. 2010; Engel et al. 2014; Hauser et al. 2004; Mahalingaiah et al. 2008; Marcus et al. 2010; Meeker et al. 2012; Nepomnaschy et al. 2009; Teitelbaum et al. 2008; Townsend et al. 2013). To improve exposure assessment, studies can also incorporate pooling of specimens or repeated measurements across the time window of interest, such as trimesters of pregnancy (Adibi et al. 2008; Braun et al. 2011; Cantonwine et al. 2014; Fisher et al. 2014; Irvin et al. 2010; Jusko et al. 2014; Meeker et al. 2013; Philippat et al. 2013; Quirós-Alcalá et al. 2013; Smith et al. 2012; Valvi et al. 2015). In population research, environmental agents are selected for study based on biological relevance and exposure prevalence. Exposure biomarkers should be based on pharmacokinetics of the target chemicals and a suitable sampling matrix. The design should incorporate appropriate control procedures for collecting and processing specimens, validated analytical methods, and statistical analyses that account for sampling issues such as urine dilution (Barr et al. 2005) and collection times (Calafat and Needham 2009). Technology has made it analytically possible to measure polar biomarkers at trace concentrations in many media, but these endeavors risk exposure misclassification due to low biomarker concentrations, volume
123 | number 7 | July 2015 • Environmental Health Perspectives
Brief Communication
20 Type of study Exposure Etiology
Number of publications
15
10
5
0 2000
2005
2010
2015
Year
short biologic half-lives, and threat of external contamination. Greater reliance on phthalate and phenol biomarker concentrations in urine will improve the return on investment in environmental research.
The findings and conclusions in this report are those of the authors and do not necessarily represent the official position of the Centers for Disease Control and Prevention. This research was supported in part by the Intramural Research Program of the National Institute of Environmental Health Sciences (NIEHS), National Institutes of Health, Department of Health and Human Services. We thank Sandra Chambers at the NIEHS for help in identifying articles listed in Figure 1. The authors declare they have no actual or potential competing financial interests.
Antonia M. Calafat,1 Matthew P. Longnecker,2 Holger M. Koch,3 Shanna H. Swan,4 Russ Hauser,5 Lynn R. Goldman,6 Bruce P. Lanphear,7 Ruthann A. Rudel,8 Stephanie M. Engel,9 Susan L. Teitelbaum,4 Robin M. Whyatt,10 and Mary S. Wolff 4 1Centers for Disease Control and Prevention, Atlanta, Georgia, USA; 2National Institute of Environmental Health Sciences, National Institutes of Health, Department of Health and Human Services, Research Triangle Park, North Carolina, USA; 3Institute for Prevention and Occupational Medicine of the German Social Accident Insurance, Ruhr-Universität Bochum, Bochum, Germany; 4Icahn School of Medicine at Mount Sinai, New York, New York, USA; 5Harvard T.H. Chan School of Public Health, Boston, Massachusetts, USA; 6Milken Institute School of Public Health, George Washington University, Washington, DC, USA; 7 British Columbia Children’s Hospital, Vancouver, British Columbia, Canada; 8Silent Spring Institute, Boston, Massachusetts, USA; 9University of North Carolina at Chapel Hill, Chapel Hill, North Carolina, USA; 10 Mailman School of Public Health, Columbia University, New York, New York, USA
Address correspondence to M.S. Wolff, Mount Sinai Medical Center, Preventive Medicine, One Gustave L. Levy Place, Box 1057, New York, NY 10029 USA. E-mail:
[email protected]
References Adibi JJ, Whyatt RM, Williams PL, Calafat AM, Camann D, Herrick R, et al. 2008. Characterization of phthalate exposure among pregnant women assessed by repeat air and urine samples. Environ Health Perspect 116(4):467–473; doi:10.1289/ehp.10749. Alcock RE, Halsall CJ, Harris CA, Johnston AE, Lead WA, Sanders G, et al. 1994. Contamination of environmental samples prepared for PCB analysis. Environ Sci Technol 28(11):1838–1842; doi:10.1021/es00060a013. Ashley DL, Bonin MA, Cardinali FL, McCraw JM, Holler JS, Needham LL, et al. 1992. Determining volatile organic compounds in human blood from a large sample population by using purge and trap gas chromatography/mass spectrometry. Anal Chem 64(9):1021–1029. Baird DD, Saldana TM, Nepomnaschy PA, Hoppin JA, Longnecker MP, Weinberg CR, et al. 2010. Within-person variability in urinary phthalate metabolite concentrations: measurements
Environmental Health Perspectives
• volume 123 | number 7 | July 2015
Figure 1. Number of publications per year using blood or other non-urine biomarkers for bisphenol A (BPA) or phthalates, by type of study, from 2000 through 2014 (n = 80). The search strategy aimed to capture studies with measurements of free BPA or phthalate made on a human matrix, published from 2000 through 2014. We excluded 16 papers that were exclusively about the analytical chemistry methods of assay. We searched for English-language articles using the terms “phthalate” or “BPA,” measured in human serum, plasma, semen, adipose, milk, or saliva. The following list of PubMed identifiers, pasted into PubMed, retrieves the 80 articles we assessed, of which 38 are etiologic and 42 are exposure assessment: 25371878[uid] or 25337790[uid] or 25296284[uid] or 25268510[uid] or 25227326[uid] or 25213476[uid] or 25048886[uid] or 25036990[uid] or 24974312[uid] or 24816463[uid] or 24724919[uid] or 24720399[uid] or 24550655[uid] or 24503621[uid] or 24378374[uid] or 24336026[uid] or 24255718[uid] or 24025997[uid] or 23941471[uid] or 23904340[uid] or 23761051[uid] or 23710608[uid] or 23710174[uid] or 23667484[uid] or 23651625[uid] or 23506159[uid] or 23441348[uid] or 23411151[uid] or 23404131[uid] or 23377699[uid] or 23347089[uid] or 23213291[uid] or 23145999[uid] or 24524038[uid] or 22805002[uid] or 22722103[uid] or 22578698[uid] or 22498808[uid] or 22402483[uid] or 22381621[uid] or 22267833[uid] or 22050967[uid] or 21875366[uid] or 21705716[uid] or 21527603[uid] or 21440837[uid] or 24278551[uid] or 22953188[uid] or 21193545[uid] or 20822678[uid] or 20579427[uid] or 19706995[uid] or 19555962[uid] or 19444800[uid] or 19426969[uid] or 19165392[uid] or 18577445[uid] or 18273031[uid] or 18245696[uid] or 17822133[uid] or 17689919[uid] or 17661831[uid] or 17049806[uid] or 16603434[uid] or 16451866[uid] or 15995852[uid] or 15947000[uid] or 15893743[uid] or 15847671[uid] or 15644579[uid] or 14594632[uid] or 12869118[uid] or 12566679[uid] or 12417499[uid] or 12407035[uid] or 12401500[uid] or 11829464[uid] or 11604266[uid] or 10964036[uid] or 10716589[uid]. from specimens after long-term frozen storage. J Expo Sci Environ Epidemiol 20(2):169–175; doi:10.1038/jes.2009.17. Barr DB, Wilder LC, Caudill SP, Gonzalez AJ, Needham LL, Pirkle JL. 2005. Urinary creatinine concentrations in the U.S. population: implications for urinary biologic monitoring measurements. Environ Health Perspect 113(2):192–200; doi:10.1289/ehp.7337. Bolann BJ, Rahil-Khazen R, Henriksen H, Isrenn R, Ulvik RJ. 2007. Evaluation of methods for trace-element determination with emphasis on their usability in the clinical routine laboratory. Scand J Clin Lab Invest 67(4):353–366; doi:10.1080/00365510601095281. Braun JM, Kalkbrenner AE, Calafat AM, Bernert JT, Ye X, Silva MJ, et al. 2011. Variability and predictors of urinary bisphenol A concentrations during pregnancy. Environ Health Perspect 119(1):131–137; doi:10.1289/ehp.1002366. Calafat AM, Needham LL. 2009. What additional factors beyond state-of-the-art analytical methods are needed for optimal generation and interpretation of biomonitoring data? Environ Health Perspect 117(10):1481–1485; doi:10.1289/ehp.0901108. Cantonwine DE, Cordero JF, Rivera-Gonzalez LO, Anzalota Del Toro LV, Ferguson KK, Mukherjee B, et al. 2014. Urinary phthalate metabolite concentrations among pregnant women in Northern Puerto Rico: distribution, temporal variability, and predictors. Environ Int 62:1–11; doi:10.1016/j.envint.2013.09.014. Engel LS, Buckley JP, Yang G, Liao LM, Satagopan J, Calafat AM, et al. 2014. Predictors and variability of repeat measurements of urinary phenols and parabens in a cohort of Shanghai women and men. Environ Health Perspect 122(7):733–740; doi:10.1289/ehp.1306830. Engel SM, Wolff MS. 2013. Causal inference considerations for endocrine disruptor research in children’s health. Annu Rev Public Health 34:139–158; doi:10.1146/annurev-publhealth-031811-124556. Fankhauser-Noti A, Grob K. 2007. Blank problems in trace analysis of diethylhexyl and dibutyl phthalate: investigation of the sources, tips and tricks. Anal Chim Acta 582(2):353–360; doi:10.1016/j.aca.2006.09.012. Fisher M, Arbuckle TE, Mallick R, LeBlanc A, Hauser R, Feeley M, et al. 2015. Bisphenol A and phthalate metabolite urinary concentrations: daily and across pregnancy variability. J Expo Sci Environ Epidemiol 25(3):231–239; doi:10.1038/jes.2014.65. Frederiksen H, Kranich SK, Jorgensen N, Taboureau O, Petersen JH, Andersson AM. 2013. Temporal variability in urinary phthalate metabolite excretion based on spot, morning, and 24-h urine samples: considerations for epidemiological studies. Environ Sci Technol 47(2):958–967; doi:10.1021/es303640b. Guidry VT, Longnecker MP, Aase H, Eggesbo M, Zeiner P, Reichborn-Kjennerud T, et al. 2015. Measurement of total and free urinary phenol and paraben concentrations over the course of pregnancy: assessing reliability and contamination of specimens in the Norwegian Mother and Child Cohort study. Environ Health Perspect 123(7):705–711; doi:10.1289/ehp.1408325. Hauser R, Meeker JD, Park S, Silva MJ, Calafat AM. 2004. Temporal variability of urinary phthalate metabolite levels in men of reproductive age. Environ Health Perspect 112(17):1734–1740; doi:10.1289/ehp.7212. Hines EP, Calafat AM, Silva MJ, Mendola P, Fenton SE. 2009. Concentrations of phthalate metabolites in milk, urine, saliva, and serum of lactating North Carolina women. Environ Health Perspect 117(1):86–92; doi:10.1289/ehp.11610. Irvin EA, Calafat AM, Silva MJ, Aguilar-Villalobos M, Needham LL, Hall DB, et al. 2010. An estimate of phthalate exposure among pregnant women living in Trujillo, Peru. Chemosphere 80(11):1301–1307; doi:10.1016/j.chemosphere.2010.06.048. Jaeger RJ, Rubin RJ. 1970. Plasticizers from plastic devices extraction, metabolism, and accumulation by biological systems. Science 170(3956):460–462; PMID:5460077. Jusko TA, Shaw PA, Snijder CA, Pierik FH, Koch HM, Hauser R, et al. 2014. Reproducibility of urinary bisphenol A concentrations measured during pregnancy in the Generation R Study. J Expo Sci Environ Epidemiol 24(5):532–536; doi:10.1038/jes.2014.23.
A 167
Brief Communication
Koch HM, Aylward LL, Hays SM, Smolders R, Moos RK, Cocker J, et al. 2014. Inter- and intraindividual variation in urinary biomarker concentrations over a 6-day sampling period. Part 2: personal care product ingredients. Toxicol Lett 231(2):261–269; doi:10.1016/j.toxlet.2014.06.023. Koch HM, Calafat AM. 2009. Human body burdens of chemicals used in plastic manufacture. Philos Trans R Soc Lond B Biol Sci 364(1526):2063–2078; doi:10.1098/rstb.2008.0208. Koch HM, Kolossa-Gehring M, Schroter-Kermani C, Angerer J, Bruning T. 2012. Bisphenol A in 24 h urine and plasma samples of the German Environmental Specimen Bank from 1995 to 2009: a retrospective exposure evaluation. J Expo Sci Environ Epidemiol 22(6):610–616; doi:10.1038/jes.2012.39. Larson DF, Mayall B, Anderson RM. 1977. Hemolysis due to chemical contamination of clinical perfusion apparatus. Ann Thorac Surg 23(4):374–375. Lassen TH, Frederiksen H, Jensen TK, Petersen JH, Main KM, Skakkebæk NE, et al. 2013. Temporal variability in urinary excretion of bisphenol A and seven other phenols in spot, morning, and 24-h urine samples. Environ Res 126:164–170; doi:10.1016/j.envres.2013.07.001. Longnecker MP, Harbak K, Kissling GE, Hoppin JA, Eggesbo M, Jusko TA, et al. 2013. The concentration of bisphenol A in urine is affected by specimen collection, a preservative, and handling. Environ Res 126:211–214; doi:10.1016/j.envres.2013.07.002. Mahalingaiah S, Meeker JD, Pearson KR, Calafat AM, Ye X, Petrozza J, et al. 2008. Temporal variability and predictors of urinary bisphenol A concentrations in men and women. Environ Health Perspect 116(2):173–178; doi:10.1289/ehp.10605. Marcus M, Christensen KY, Manatunga A, Rudra CB, Brock JW, Small CM. 2010. Variability of phthalate monoester levels in daily first-morning urine from adult women: a pilot study. Rev Environ Health 25(4):359–368; doi:10.1515/REVEH.2010.25.4.359. Marega M, Grob K, Moret S, Conte L. 2013. Phthalate analysis by gas chromatography-mass spectrometry: blank problems related to the syringe needle. J Chromatogr A 1273:105–110; doi:10.1016/j.chroma.2012.11.076. Markham DA, Waechter JM Jr, Wimber M, Rao N, Connolly P, Chuang JC, et al. 2010. Development of a method for the determination of bisphenol A at trace concentrations in human blood and urine and elucidation of factors influencing method accuracy and sensitivity. J Anal Toxicol 34(6):293–303; doi:10.1093/jat/34.6.293. Meeker JD, Calafat AM, Hauser R. 2012. Urinary phthalate metabolites and their biotransformation products: predictors and temporal variability among men and women. J Expo Sci Environ Epidemiol 22(4):376–385; doi:10.1038/jes.2012.7. Meeker JD, Cantonwine DE, Rivera-Gonzalez LO, Ferguson KK, Mukherjee B, Calafat AM, et al. 2013. Distribution, variability, and predictors of urinary concentrations of phenols and parabens among pregnant women in Puerto Rico. Environ Sci Technol 47(7):3439–3447; doi:10.1021/es400510g. Nepomnaschy PA, Baird DD, Weinberg CR, Hoppin JA, Longnecker MP, Wilcox AJ. 2009. Withinperson variability in urinary bisphenol A concentrations: measurements from specimens after long-term frozen storage. Environ Res 109(6):734–737; doi:10.1016/j.envres.2009.04.004. National Research Council. 2008. Phthalates and Cumulative Risk Assessment: The Tasks Ahead. Washington, DC:National Academies Press. Philippat C, Wolff MS, Calafat AM, Ye X, Bausell R, Meadows M, et al. 2013. Prenatal exposure to environmental phenols: concentrations in amniotic fluid and variability in urinary
A 168
concentrations during pregnancy. Environ Health Perspect 121(10):1225–1231; doi:10.1289/ ehp.1206335. Pirkle JL, Needham LL, Sexton K. 1995. Improving exposure assessment by monitoring human tissues for toxic chemicals. J Expo Anal Environ Epidemiol 5(3):405–424. Preau JL Jr, Wong LY, Silva MJ, Needham LL, Calafat AM. 2010. Variability over 1 week in the urinary concentrations of metabolites of diethyl phthalate and di(2-ethylhexyl) phthalate among eight adults: an observational study. Environ Health Perspect 118(12):1748–1754; doi:10.1289/ehp.1002231. Quirós-Alcalá L, Eskenazi B, Bradman A, Ye X, Calafat AM, Harley K. 2013. Determinants of urinary bisphenol A concentrations in Mexican/Mexican-American pregnant women. Environ Int 59:152–160; doi:10.1016/j.envint.2013.05.016. Smith KW, Braun JM, Williams PL, Ehrlich S, Correia KF, Calafat AM, et al. 2012. Predictors and variability of urinary paraben concentrations in men and women, including before and during pregnancy. Environ Health Perspect 120(11):1538–1543; doi:10.1289/ehp.1104614. Teeguarden J, Hanson-Drury S, Fisher JW, Doerge DR. 2013. Are typical human serum BPA concentrations measurable and sufficient to be estrogenic in the general population? Food Chem Toxicol 62:949–963; doi:10.1016/j.fct.2013.08.001. Teitelbaum SL, Britton JA, Calafat AM, Ye X, Silva MJ, Reidy JA, et al. 2008. Temporal variability in urinary concentrations of phthalate metabolites, phytoestrogens and phenols among minority children in the United States. Environ Res 106(2):257–269; doi:10.1016/j. envres.2007.09.010. Townsend MK, Franke AA, Li X, Hu FB, Eliassen AH. 2013. Within-person reproducibility of urinary bisphenol A and phthalate metabolites over a 1 to 3 year period among women in the Nurses’ Health Studies: a prospective cohort study. Environ Health 12(1):80; doi:10.1186/1476-069X-12-80. Valvi D, Monfort N, Ventura R, Casas M, Casas L, Sunyer J, et al. 2015. Variability and predictors of urinary phthalate metabolites in Spanish pregnant women. Int J Hyg Environ Health 218(2):220–231; doi:10.1016/j.ijheh.2014.11.003. Vandenberg LN, Gerona RR, Kannan K, Taylor JA, van Breemen RB, Dickenson CA, et al. 2014. A round robin approach to the analysis of bisphenol A (BPA) in human blood samples. Environ Health 13(1):25; doi:10.1186/1476-069X-13-25. Vandentorren S, Zeman F, Morin L, Sarter H, Bidondo ML, Oleko A, et al. 2011. Bisphenol-A and phthalates contamination of urine samples by catheters in the Elfe pilot study: implications for large-scale biomonitoring studies. Environ Res 111(6):761–764; doi:10.1016/j. envres.2011.05.018. Yan X, Calafat A, Lashley S, Smulian J, Ananth C, Barr D, et al. 2009. Phthalates biomarker identification and exposure estimates in a population of pregnant women. Hum Ecol Risk Assess 15(3):565–578; doi:10.1080/10807030902892554. Ye X, Wong LY, Bishop AM, Calafat AM. 2011. Variability of urinary concentrations of bisphenol A in spot samples, first morning voids, and 24-hour collections. Environ Health Perspect 119(7):983–988; doi:10.1289/ehp.1002701. Ye X, Zhou X, Hennings R, Kramer J, Calafat AM. 2013. Potential external contamination with bisphenol A and other ubiquitous organic environmental chemicals during biomonitoring analysis: an elusive laboratory challenge. Environ Health Perspect 121(3):283–286; doi:10.1289/ehp.1206093.
volume
123 | number 7 | July 2015 • Environmental Health Perspectives