Journal of Membrane Science 378 (2011) 186–193
Contents lists available at ScienceDirect
Journal of Membrane Science journal homepage: www.elsevier.com/locate/memsci
pH effects on the adherence and fouling propensity of extracellular polymeric substances in a membrane bioreactor Amer Sweity, Wang Ying, Sophia Belfer, Gideon Oron, Moshe Herzberg ∗ Ben Gurion University of the Negev, Zuckerberg Institute for Water Research, Sede Boqer Campus, Midreshet Ben Gurion, 84990, Israel
a r t i c l e
i n f o
Article history: Received 15 February 2011 Received in revised form 28 April 2011 Accepted 30 April 2011 Available online 10 May 2011 Keywords: EPS Organic fouling Biofouling MBR Ultrafiltration QCM-D
a b s t r a c t Both conformation and adsorption characteristics of extracellular polymeric substances (EPS) are affected by water chemistry in general and by the pH in particular. Therefore, changes in pH during operation of membrane bioreactor (MBR) systems are likely to affect fouling of ultrafiltration (UF) membranes. Pore clogging of UF membranes attributed to EPS can be affected by the pH in a complex manner: since the heterogeneous nature of the EPS mixture consists of both aromatic and aliphatic components with carboxylic acids (COOH) and phenolic alcohols (OH), at lower pH, adsorption of EPS to negatively charges surfaces is usually increasing. However, EPS conformation is also affected by pH changes that induce either linear (stretched) or coiled (compact) structure at high and low pH values, respectively. This study shows an increased adsorption of MBR originated EPS to Polyvinylidene Fluoride (PVDF) surfaces at lower pH, probably due to smaller deprotonated chemical functional groups that are in charge of repulsive electrostatic interactions. In contrast to the EPS adsorption results, the fouling rate of UF membrane by similar EPS at pH value of 6.3 was significantly lower than the fouling rate at higher pH value of 8.3. The relation between pH elevation and flux decline during EPS fouling experiment is shown to be a result of EPS conformation and swelling characteristics, which affect water and EPS permeation through the UF membrane pores. When EPS structure is stretched, linear chains are more accessible to the membrane pores that eventually clog the UF membrane at higher pH values. © 2011 Elsevier B.V. All rights reserved.
1. Introduction Membrane fouling in membrane bioreactors (MBRs) is a well known severe problem reducing the performance and the efficiency of MBR processes and limiting the wide uses of this technology [1]. Membrane fouling starts when the membranes are subjected directly to the solution that contains a variety of macromolecules, which are adsorbed to the membrane surface. In activated sludge systems, deposition of sludge flocs takes place followed by cake layer formation on the membrane surface [2]. Physicochemical interactions in charge of adsorption of fouling agents to the membrane surface usually include hydrophobic interactions (dispersion forces), polar interactions (dipole–dipole and dipole-induced dipole forces) and charge transfer (hydrogen bonding) [3]. Membrane fouling is affected by membrane surface properties, the aquatic chemistry, hydrodynamic conditions, and concentration as well as the nature of the foulant materials [4]. Water chemistry parameters such as ionic strength and pH can strongly affect the degree of fouling [5]. It has been reported that extracellular polymeric substances (EPS) have a major impact on
∗ Corresponding author. Tel.: +972 8 6563 520; fax: +972 8 6563 503. E-mail address:
[email protected] (M. Herzberg). 0376-7388/$ – see front matter © 2011 Elsevier B.V. All rights reserved. doi:10.1016/j.memsci.2011.04.056
biofouling of UF membranes in MBR wastewater treatment processes [4]. EPS, metabolic products of active microbial secretion [6], are high molecular weight biopolymers that in most cases, mainly consist of polysaccharides [7], proteins, nucleic acids [8,9] and lipids [10,11]. EPS are a complex mixture by origin, which comprise of both aromatic and aliphatic components [12] with carboxylic acids (–COOH), phenolic alcohols (–OH), and methoxy carbonyls (–C O) functional groups [13]. Also phosphoric acid functional groups [–OP( O)(OH)2 ] are part of the EPS complex [14]. Still, in most cases, carboxylic groups represent the majority of all functional groups in the EPS mixture [15]. EPS acquire an electric surface charge through dissociation (ionization) of surface functional groups resulting in mutual repulsion and expansion of the biopolymers [16]. EPS adsorption can be affected by various factors including the interaction between the surface-functional groups, conformation, water chemistry (such as pH, multivalent cations, and ionic strength), temperature, concentration, and adsorbent surface chemistry [17–20]. At lower pH, adsorption of EPS to negatively charged surfaces is usually increasing due to protonation of higher number of carboxylic groups. pH changes also affect EPS conformation by inducing either stretched or compact structure at high and low pH values, respectively [21,22]. The effect of pH variation on EPS rearrangement using small angle X-ray scattering (SAXS) technique was reported by Dogsa et al. showing that upon decrease of
A. Sweity et al. / Journal of Membrane Science 378 (2011) 186–193
the pH from 11 to 8.8, EPS was swelled and at lower pH values, EPS become more heterogeneous in its structure [23]. Omoike and Chorover used ATR-FTIR spectroscopy and showed how changes of pH can alter the conformation of extracellular proteins extracted from Bacillus subtilis [24]. A first approximation of the interacting forces between EPS and the surface can be carried out by implementing the Derjaguin–Landau–Verwey–Overbeek (DLVO) theory [25], which defines the total interactions between a colloidal particle, in this case EPS, and a substratum, as the sum of attractive van der Waals forces and repulsive electrostatic interactions [25,26]. Applying the DLVO theory, it is widely known that solution chemistry plays a significant role in determining foulant–foulant and foulant–membrane physico-chemical interactions, and hence membrane performance. Hence, pore clogging of UF membranes attributed to EPS can be also affected by the changes of pH values. For that, pH changes during operation of MBR systems are expected to affect UF membrane fouling dramatically [27]. Also, pH changes in MBR systems may change the cohesion of the sludge flocs. It was shown by Gao et al. [28] that elevated pulses of the pH can induce dispersion of the flocs, enhance accumulation of colloids and biopolymers in the mixed liquor suspended solids (MLSSs) and consequently, deteriorate membrane performance. Smaller size particles deposited on the membrane and formed a compact layer after alkaline shock at pH 10 that induced membrane fouling rate [28]. The effect of water chemistry on membrane fouling with natural organic matter (NOM) and the role of foulant conformation has been reported by Li and Elimelech showing that a more compact and adhesive layer is formed in the presence of calcium and high ionic strength [29]. Yuan and Kilduff studied the ionic strength effect on the transport of NOM in UF membranes and showed that changes in NOM solute radius are reduced at elevated ionic strength and consequently reduce membrane rejection to NOM [30]. As for the pH effect, the adsorbance of biopolymers to membranes was shown to increase at low pH. The lower solubility of the biopolymers as well as the more positive zeta potential of the membrane pores as pH decreases, could explain this behavior [31]. Both Dong et al. and Teixeira and Rosa found that lowering pH resulted in flux decline due to fouling [32]. Dong et al. showed that decreasing the pH enhances adsorption of NOM to the membrane due to a decrease of the molecular size distribution of the NOM [33]. In contrast to the studies mentioned, Ruohomäki et al. showed that extra fouling takes place at neutral pH values [34]. Yet, the effect of pH on fouling of UF membranes is not decisive. EPS is a major constituent in MBR processes, and its conformation can significantly affect membrane fouling and performance. The interrelated effects of the pH on EPS conformation, adsorption, and membrane fouling were only rarely explored. Therefore, this study is aiming to study the effect of pH on EPS adsorption to a surface mimicking membrane and to compare EPS adsorption to actual filtration experiments of solutions composed of similar EPS through UF membranes, when membrane permeability is analyzed. Adsorption of defined EPS extracted from a laboratory scale hybrid growth MBR (HG-MBR) was analyzed at different pH values in a quartz crystal microbalance with dissipation monitoring (QCM-D). QCM-D provides real-time, label free measurements of molecular adsorption and/or interactions taking place on various surfaces [35,36]. In addition to assessing adsorbed mass (sensitivity in order of ng/cm2 ), measured as changes in oscillating frequency (F) of the quartz crystal, the energy dissipation (D), which is the reduced energy per oscillation cycle provides novel insights regarding structural properties of adsorbed layers [37,38]. Complementary techniques, including Fourier transform infrared (FTIR) spectroscopy and dynamic light scattering (DLS), were used to delineate the mechanisms in charge for the variations in EPS fouling
187
at different pH values. FTIR spectroscopy is used for analyzing the fingerprinting of EPS chemical functional groups on the UF membrane. DLS technique is used for defining the hydrodynamic size distribution of EPS molecules under similar aquatic conditions as in the filtration and adsorption experiments being conducted in the first part of the study. 2. Materials and methods 2.1. Single fiber filtration unit The effect of the pH on fouling of UF membrane with defined EPS, extracted from the HG-MBR, was studied under controlled environment in which permeate flux decline and FTIR fingerprinting of the EPS were analyzed. During the single fiber fouling experiments with similar batch of EPS solution, changes in membrane permeability were acquired. Fig. 1 shows the single UF fiber system. The main components of the system are pressurized glass tank (2 L) with two valves at the bottom. The sealing cap is connected to a flexible plastic pipe connected to pressure regulator (−1 to 2 bar outlet pressure) fed with a constant supply of Nitrogen gas at an inlet pressure of 12 bar. The pressure outside of the UF fiber, i.e., the applied pressure for permeation of the EPS solution through the UF membrane, was continuously acquired by a PC connected to an 8-channel universal analog input module with modbus (Adam 4019+ Advantech, USA). The applied pressure was 0.15 ± 0.01 bar and the decrease in permeate flux was also analyzed gravimetrically and continuously acquired by an electronic balance connected to a PC. The valve at the bottom of the glass bottle at one side was attached to polyvinyl chloride (PVC) pipe connected to the UF membrane fiber which cut and inserted in 3/4 in. transparence PVC plastic pipe hanged vertically on a stand. Every 10 min, pressure and accumulated flow reading were saved automatically to a PC. Fouling protocol of the UF membrane fiber with EPS included washing the PVDF fiber with 0.01% sodium hypochlorite (NaOCl) for 30 min. Then, double distilled water (DDW) was used to wash the sodium hypochlorite (1 h) and 5 mM EDTA solution (pH 11) was injected for another 30 min for washing remained organics. Then, DDW was used to wash the fiber and for maintaining a baseline with a stable permeability for 6 h under stable temperature (24 ± 2 ◦ C) and pressure (0.15 ± 0.01 bar). Prior to EPS injection to the fiber filtration unit, 100 mM NaCl (pH = 6.3 ± 0.1) background solution was used and a baseline, when a constant permeability of the UF membrane was acquired for 6 h. Then, EPS solution was injected to the filtration system. EPS sample was extracted from MLSS flocs in the HG-MBR at solids retention time (SRT) of 30 days. EPS stock solution sample was added to the background solution to retrieve 1.34 ± 0.1 mg TOC/L of EPS. During the fouling experiment, an hourly 15 ml permeate sample was collected for TOC analysis to determine the TOC rejection of the UF membrane. After finishing the fouling experiment, the washing procedure of the fiber was applied and a duplicate experiment was conducted. The fiber from the second experiment was used for FTIR analysis. The fouling experiment at pH 8.3 ± 0.1 was carried out by adding 10 mM NaHCO3 solution at ionic strength solution of 100 mM adjusted with NaCl. Similar washing and fouling procedures were applied as in the experiments of pH 6.3 ± 0.1. 2.2. HG-MBR operation and source of EPS A hollow fiber UF membrane module, ZW-10 (Zenon Inc, Canada), with a nominal pore size of 0.04 m and a total filtering surface area of 0.93 m2 was submerged in the center of a 190 L reactor. The reactor was operated with AqWise carriers (AqWise, Israel)
188
A. Sweity et al. / Journal of Membrane Science 378 (2011) 186–193
Fig. 1. Schematic diagram of the UF membrane single fiber filtration set-up. Working pressure was set to 0.15 ± 0.01 bar, and initial membrane permeability was 0.19 ± 0.02 cm min−1 bar.
filled as biofilm support with a filling ratio (carrier volume/reactor volume) of 50% (13.64 kg). Detailed information on the HG-MBR setup, operation, and process analysis is reported in our previous publications [39,40]. The feed wastewater consisted of artificial mix of domestic wastewater and chicken manure under ambient desert conditions (Sede Boqer campus, Ben-Gurion University of the Negev, Israel). Biofilm culture and adaption was performed according to Ying et al. [39,40]. This HG-MBR was used as a biomass source for EPS extraction and analysis of their adherence at different pH values in a QCM-D. pH variation experiments during MBR operation: under similar operational conditions, MLSS pH values in the MBR unit were adjusted either to 7.9 or to 5.7 from initial ambient pH of 6.6. The first experiment was conducted by adjusting the pH values with 2 M NaHCO3 solution injected to the MLSS with a peristaltic pump at a constant flow rate of 4 ml/min until the pH of the MLSS reached a value of 7.9. At this point, the injection of the buffer solution stopped and the system was recovering until the original pH value was achieved. During the experiment, the filtration flux of permeate was monitored volumetrically and TMP was monitored by a digital pressure indicator every 30 min. The mixed liquor temperature was monitored by a temperature indicator located in the reactor MLSS. The dissolved oxygen (DO) concentration is the mean of the upper, middle and bottom locations in the bioreactor vessel (Model 550, YSI, USA) to assure no changes of the DO level happened. A second experiment was conducted using similar procedure with 0.5 M HCl solution to achieve MLSS pH value of 5.7. Membrane permeability during the pH variation experiments was taking into account temperature variations according to the equation, J20 ◦ C = JC × 1.02520−t [41], and is presented as permeability at 20 ◦ C. J20 ◦ C is the calculated flux at 20 ◦ C and JC is the actual flux measured at a certain temperature, t. 2.3. EPS extraction and analysis MLSSs were used as a source of EPS. The HG-MBR was operated for 35 days at SRT of 30 days with a biomass concentration range increasing from 2440 to 4580 mg/L as MLSS and from 1140 to 2910 mg/L as fixed biofilm on the AqWise carriers. Eventually, a relatively stable biomass concentration of 3970 ± 110 mg/L and 2810 ± 290 mg/L as MLSS and biofilm, respectively, was established during the last seven days of the MBR operation. The rest of the reactor operational and performance analysis is listed in Table 1. EPS extraction was conducted by fixation step with 0.22% formaldehyde followed by addition of 1 N sodium hydroxide to facilitate dissociation of the acidic groups in the EPS to the solution
[42]. Thereafter, the suspension was centrifuged (20,000 g, 15 min, 4 ◦ C), filtered through a 0.2-m hydrophilic nylon filter (Millipore Co.), and dialyzed through a dialysis membrane of 3500 Da (Spectra/Por). Polysaccharide and protein contents in the EPS were analyzed calorimetrically according to Dubois et al. [43] and Bradford method [44], respectively. Extracellular TOC, proteins, and polysaccharides were analyzed as 0.04 ± 0.015 mg, 0.017 ± 0.01 mg, and 0.035 ± 0.015 mg per dry mg of MLSS used for EPS extraction. 2.4. QCM-D analysis EPS was extracted from the MLSS at the end of the fouling experiment of the HG-MBR under SRT of 30 days [39,40]. The adsorption kinetics of 20 mg TOC/L of EPS solution was carried out in a QCM-D (Q-Sense AB, Gothenburg, Sweden). The QCM-D measurements were performed with AT-cut quartz crystals mounted in an E1 system (Q-sense AB, Gothenburg, Sweden) (22). The gold coated crystals, with a fundamental resonant frequency of around 5 MHz, were coated with Polyvinylidene Fluoride (PVDF) by Q-Sense (QSX999). Before each measurement, the crystals were soaked in a 5 mM ethylenediaminetetraacetic acid (EDTA) solution for 30 min, rinsed thoroughly with DDW and dried with pure N2 gas. The EPS was used in several adsorption measurements to the QCM-D PVDF coated sensor. EPS adsorption to the sensor surface is characterized by the change of the oscillation frequency of the PVDF coated sensor during parallel flow of aqueous media with flow rate of 150 l/min above the sensor surface. The variations of frequency, F (Hz), and dissipation factor, D (−), were measured for the three overtones (n = 5, 7, and 9). The working stages for applying aqueous media to the QCM-D flow-cell include 5 stages of 20 min each at constant temperature (22 ◦ C) after acquiring a stable baseline with DDW for several hours. For analyzing the effect of pH on the EPS adsorption, solutions were injected sequentially to the QCM-D system in the following order: (i) 100 mM NaCl solutions adjusted to pH 6.3 ± 0.1, or pH 8.3 ± 0.1; (ii) EPS dissolved the studied solutions; (iii) washing solutions with either elevated or decreased pH values. Stage (iii) was applied for analyzing the reversibility of the EPS adsorbed layer: after the EPS adsorption experiments at pH 6.3 ± 0.1, solutions at elevated pH (6.3 ± 0.1, 7.3 ± 0.1, and 8.3 ± 0.1) without EPS were injected sequentially to the QCM-D flow-cell. After the EPS adsorption experiments at pH 8.3 ± 0.1, solutions at decelerated pH (8.3 ± 0.1, 7.3 ± 0.1, and 6.3 ± 0.1) without EPS were injected sequentially into the QCM-D flow-cell. For all
A. Sweity et al. / Journal of Membrane Science 378 (2011) 186–193
189
Table 1 Operating (A) and process (B) conditions of the HG-MBR at SRT 30 days. (A) Operating conditions
(B) Process analysis
Parameter 15.5–29.4 ◦ C (mean 22.3 ◦ C) 631.1
Temperature Initial membrane permeability (L m−2 h−1 bar−1 ) at 20 ◦ C Initial membrane resistance (m−1 ) Filtrate flux (L/(m2 h)) Aeration rate (m3 /h) Hydraulic retention time (h) pH in the reactor Dissolved oxygen (mg O2 /L) MLSS range (mg/L) AqWise carriers in the reactor Operating duration (days)
Influent
Effluent
Percent removal
COD (mg/L) BOD (mg/L)
418 ± 123 171 ± 45
36 ± 13 1.3 ± 0.4
91.4 99.2
± ± ± ± ± ± ±
95.4 31.2 25.0 99.9 99.9 – –
0.56 × 10¹² NH4 + -N (mg/L) 44.5–38.9 TN (mg/L) 2.3 PO4 3− -P (mg/L) 5.1–5.8 TSS (mg/L) 6.6 ± 0.2 Turbidity (NTU) 0.31–6.5 (mean 2.6) EC (mS/cm) 2440–4580 (mean 4055) pH 13.64 kg carriers in the reactor with a bulk filling ratio of 50% 34 days
experiments, frequency and dissipation shift data were collected for approximately 20 min for each stage.
Attenuated Total Reflection Fourier Transform Infrared (ATRFTIR) spectra were recorded on a Vertex 70 FTIR spectrometer (Bruker) using a Miracle ATR attachment with a one-reflection diamond-coated KRS-5 element (Pike). 2.6. Dynamic light scattering (DLS) analysis The distributions of diffusion coefficients for EPS were measured in all types of solutions applied in the QCM-D using dynamic light-scattering (CGS-3, ALV, Langen, Germany). Lyophilized EPS samples were dissolved in the background solution being studied to a final concentration of 39.5 mg TOC/L. All samples were filtered through 0.2 m hydrophilic PVDF filter (Millipore) prior to the measurement and 2.5 ml samples were placed in glass vials (Sigma–Aldrich, Israel). The laser power was 20 mW at the He–Ne laser line (632.8 nm). Correlograms were calculated by ALV/LSE 5003 correlator, which were collected at 90◦ , during 10 s for 20 times, at 25 ◦ C. The correlograms were fitted with version of the program CONTIN [45]. From the intensity-weighted diffusion coefficient, the hydrodynamic radius was calculated by using Stokes–Einstein equation.
A B
C D
E
-4 -6 -8
20
6.8 8.1 4.2 63 79 0.2 0.3
1.4 24 7.6 0.2 0.2 1.2 7.5
2.8 7.4 3.3 0.5 0.1 0.2 0.4
40
60
80
Time, Minutes
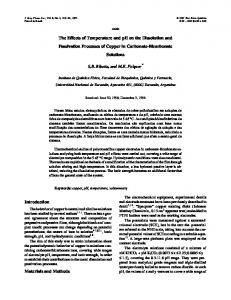
The influence of pH on EPS adsorption to PVDF surface is presented in Fig. 2. In these experiments, total ionic strength was kept constant at 100 mM, adjusted with NaCl. At lower pH, increased amount of protonated carboxylic and hydroxylic functional groups reduce the negative charge, the acidity, and the hydrophilic nature of the EPS. The zeta potential of the PVDF surface under these conditions (pH values above 4) is expected to be of negative value and therefore electrostatic repulsion between the PVDF surface and EPS, and between EPS content in the solution and the deposited EPS is reduced at pH 6.3 comparing to pH 8.3. As a result, the deposition rate of EPS on the PVDF surface increases at pH 6.3 compared to pH 8.3. Moreover, EPS has a smaller macromolecular configuration at pH 6.3, due to reduced electrostatic repulsion between neighboring functional groups, and thus diffuses faster toward the sensor. Based on the dimensions and flow rates employed in the QCM-D flow cell, the Peclet (Pe) number was calculated [46]. A calculated Pe number of 0.001 indicated that the EPS experienced a diffusion dominated flow regime [47]. Note that the more compact layer formed at lower pH on the QCM-D sensor is eventually reducing the dissipation energy of the oscillated crystal compared to a stretched and less compacted layer at higher pH values (Fig. 2B).
A Dissipation Shift (ΔD, -)
-2
0
± ± ± ± ± ± ±
3. Results and discussion
F
pH 6.3 pH 8.3
0
-10
30 35 10 171 231 1.3 7.5
3.1. The effect of pH on EPS adsorption and desorption to and from PVDF surface
2.5. ATR-FTIR analysis of the deposited EPS
Frequency, Hz
Parameter
100 120
B
C D E
F
2.5 2.0 1.5 1.0
pH 6.3 pH 8.3
0.5 0.0 0
20
40
60
80
100 120
Time, Minutes
Fig. 2. Adsorption kinetics of EPS extracted from HG-MBR MLSS onto a PVDF coated QCM-D sensor at pH 6.3 ± 0.1 and 8.3 ± 0.1. Desorption stages were carried out during washing stages with similar NaCl solution under different pH conditions. Frequency shifts are presented in the left panel and show the adsorption or desorption of EPS to or from the PVDF surface. Dissipation shift factors are presented in the right panel and show the reduced energy per oscillation cycle during the EPS adsorption/desorption process. A–E labels are the following solution injection steps of 20 min each: (A) baseline with DDW; (B) 100 NaCl background solution at either pH 6.3 or pH 8.3; (C) EPS dissolved in background solution; (D) 100 mM NaCl background solution at the pH of stage (C); (E–F) 100 mM NaCl background solution at either elevated or decreased pH value.
190
A. Sweity et al. / Journal of Membrane Science 378 (2011) 186–193
pH 6.3 #1 pH 8.3 #1 pH 6.3 #2 pH 8.3 #2
Normalized Permeability
1.0
0.9
0.8
0.7
0.6
0.5 0
120
240
360
480
600
Time, Minutes Fig. 3. Fouling of a single fiber UF membrane in a controlled experiment with EPS extracted from HG-MBR MLSS fraction. Setting pH 6.3: ionic strength of the EPS solution was set to 100 mM with NaCl at ambient pH of 6.3. Setting pH 8.3: pH of 8.3 was acquired with 10 mM NaHCO3 and final ionic strength was set to 100 mM with NaCl. A relatively constant pressure was set to 0.15 ± 0.01 bar. Initial permeability of the UF PVDF fibers (Zenon, GE) was 0.19 ± 0.02 cm min−1 bar.
The effects of the pH were further analyzed during washing of the adsorbed EPS layer with a similar background solution, without EPS, at different pH values (Fig. 2). Fig. 2A clearly shows that washing with a similar background solution, at pH 8.3, is recovering the frequency shift to its initial value indicating a mass loss of the sensor to its initial state. It can be concluded that EPS adsorption at pH 8.3, in this case, appears to be reversible. In contrast, washing the adsorbed EPS layer at pH 6.3 is recovering the frequency shift to only about 30% of its initial value. At pH 6.3 more protonated functional groups in the EPS reduce its acidity and probably making it more hydrophobic. A reduced repulsion between the EPS and the PVDF surface is probably contributing to this irreversible adhesion (Fig. 2A). Moreover, washing stages at elevated pH values of the EPS layer that originally was adsorbed at pH 6.3, did not remove the EPS from the crystal since no change in the frequency shift was observed (Fig. 2A). An elevation of the dissipation factor, under these conditions, is an indication for changes in the EPS conformation during these washing stages as shown in Fig. 2B. Hence, at pH 8.3 the EPS layer becomes more fluid with higher interaction with the water interface, causing an increase in the dissipation energy of the oscillated crystal. 3.2. pH effect on biofouling of UF membrane with EPS: permeate flux decline Opposed to the adsorption results of the EPS to the PVDF sensor, in which greater EPS adsorption was observed as pH decreased, faster permeate flux decline was observed at higher pH of 8.3, in comparison with the reduced flux observed at pH 6.3 (Fig. 3). As observed in the QCM-D adsorption results, not only higher and irreversible adsorption for most of the EPS was shown (Fig. 2A) at lower pH, but also conformational changes of the EPS were indicated by the observed dissipation shift during washing steps at elevated pH values (Fig. 2B). The reduced compactness, probably stretched conformation at higher pH, and swelling as shown by the QCM-D, is hypothesized to influence these counter-intuitive fouling results of the UF membrane (Fig. 3). The expanded conformation of the injected EPS at higher pH can explain the faster pore blockage during fouling with EPS that consequently induce a faster permeate flux decline (Fig. 3).
Fig. 4. Evidences for membrane fouling and pore blockage by EPS at pH 8.3: (A) TOC passage (TOCPermeate /TOCFeed ) through the UF membrane during filtration of EPS solution (1.3 ± 0.1 mg TOC/L) at different pH conditions. (B) FTIR spectra of the clean membrane (blue), fouled membrane at pH 6.3 (red), and fouled membrane at pH 8.3 (green). Feed pressure was set to 0.15 ± 0.01 bar and initial membrane permeability was 0.19 ± 0.02 cm min−1 bar. (For interpretation of the references to color in this figure legend, the reader is referred to the web version of the article.)
3.3. pH effect on biofouling of UF membrane with EPS: membrane pore blocking Notably, the passage of the EPS through the single fiber membrane module was between 95 and 90% during the entire experiment at pH 6.3 and a significantly reduced passage of similar EPS is observed only due to pH elevation to 8.3 (Fig. 4A). Since this EPS is shown to change its conformation and to swell at elevated pH values from 6.3 to 8.3 (dissipation factor is increasing and frequency shift is decreasing in Fig. 2), likely, at pH 8.3, part of the EPS is retained in the membrane pores as supported by Fig. 4A. Also, the fast decrease in membrane permeability at pH 8.3 is another evidence of pore blocking analyzed by Chang et al. [48]. Nevertheless, these results do not follow the adsorption studies of EPS at these pH conditions presented in Fig. 2, which indicates higher EPS adsorption at lower pH values. However, as already mentioned, careful examination of the QCM-D results in Fig. 2 shows the increase in dissipation shifts during pH elevation from 6.3 to 8.3, reflected by the EPS layer. This elevated dissipation is likely, an indication of increased layer softness and fluidity during its washing stage at pH 8.3 (Fig. 2, right panel). Also Ying et al. showed that increase in EPS layer softness and fluidity is attributed to swelling of the adsorbed EPS layer as pH is elevated [40]. In order to define the origin of the fouling layer and to trace changes in the surface composition of the membranes operated at different pH conditions versus the clean membrane, FTIR spectrum of the fouled membranes before and after EPS filtration was acquired. Fig. 4B shows the FTIR spectra of three membranes: clean
1.0
pH8.3
3.4. Changes in EPS conformation affect pore blocking of UF membranes
0.8 0.6 0.4 0.2 0.0 0
1
2
3
4
5
6
7
8
9
10
Hydrodyanmic Radius, nm Fig. 5. The effects of the pH on the distribution of the hydrodynamic radius of the EPS molecules analyzed with DLS as presented by Ying et al. [40]. EPS concentration was 39.5 mg TOC/L. The analysis was carried out in ionic strength of 100 mM adjusted with NaCl.
Permeability ,L m-2 hr-1 bar-1
1400
Permeability, decelerated pH Permeability, elevated pH
1000
DLS analysis presented in our previous publication [40] (Fig. 5) supports the results presented so far showing a shift in the particle size distribution for the EPS molecules at pH 8.3 in comparison to pH 6.3. An increase in the size of the EPS molecules at pH 8.3 is observed from size above 3.5 nm. This complementary technique clearly shows that once EPS is exposed to higher pH, its conformation becomes less compact as analyzed with a higher scattering intensity. At pH 8.3, EPS is more ionized. In the ionized form, the negatively charged carboxyl groups along the polymer backbone repel each other; the polymer coil is then much extended and relatively inflexible. In this form, the molecule is less readily permeable through the 40 nm pores of the ZW-10 UF membrane. At pH 6.3, the carboxyl groups along the EPS polymer backbone are more protonated. The resulting neutral molecule is much more flexible and can pass through the membrane pores [3]. As already mentioned, it is proposed that a more pronounced pore blocking at higher pH is attributed to swelling of the adsorbed EPS layer that narrow the UF pores at higher pH. We also cannot rule out the possibility that extended EPS conformation at pH 8.3 provides the EPS higher surface area along with a higher probability of fruitful adhesive interactions with the walls of the 40 nm pores of the ZW-10 UF membrane. 3.5. pH effect on UF membrane permeability during operation of HG-MBR In order to observe the short term pH effect on UF membrane fouling in real MBR municipal wastewater treatment processes, Permeability, L m-2 hr-1 bar-1
membrane (red), fouled membrane at pH 6.3 (blue), and fouled membrane at pH = 8.3 (green). The absorbance bands of 1650 cm−1 and 1540 cm−1 in the spectrum of the membrane fouled at pH 8.3 are assigned to C O at 1650 cm−1 (amide 1) and C–N as well as N–H (amide 2) stretching vibration of amides. When filtering with EPS solution at pH 6.3, these bands were not detected. The absence of these bands is giving evidence of reduced fouling at lower pH (Fig. 4B). These results are in good agreement with the results presented in Figs. 3 and 4A. It is likely that extracellular proteins in the EPS mixture play a major role in UF biofouling. Previous study by Metzger et al. showed that proteins can play a major role in the UF MBR fouling process causing an irreversible organic fouling of the
1200
191
membrane predominated by bound proteins originated from SMP of the MBR biomass [49].
pH6.3
400
pH = 6.7
pH = 6.7
350 300 250
B
pH = 7.9
200 16
17
18
19
Days of MBR operation
800 600 400
A
200 0 0
5
10
15
Days of MBR operation
20
25
Permeability, L m-2 hr-1 bar-1
Normalized Scattering Intensity
A. Sweity et al. / Journal of Membrane Science 378 (2011) 186–193
160
pH = 6.7 140
pH = 6.7 120
pH = 5.8
C
100 14
14.5
15
15.5
16
Days of MBR operation Fig. 6. Instantaneous effects of pH variations on membrane permeability in the MBR system (A): a decrease of the UF membrane permeability at high pH of the MLSS (B); an elevation in membrane permeability at low pH of the MLSS (C).
192
A. Sweity et al. / Journal of Membrane Science 378 (2011) 186–193
pH variations were carried out in MBR system in a way resembling the filtration experiments of the EPS solution in the single fiber filtration unit (Figs. 1 and 6A). As the pH value of the MLSS decreased from 6.7 to 5.8 during the short dosing period of 0.5 M HCl solution, the permeability increased from 140 L m−2 h−1 bar−1 to almost 160 L m−2 h−1 bar−1 (Fig. 6C). Also, as the pH value of the MLSS increased from 6.7 to 7.9 by dosing 2 M NaHCO3 solution to the MBR system, membrane permeability decreased from 340 L m−2 h−1 bar−1 to 250 L m−2 h−1 bar−1 (Fig. 6B). These results correlate to the changes observed for membrane permeability and pore blocking occurred during the filtration of the EPS solution through single fiber UF membrane (Figs. 1, 3 and 4). It should be mentioned that during the entire period of pH variation experiments, a constant DO concentration of 4.32 ± 0.26 and 3.79 ± 0.35 was measured during the decreasing and increasing periods of the MLSS pH, respectively. The instantaneous response of the UF membrane to changes in the pH of the MLSS implies that likely, physico-chemical process is the cause for changes in membrane permeability. As mentioned, the higher flexibility of the EPS at lower pH, provide it with better permeability through the UF membrane pores while at higher pH the reduced permeability of the EPS is likely due to its inflexible structure [50]. Another known process in the colloidal systems including the MLSS mixture, at elevated pH include an increased negative zeta potential and charge of particles and colloids composing the MLSS flocs. Therefore, we cannot rule out the effect of pH changes on the MBR sludge and biofilms properties. Gao et al. showed that elevated pH shocks can reduce membrane permeability by dispersion of the MBR flocs and deposition of dense colloidal cake on the UF membrane [28]. Also changes of the polysaccharides to proteins ratio in the MBR can be altered by pH elevation [28]. Yet, the instantaneous reduction in permeability of the membrane resembles the single fiber fouling experiment with EPS at high pH. In conclusion, all the following indications suggest that EPS swelling and conformation play a major role in UF membrane fouling mechanism: (1) the instantaneous significant effect of the relatively small pH elevation on membrane permeability; (2) the oxygen concentration that was stable throughout the MBR experiment; and (3) the changes in the EPS layer conformation indicated by the increase of the dissipation energy of the QCM-D sensor.
4. Concluding remarks It is of utmost important to understand the biofouling mechanisms of UF membrane in MBR processes in order to improve biofouling control and cleaning strategies. The role of pH and the related EPS fouling mechanisms of UF membranes used in MBR was studied using complementary methods. Adsorption tests of EPS extracted from MBR to a PVDF coated sensors in a QCM-D were carried out at pH values of 6.3 and 8.3. Filtration experiments through UF membranes under controlled conditions were conducted and permeate flux as well as TOC passage were analyzed. Also, FTIR spectra of the fouled membranes and DLS analysis of the EPS molecules were acquired. The effect of water chemistry on the conformation of the fouling layers in UF membranes is likely important piece of UF membrane fouling mechanisms in MBR systems. Nevertheless, adsorption propensity of EPS to QCM-D coated sensors that mimic UF membrane material cannot be a good predictor of UF membrane fouling. Fouling of porous membranes such as ultrafiltration is not only affected by the adsorption of the foulant to the pores surface but also by foulant conformation and swelling characteristics. It was found that fouling of UF membranes is strongly affected by the EPS conformation and swelling that are related to the pH conditions. The extended conformation and swelling of the EPS fouling layer are
suggested to narrow the UF membrane pores as the pH is elevated. Instantaneous changes in membrane permeability were observed in a real HG-MBR unit treating municipal wastewater due to a step change the pH values in a similar manner as shown for laboratory controlled experiments with isolated EPS solution. Acknowledgement This study was supported by USAID Middle East Regional Cooperation (MERC) Program, project number: M29-048. References [1] W.B. Yang, N. Cicek, J. Ilg, State-of-the-art of membrane bioreactors: worldwide research and commercial applications in North America, Journal of Membrane Science 270 (2006) 201–211. [2] F. Meng, S.-R. Chae, A. Drews, M. Kraume, H.-S. Shin, F. Yang, Recent advances in membrane bioreactors (MBRs): membrane fouling and membrane material, Water Research 43 (2009) 1489–1512. [3] S.A.S. Richard, D. Noble, Membrane Separations Technology: Principles and Applications, 1st ed., Elsevier Science, 1995. [4] P. Le-Clech, V. Chen, T.A.G. Fane, Fouling in membrane bioreactors used in wastewater treatment, Journal of Membrane Science 284 (2006) 17–53. [5] H. Susanto, H. Arafat, E.M.L. Janssen, M. Ulbricht, Ultrafiltration of polysaccharide–protein mixtures: elucidation of fouling mechanisms and fouling control by membrane surface modification, Separation and Purification Technology 63 (2008) 558–565. [6] T.R.N. Jost Wingender, H.-C. Flemming, Microbial Extracellular Polymeric Substances: Characterization, Structure and Function, Springer, 1999. [7] J.W. Costerton, R.T. Irvin, K.J. Cheng, The bacterial glycocalyx in nature and disease, Annual Review of Microbiology 35 (1981) 299–324. [8] B. Frolund, R. Palmgren, K. Keiding, P.H. Nielsen, Extraction of extracellular polymers from activated sludge using a cation exchange resin, Water Research 30 (1996) 1749–1758. [9] P.H. Nielsen, A. Jahn, R. Palmgren, Conceptual model for production and composition of exopolymers in biofilms, Water Science and Technology 36 (1997) 11–19. [10] T.R. Neu, Significance of bacterial surface-active compounds in interaction of bacteria with interfaces, Microbiological Reviews 60 (1996) 151–166. [11] M. Takeda, F. Nakano, T. Nagase, K. Iohara, J. Koizumi, Isolation and chemical composition of the sheath of Sphaerotilus natans, Bioscience Biotechnology and Biochemistry 62 (1998) 1138–1143. [12] H. Susanto, M. Ulbricht, High-performance thin-layer membranes for ultrafiltration hydrogel composite of natural organic matter, Water Research 42 (2008) 2827–2835. [13] S. Tsuneda, H. Aikawa, H. Hayashi, A. Yuasa, A. Hirata, Extracellular polymeric substances responsible for bacterial adhesion onto solid surface, FEMS Microbiology Letters 223 (2003) 287–292. [14] J. Tourney, B.T. Ngwenya, J.W. Fred Mosselmans, M. Magennis, Physical and chemical effects of extracellular polymers (EPS) on Zn adsorption to Bacillus licheniformis S-86, Journal of Colloid and Interface Science 337 (2009) 381–389. [15] E.M. Perdue, Solution thermochemistry of humic substances.1. Acid–Base equilibria of humic-acid, Abstracts of Papers of the American Chemical Society, 175 (1978) 123-123. [16] Stumm, Chemistry of the Solid–Water Interface, Wiley Interscience, New York, 1992. [17] S.-S. Cheng, K.K. Chittur, C.N. Sukenik, L.A. Culp, K. Lewandowska, The conformation of fibronectin on self-assembled monolayers with different surface composition: an FTIR/ATR study, Journal of Colloid and Interface Science 162 (1994) 135–143. [18] K.P.A.E.D. Goddard, Interactions of Surfactants with Polymers and Proteins, CRC Press, Boca Raton, 1993. [19] J.L. Ong, K.K. Chittur, L.C. Lucas, Dissolution/reprecipitation and protein adsorption studies of calcium phosphate coatings by FT-IR/ATR techniques, Journal of Biomedical Materials Research 28 (1994) 1337–1346. [20] S.N. Timasheff, G.D. Fasman, Structure and stability of biological macromolecules, Dekker, N.Y., 1969. [21] B.P. Frank, G. Belfort, Intermolecular forces between extracellular polysaccharides measured using the atomic force microscope, Langmuir 13 (1997) 6234–6240. [22] B.P. Frank, G. Belfort, Polysaccharides and sticky membrane surfaces: critical ionic effects, Journal of Membrane Science 212 (2003) 205–212. [23] I. Dogsa, M. Kriechbaum, D. Stopar, P. Laggner, Structure of bacterial extracellular polymeric substances at different pH values as determined by SAXS, Biophysical Journal 89 (2005) 2711–2720. [24] A. Omoike, J. Chorover, Spectroscopic study of extracellular polymeric substances from Bacillus subtilis: aqueous chemistry and adsorption effects, Biomacromolecules 5 (2004) 1219–1230. [25] B.V. Derjaguin, A theory of the heterocoagulation, interaction and adhesion of dissimilar particles in solutions of electrolytes, Progress in Surface Science 43 (1993) 60–73.
A. Sweity et al. / Journal of Membrane Science 378 (2011) 186–193 [26] A.T. Poortinga, R. Bos, H.J. Busscher, Reversibility of bacterial adhesion at an electrode surface, Langmuir 17 (2001) 2851–2856. [27] D. Violleau, H. Essis-Tome, H. Habarou, J.P. Croué, M. Pontié, Fouling studies of a polyamide nanofiltration membrane by selected natural organic matter: an analytical approach, Desalination 173 (2005) 223–238. [28] W.J.J. Gao, H.J. Lin, K.T. Leung, B.Q. Liao, Influence of elevated pH shocks on the performance of a submerged anaerobic membrane bioreactor, Process Biochemistry 45 (2010) 1279–1287. [29] Q. Li, M. Elimelech, Organic fouling and chemical cleaning of nanofiltration membranes: measurements and mechanisms, Environmental Science and Technology 38 (2004) 4683–4693. [30] Y. Yuan, J.E. Kilduff, Hydrodynamic modeling of NOM transport in UF: effects of charge density and ionic strength on effective size and sieving, Environmental Science & Technology 43 (2009) 5449–5454. [31] C. Jucker, M.M. Clark, Adsorption of aquatic humic substances on hydrophobic ultrafiltration membranes, Journal of Membrane Science 97 (1994) 37–52. [32] M.R. Teixeira, M.J. Rosa, pH adjustment for seasonal control of UF fouling by natural waters, Desalination 151 (2003) 165–175. [33] B.Z. Dong, Y. Chen, N.Y. Gao, J.C. Fan, Effect of pH on UF membrane fouling, Desalination 195 (2006) 201–208. [34] K. Ruohomäki, P. Väisänen, S. Metsämuuronen, M. Kulovaara, M. Nyström, Characterization and removal of humic substances in ultra- and nanofiltration, Desalination 118 (1998) 273–283. [35] I.A. Eydelnant, N. Tufenkji, Cranberry derived proanthocyanidins reduce bacterial adhesion to selected biomaterials, Langmuir 24 (2008) 10273– 10281. [36] X. Wang, C. Ruengruglikit, Y.W. Wang, Q. Huang, Interfacial interactions of pectin with bovine serum albumin studied by quartz crystal microbalance with dissipation monitoring: effect of ionic strength, Journal of Agricultural and Food Chemistry 55 (2007) 10425–10431. [37] T.H. Nguyen, M. Elimelech, Adsorption of plasmid DNA to a natural organic matter-coated silica surface: kinetics, conformation, and reversibility, Langmuir 23 (2007) 3273–3279. [38] M.V Voinova, M. Rodahl, M. Jonson, B. Kasemo, Viscoelastic acoustic response of layered polymer films at fluid–solid interfaces: continuum mechanics approach, Physica Scripta 59 (1999) 391–396.
193
[39] W. Ying, M. Herzberg, F. Yang, A. Bick, G. Oron, Hybrid growth membrane bioreactor (HG-MBR): the indirect impact of sludge retention time on membrane fouling, Desalination and Water Treatment 10 (2009) 27–32. [40] W. Ying, F. Yang, A. Bick, G. Oron, M. Herzberg, Extracellular polymeric substances (EPS) in a hybrid growth membrane bioreactor (HG-MBR): viscoelastic and adherence characteristics, Environmental Science & Technology 44 (2010) 8636–8643. [41] X. Huang, R. Liu, Y. Qian, Behaviour of soluble microbial products in a membrane bioreactor, Process Biochemistry 36 (2000) 401–406. [42] H. Liu, H.H.P. Fang, Extraction of extracellular polymeric substances (EPS) of sludges, Journal of Biotechnology 95 (2002) 249–256. [43] M. Dubois, K.A. Gilles, J.K. Hamilton, P.A. Rebers, F. Smith, Colorimetric Method for Determination of Sugars and Related Substances, 1956. [44] M.M. Bradford, Rapid and sensitive method for quantitation of microgram quantities of protein utilizing principle of protein–dye binding, Analytical Biochemistry 72 (1976) 248–254. [45] S.W. Provencher, CONTIN: a general purpose constrained regularization program for inverting noisy linear algebraic and integral equations, Computer Physics Communications 27 (1982) 229–242. [46] M. Elimelech, J. Gregory, X. Jia, R.A. Williams, Particle Deposition and Aggregation: Measurement, Modelling and Simulation, Butterworth-Heinemann, Oxford, United Kingdom, 1995. [47] I.R. Quevedo, N. Tufenkji, Influence of solution chemistry on the deposition and detachment kinetics of a CdTe quantum dot examined using a quartz crystal microbalance, Environmental Science & Technology 43 (2009) 3176–3182. [48] I.-S. Chang, P. Le Clech, B. Jefferson, S. Judd, Membrane fouling in membrane bioreactors for wastewater treatment, Journal of Environment Engineering 128 (2002) 1018. [49] U. Metzger, P. Le-Clech, R.M. Stuetz, F.H. Frimmel, V. Chen, Characterisation of polymeric fouling in membrane bioreactors and the effect of different filtration modes, Journal of Membrane Science 301 (2007) 180–189. [50] E.N. Lightfoot, Membrane separations technology: principles and applications: edited by R.D. Noble and S.A. Stern. Elsevier, 1995, 718 pp., Chemical Engineering Science 51 (1996) 325–326, ISBN0-444-81633-X.