Pharmacokinetic Modeling Framework for Quantitative Prediction of an ...
Recommend Documents
discovery. Trial and error synthesis of. Research article. Quantitative structure pharmacokinetic relationship modeling of. Cephalosporins: Elimination half-life.Missing:
Sep 7, 2012 - Lord Shiva College of Pharmacy, SIRSA â 125055 (Haryana) INDIA .... software (Cambridge Soft Corporation, Cambridge, MA) and energy ...
creased in proportion. The pharmacokinetic parameters. (mean standard deviation) characteristic of imipenem in- fused intravenously into RF rats at a dose of ...
Jul 21, 2003 - rates and extents of bacterial killing were similar with the IR and XR formulations at MICs ..... Emax is the maximal fractional increase in Kd (i.e.,.
formulation in daily doses of either 500 mg or 1,000 mg in ... performed using validated high-performance liquid chromatography procedures ... trations were measured by a conventional cup-agar diffusion test with Bacillus ... Weight (kg). 78.9.
Pharmaceutics and Pharmacokinetics, University Institute of Pharmaceutical Sciences ... Quantitative structure pharmacokinetic relationships (QSPR) have increasingly .... L. Shargel, Applied Biopharmaceutics and Pharmacokinetics, The ...
Mar 29, 2012 - ... Groepper3, C. Patrick Reynolds2, Clinton F. Stewart3, Richard B. Lock1* ...... Lock RB, Liem N, Farnsworth ML, Milross CG, Xue C, et al.
lease 9.2) were probed (Figure 1A; Supplementary Materi- als and Methods). .... validated mean squared error) and RF (randomForest pack- age version 4.6-7 ..... The role of site accessibility in microRNA target recognition. Nat. Genet., 39 ...
Feb 26, 2015 - Lastly, it is essential to subsume behavior as part of the discussion. ...... Chemelli RM, Willie JT, Sinton CM, Elmquist JK, Scammell T, Lee C, et al. Nar- colepsy in orexin .... Abbott LF, Varela JA, Sen K, Nelson SB. Synaptic ...
Oct 10, 2010 - The dynamic simulation of the metformin effect for a Type II diabetic patient is ... Keywords: Metformin, Modeling, Type II diabetes mellitus, ...
However, analytical methods used in pharmacokinetics (PK) studies of protein therapeutics are usually based on. ELISA, and therefore ... thus must meet certain criteria, ranges or specifications. By ..... Mass spectrometry grade lysyl endopeptidase (
Jun 1, 2017 - of tulathromycin in serum, (non-inflamed) transudate, and (inflamed) exudate ... were studied for serum, transudate, and exudate using a tissue ...
Indirect effect models failed to describe these data, which were ... mostatted chamber (27°C) and was allowed to recover for 4 days before catheter ... on the hard disk. ..... observed when the dose was reduced by 50%, and animals died.
Arch Toxicol 1996;70:347-355. 13. Bois FY, Jackson ET, Pekari K, Smith MT. Population toxicokinetics of benzene. Environ. Health Persp 1996;104:1405-1411.
QSPkR for biological half-life (t1/2) in humans for 28 quinolone drugs employing .... First of all, a worksheet was made in MS-Excel environment to load.
May 5, 2017 - 65â90. 0.12. Height (cm). 173.9. 149â193. 177.7. 169â195. 0.18. Gender. 21F/44M. -. 3F/11M ..... Sheiner LB, Beal SL. Some suggestions for ...
has been a PhD student at Digital Enterprise Research Institute, National University of Ireland,. Galway. His main research interests include methods for the ...
environment to support development of solutions to watershed management problems ... accommodating users of several different GIS software platforms. ..... characteristics can be used, or the user can provide custom data. ... Houston, TX.
be used for domestic border patrol [26], traffic congestion monitoring [22], and cargo ..... In the next section we will apply combinations of these characteristics.
1Faculty of Engineering Technology, Department of Engineering Fluid Dynamics, University of Twente, The Netherlands ... 219 Part J: J. Engineering Tribology ...
Apr 26, 2013 - Purpose: The performance of an optimistic parallel discrete event simulator (PDES) in .... from a typical AS-level topology consisting of 23,000 ASs and 96,000 BGP peering links ..... else if current-event exists in event-list-history
*School of Pharmacy, University of Lausanne, Place du Chateau. 3, CH-1005 ... tration course, i.e., the pharmacokinetics of the drug, ...... Acta Pharm. Tech.
Michigan 48640; and §Toxicology, Health and Environmental Sciences, Dow Corning Corporation, Midland, Michigan 48686. Received June 27, 2000; ...
Melvin E. Andersen,* Ramesh Sarangapani,â ,1 Richard H. Reitz,â¡ Robert H. Gallavan,§. Ivan D. Dobrev,* and ... partition coefficient (Pf:b. 550). .... mainly via exhaled breath and urine, and to a much lesser extent in the feces. Whereas the ...
Pharmacokinetic Modeling Framework for Quantitative Prediction of an ...
Mar 26, 2014 - improve prediction accuracy of potential herbâdrug interactions using the semipurified milk thistle preparation, silibinin, as an exemplar herbal ...
Physiologically Based Pharmacokinetic Modeling Framework for Quantitative Prediction of an Herb–Drug Interaction SJ Brantley1, BT Gufford2, R Dua1, DJ Fediuk1, TN Graf3, YV Scarlett4, KS Frederick5, MB Fisher6, NH Oberlies3 and MF Paine2
Herb–drug interaction predictions remain challenging. Physiologically based pharmacokinetic (PBPK) modeling was used to improve prediction accuracy of potential herb–drug interactions using the semipurified milk thistle preparation, silibinin, as an exemplar herbal product. Interactions between silibinin constituents and the probe substrates warfarin (CYP2C9) and midazolam (CYP3A) were simulated. A low silibinin dose (160 mg/day × 14 days) was predicted to increase midazolam area under the curve (AUC) by 1%, which was corroborated with external data; a higher dose (1,650 mg/day × 7 days) was predicted to increase midazolam and (S)-warfarin AUC by 5% and 4%, respectively. A proof-of-concept clinical study confirmed minimal interaction between highdose silibinin and both midazolam and (S)-warfarin (9 and 13% increase in AUC, respectively). Unexpectedly, (R)-warfarin AUC decreased (by 15%), but this is unlikely to be clinically important. Application of this PBPK modeling framework to other herb– drug interactions could facilitate development of guidelines for quantitative prediction of clinically relevant interactions. CPT Pharmacometrics Syst. Pharmacol. (2014) 3, e107; doi:10.1038/psp.2013.69; published online 26 March 2014 Herbal products represent an ever-increasing component of Western pharmacotherapy due in part to the perception that “natural” equates with safety. Current regulatory oversight of herbal products in many Western countries, including the United States, does not include evaluation of drug interaction liability prior to marketing. Consequently, systematic approaches for quantitative prediction of both the magnitude and likelihood of herb–drug interactions are nonexistent. Drug interaction liability assessment of herbal products is more challenging than for conventional drugs because unlike most drug products, herbal products typically are mixtures of bioactive constituents that vary substantially between preparations.1–3 Compounding this complexity is the often scant knowledge of specific causative constituents or systemic exposure of such constituents. Due to incomplete absorption and extensive presystemic clearance, herbal product constituents may reach sufficient concentrations in the intestine and liver to inhibit only first-pass extraction of sensitive substrates.4 Consequently, traditional (static) prediction approaches frequently do not translate to the clinical setting for herb–drug interactions. Recent drug–drug interaction guidelines suggest dynamic modeling and simulation approaches to predict complex interactions.5,6 Extension of this approach to herb–drug interactions is a logical step to facilitate prospective evaluation of these interactions. As with drug–drug interactions,7,8 physiologically based pharmacokinetic (PBPK) modeling may be used to improve in vitro to in vivo extrapolation of herb–drug interactions. Well-characterized herbal products are needed to develop a quantitative framework.
Milk thistle preparations are top-ten selling herbal products in the United States.9 The crude extract, silymarin, contains at least seven flavonolignans and one flavonoid.10 The semipurified extract, silibinin, contains roughly a 1:1 mixture of the flavonolignans silybin A and silybin B and represents an exemplar herbal product for initial model development. First, silybin A and silybin B have been purified in quantities sufficient to recover requisite in vitro parameters.11,12 Second, in vitro studies have demonstrated both reversible and mechanism-based inhibition of the key drug metabolizing enzymes CYP2C913–15 and CYP3A4.13,14,16 Third, in vitro to in vivo extrapolation has been inconsistent.17–19 Based on these observations, the objective of this work was to advance the mechanistic understanding of this herb–drug interaction using PBPK modeling and simulation with warfarin and midazolam as probe substrates. The models were evaluated through a proof-of-concept clinical study in healthy volunteers. Results could help develop guidelines for prospective evaluation of herb–drug interaction liability. RESULTS Modeling and simulation PBPK model generation and initial evaluation. Simulated probe substrate concentrations closely approximated previously published concentration–time profiles for both warfarin20 and midazolam21 under baseline conditions (data not shown). Model-predicted primary endpoints (area under the curve (AUC) and Cmax for (S)-warfarin and midazolam) were within the prespecified criterion (30%) for acceptable model performance (Table 1).
1 Eshelman School of Pharmacy, The University of North Carolina at Chapel Hill, Chapel Hill, North Carolina, USA; 2College of Pharmacy, Washington State University, Spokane, Washington, USA; 3Department of Chemistry and Biochemistry, The University of North Carolina at Greensboro, Greensboro, North Carolina, USA; 4School of Medicine, The University of North Carolina at Chapel Hill, Chapel Hill, North Carolina, USA; 5Boehringer Ingelheim Pharmaceuticals, Inc., Ridgefield, Connecticut, USA; 6 ProPharma Services, LLC, Oxford, Connecticut, USA. Correspondence: MF Paine ([email protected]) Received 12 August 2013; accepted 28 October 2013; advance online publication 26 March 2014. doi:10.1038/psp.2013.69
PBPK Modeling Framework for Quantitative Prediction of an Herb–Drug Interaction Brantley et al.
2 Table 1 Comparison of previously published and model-predicted pharmacokinetic outcomes Outcome
AUC0–inf, area under the concentration–time curve from time zero to infinity; AUC0–8, AUC from 0–8 hours; Cmax, maximal concentration; Cl/F, apparent oral clearance; t1/2, terminal half-life; tmax, time to maximal concentration. a Geometric or arithmetic means and coefficients of variation (%) unless indicated otherwise. bPoint estimates. c,e–gPreviously published outcomes from refs. 20,21,18,26, respectively. dModel predictions were considered accurate if the primary outcomes ((S)-warfarin and midazolam AUC and Cmax)) were within 30% of previously published outcomes. hDue to the sparse nature of the previously published data, a modified Bailer method (available in Phoenix WinNonlin) was used to recover t1/2, AUC0–8, and Cl/F; accuracy was not calculated based on the sparse data and the 30% criterion being applicable only to the victim drugs.
CPT: Pharmacometrics & Systems Pharmacology
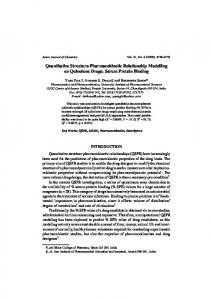
Figure 1 Mean concentration–time profile (0–6 hours) of midazolam in 19 healthy volunteers following an 8 mg oral midazolam dose given alone (open symbols) or following a 14-day treatment with milk thistle product (solid symbols).18 Lines denote physiologically based pharmacokinetic model simulations of the midazolam concentration– time profile when given alone (black) or with milk thistle (green). The dotted green line denotes incorporation of reversible inhibition of CYP3A, whereas the dashed green line denotes incorporation of mechanism-based inhibition of CYP3A. Symbols and error bars denote observed means and SDs, respectively, and were obtained from ref. 18.
Prediction of silibinin–drug interaction magnitude. Simulations of a previously reported milk thistle-midazolam interaction, assuming reversible CYP3A inhibition solely due to silybin A and silybin B, demonstrated negligible changes in the midazolam concentration–time profile (Figure 1). The milk thistle product tested, silymarin, contained 100 mg of silybin A and 180 mg of silybin B and was administered daily for 14 days.18 Simulations assuming mechanism-based CYP3A inhibition predicted a 30% and 60% increase in midazolam Cmax and AUC, respectively; increases of 6% and 3% in midazolam Cmax and AUC, respectively, were reported18 (Figure 1). Simulations of the silibinin–warfarin interaction with a higher dose of silibinin (1,650 mg/day, or 720 mg silybin A plus 930 mg silybin B/day; see below), assuming reversible CYP2C9 inhibition only, predicted negligible changes (