The Journal of Neuroscience, January 8, 2014 • 34(2):493–505 • 493
Behavioral/Cognitive
Phase-Amplitude Coupling in Rat Orbitofrontal Cortex Discriminates between Correct and Incorrect Decisions during Associative Learning Marijn van Wingerden,1,3 Roemer van der Meij,4 Tobias Kalenscher,3 Eric Maris,4 and Cyriel M.A. Pennartz1,2 1Center for Neuroscience, Faculty of Science, and 2Research Priority Program Brain and Cognition, University of Amsterdam, 1090 GE Amsterdam, the Netherlands, 3Institute of Experimental Psychology, Heinrich-Heine University Du¨sseldorf, Universitaetsstrasse 1, D-40225 Du¨sseldorf, Germany, and 4Radboud University Nijmegen, Donders Institute for Brain, Cognition and Behaviour, 6525 HR Nijmegen, The Netherlands
Cross-frequency interactions between oscillations in local field potentials (LFPs) are thought to support communication between brain structures by temporally coordinating neural activity. It is unknown, however, whether such interactions differentiate between different levels of performance in decision-making tasks. Here, we investigated theta (4 –12 Hz) to gamma (30 –100 Hz) phase-amplitude coupling in LFP recordings from rat orbitofrontal cortex. Across subsequent periods of a task in which rats learned to discriminate two odors associated with positive and negative outcomes, theta-to-gamma phase-amplitude coupling (PAC) was highest during the odor-sampling task period that preceded a Go/NoGo decision. This task-dependent modulation could not be explained by changes in oscillatory power and appeared to be time-locked to odor onset, not to the timing of the behavioral response. We found that PAC strength during odor sampling correlated with learning, as indexed by improved performance across trials. Moreover, this increase in PAC magnitude was apparent only on trials with correct Go and NoGo decisions, but not incorrect Go decisions. In addition, we found that PAC preferred coupling phase showed consistency over sessions only for correct, but not incorrect trials. In conclusion, orbitofrontal cortex theta-gamma PAC strength differentiates between different levels of performance in an olfactory decision-making task and may play a role in the generation and utilization of stimulus-based outcome predictions, necessary for adaptive decision-making. Key words: decision-making; learning; OFC; PAC; rat; tetrode
Introduction The orbitofrontal cortex (OFC) plays a key role in the adjustment of ongoing behavior. In particular, OFC is suggested to update expected outcome representations when rules linking stimuli to outcomes are changed, as both humans and animals with orbitofrontal damage show impairments adjusting their choice behavior after such changes (Rolls et al., 1994; Baxter et al., 2000; Schoenbaum et al., 2002; Fellows and Farah, 2003). The OFC seems especially implicated when model-based, as opposed to model-free, representation of stimuli or states are required for successful behavioral performance (Takahashi et al., 2009; McDannald et al., 2011, 2012). OFC spike patterns reflect the relative value of cues in a context-dependent manner, both at the single unit and population level (Schoenbaum et al., 1998; Tremblay and Schultz, 1999; Hikosaka and Watanabe, 2000; Wallis and Miller, 2003; PadoaReceived May 17, 2013; revised Oct. 31, 2013; accepted Nov. 17, 2013. Author contributions: M.v.W. and C.M.A.P. designed research; M.v.W. performed research; R.v.d.M. and E.M. contributed unpublished reagents/analytic tools; M.v.W. and R.v.d.M. analyzed data; M.v.W., R.v.d.M., T.K., E.M., and C.M.A.P. wrote the paper. Correspondence should be addressed to Cyriel Pennartz, Center for Neuroscience, Faculty of Science, University of Amsterdam, PO Box 94216, 1090 GE Amsterdam, The Netherlands. E-mail:
[email protected]. DOI:10.1523/JNEUROSCI.2098-13.2014 Copyright © 2014 the authors 0270-6474/14/340493-13$15.00/0
Schioppa and Assad, 2006; van Duuren et al., 2008). Lacking direct output to primary motor structures (Cavada et al., 2000; Ongu¨r and Price, 2000; Groenewegen and Uylings, 2010; Hoover and Vertes, 2011), it is hypothesized that OFC transmits information about expected outcome to connected structures such as the basolateral amygdala, striatum, and autonomous brainstem centers, to contribute to stimulus-specific reward predictions and prediction errors to influence behavior (Hare et al., 2008; Takahashi et al., 2009; Pennartz et al., 2011a; Schoenbaum et al., 2011; McDannald et al., 2012). Efficient cross-structural communication is thought to require a mechanism by which changes in the excitability of connected structures are synchronized. Synchronized synaptic activity, as observed in local field potentials (LFPs), exhibits oscillatory patterns in different frequency bands that covary with neuronal excitability and can become coherent between structures (Buzsa´ki and Draguhn, 2004; Fries, 2005; Canolty et al., 2006, 2010; Womelsdorf et al., 2007; Schroeder and Lakatos, 2009). Interactions between oscillations with different frequencies have been found as phase-amplitude coupling (PAC) where the phase of a slow oscillation modulates the amplitude of a faster oscillation. In the rodent brain, PAC has been examined especially in the entorhinal cortex (Chrobak and Buzsa´ki, 1998) and hippocampus (Bragin et al., 1995; Chrobak and Buzsa´ki, 1998; Lisman,
494 • J. Neurosci., January 8, 2014 • 34(2):493–505
2005; Colgin et al., 2009). PAC may also occur across structures (Sirota et al., 2008; Tort et al., 2008; Maris et al., 2011; van der Meij et al., 2012). Recent reports have related PAC to contextbased rule retrieval (Tort et al., 2009) and to working memory (Fujisawa and Buzsa´ki, 2011). However, it remains unclear whether and how PAC is involved in associative stimulus–reward learning and decision-making. If PAC plays a functional role in this type of learning through temporal patterning of mass activity, it can be hypothesized that changes in PAC strength should correlate with task performance. We quantified PAC using weighted phase-locking factors (wPLFs; Maris et al., 2011; van der Meij et al., 2012) and found event-related PAC between theta and gamma frequencies in OFC recordings of rats engaged in a two-odor associative learning task. During odor sampling, PAC increased in a learning-dependent fashion and was significantly stronger when it preceded correct versus incorrect decisions.
Materials and Methods Behavioral task. The general behavioral paradigm and recording methods have been reported previously (van Wingerden et al., 2010a,b, 2012). Briefly, we recorded LFPs and single unit data from three male Wistar rats engaged in an olfactory decision making task (10 sessions total; Fig. 1). Rats sampled odorants by making a nose poke into an odor port equipped with infrared photobeams, which precisely registered the onset and offset of the poke. Odor pokes were required to last at least 750 ms. Contingent on rules linking stimuli to outcomes, animals decided to make a “Go” response (locomotion to fluid well, waiting and subsequent outcome delivery) or a “NoGo” response (refraining from entering the fluid well for 5 s. poststimulus). Upon entering the fluid well, the delivery of outcome was delayed by 1000 ms. Novel odorants were used on each session. Go/NoGo trials were pseudorandomly ordered in blocks of five plus five trials. Four trial types were isolated, according to signal detection conventions: Hits (Go responses resulting in positive outcome; HIT), False Alarms (Go responses resulting in negative outcome; FA), Correct Rejections (NoGo responses, correctly avoiding negative outcome; CREJ), and Misses (incorrect NoGo responses; these rarely occurred and were not further analyzed; Fig. 1). HIT and CREJ trials were scored as “correct”, MISS and FA trials as “incorrect”. Acquisition of task rules was indexed by generating instantaneous performance scores: the proportion of correct decisions (HITs and CREJ trials) in a 20-trial sliding window. This approach yielded a time-resolved performance index, with values ranging from 55 to 95% correct performance in steps of 5%. When rats performed at or above a behavioral criterion of 85% correct (see Fig. 4A), the session was terminated or, in some cases, a reversal of task contingencies followed (not further analyzed here). Surgical procedures. Animals were anesthetized by injecting 0.08 ml/ 100 g Hypnorm (0.2 mg/ml fentanyl, 10 mg/ml fluanison; VetaPharma) intramuscularly followed by 0.04 ml/100 g Dormicum (5 mg/ml midazolam; Roche) subcutaneously. A microdrive, holding 14 individually moveable tetrode drivers, was implanted onto the left hemisphere dorsal to the OFC with tetrode placements from ⫹2.6 to ⫹4.0 mm AP and ⫺2.0 to ⫺3.6 mm ML of bregma and recordings sampled from ⫺3.0 to ⫺5.0 mm DV). The drivers were loaded with 11 or 12 tetrodes and two reference electrodes. Immediately after surgery, all tetrodes and reference electrodes were advanced 0.8 mm into the brain and subsequently advanced in daily steps to the upper border of the OFC according to a standardized rat brain atlas (⫾ ⫺3.0 mm DV; Paxinos and Watson, 2007). The reference electrodes were lowered to a depth of 1.2–2.0 mm ending up initially ⬃1.0 mm dorsal to the set of recording electrodes and adjusted to minimize spiking activity on the reference channel. A stainless steel screw, positioned in the left parietal bone, served as ground.
Electrophysiology Using a 64-channel Neuralynx system, we recorded from an array of 11–12 tetrodes (Gray et al., 1995), with a reference electrode placed in the supplemental motor cortex dorsal to OFC. Signals were referenced on-
van Wingerden et al. • Phase-Amplitude Coupling in Rat Orbitofrontal Cortex
line and LFPs were extracted from each tetrode by low-pass filtering the continuously sampled (at 1874 Hz) signal between 1 and 475 Hz. Events in the behavioral task were coregistered and time-stamped by the Cheetah system. Histological verification indicated that most recordings were made from ventral and lateral orbitofrontal (VO/LO) and agranular insular (AI) cortex with some spread into dorsolateral orbitofrontal cortex (Paxinos and Watson, 2007). PAC. To quantify PAC between different frequencies recorded from OFC LFPs, we computed wPLFs (van der Meij et al., 2012). This PAC measure captures the consistency of phase-amplitude locking between two oscillatory processes, yielding a magnitude and preferred phase. These coefficients were calculated using output from a time-resolved spectral analysis. Spectral analysis consisted of convolving LFP signals in a 600 ms window with complex-valued wavelets, one for every frequency of interest. All wavelets were constructed by element-wise multiplication of three-cycle complex exponentials at the frequency of interest with a Hanning taper of equal length. Only those frequencies for which the wavelet had a unique integer number of samples per cycle were obtained, yielding a frequency resolution of ⬃1 Hz for the frequencies up to 20 Hz and a resolution of ⬃4 Hz for the frequencies up to 100 Hz. Next, we entered the obtained complex-valued signal, incorporating phase and amplitude from one electrode (ch1) and the amplitude-envelope from another electrode (ch2) into the wPLF function. The wPLF is itself complex-valued, and represents on the one hand a normalized index of the consistency of the relation of amplitude from ch2 with the phase of ch1 over trials, and on the other hand the preferred coupling phase, separately for all frequency combinations. This can be visualized in a magnitude or phase bispectrum (see Fig. 1 for magnitude). Further analyses were performed in Matlab, using custom-made scripts. Circular statistics were computed using CircStat, an open-source Matlab toolbox (Berens, 2009). Because all channels were online referenced against one of two reference tetrodes outside the OFC, our results could in principle be confounded by PAC occurring on the reference channels. To control for the possibility of an external source, we re-referenced all recording channels in a separate analysis by subtracting the mean of all channels, thereby minimizing the impact of a global (external) oscillatory structure shared by all channels on wPLF measures, and report the results along with the main findings. Selection of physiologically relevant PAC. We were interested in the possible interaction of theta-band frequencies (4 –12 Hz) and gammarange rhythms (30 –100 Hz). Therefore, we sorted the channels per session according to theta power, averaged over trials in the time window of interest, and separately, also according to averaged gamma power. We selected the four channels with highest theta and gamma power as phase or amplitude-providing channels per session, respectively. Because wavelet coefficients obtained from the same channel can show spurious coupling artifacts, we only report on wPLFs obtained from betweenchannel pairs (yielding in total max; N ⫽ 16 selected channel combinations per session). Selection of the channels with high-power in the theta or gamma range (i.e., based on a univariate characteristic of the channels) ensures reliable theta phase estimation and sufficient physiological gamma band activity, thereby improving the precision of the wPLF measure (a bivariate characteristic of the signals). High theta or gamma power by itself, however, does not imply larger wPLF magnitude (see Figs. 6, 7). For comparison, corresponding findings using all channel pairs are also reported along with the main findings. Exploratory analyses indicated that, for both S⫹ and S⫺ type trials, a cluster with high wPLF magnitude could be found in the frequency pair combinations resulting from combining the 7–12 Hz interval for phase-providing channels and the 50 –70 Hz interval for amplitude-providing channels (black boxes in Fig. 2B). Further results are reported from this frequencies of interest (FOI) window. In the main analysis, wPLFs were averaged per session (13–15 wPLFs from channel combinations averaged into a mean wPLF per session per trial type). As a control analysis, the main findings were replicated using session-level averages created from the full set of all 110 channel-combination pairs in a session. The results of these control analyses are presented along the main analysis. Selection of optimal PAC window. Based on previous research, we hypothesized that theta-gamma PAC would be most prominent in the early
van Wingerden et al. • Phase-Amplitude Coupling in Rat Orbitofrontal Cortex
psd
Amplitude frequency (Hz)
Time from odor onset [s] -0.5 135 105 86 70 54 38 26 18 13 9 5 9
0
0.5
1
100 ms
0.12 0.08 0.04 0
18 38 70 105 189 5 9
18 38 70 105 189
iti
135 105 86 70 54 38 26 18 13 9 5 9
5 9
18 38 70 105 189 5 9
psd
Time from odor onset [s] -0.5 Amplitude frequency (Hz)
Go: HIT NoGo: MISS
odor A (S+)
18 38 70 105 189 5 9
18 38 70 105 189
NoGo: CREJ Go: FA
odor B (S-) 0
0.5
1
100 ms
0.12 0.08 0.04 0
18 38 70 105 189 5 9
18 38 70 105 189
5 9
18 38 70 105 189 5 9
PAC (wPLF magn)
iti
18 38 70 105 189 5 9
PAC (wPLF magn)
A
J. Neurosci., January 8, 2014 • 34(2):493–505 • 495
18 38 70 105 189
Phase-providing frequency (Hz)
B A(raw)
A(Gamma)
A(G-env)
P(theta)
P(raw)
0
0.2
0.4
0.6
0.8
1
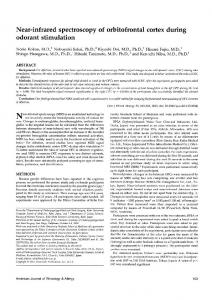
Time from odor onset (s) Figure 1. Theta-gamma PAC occurs time-locked to odor sampling. A, Trial types with odors predicting positive outcome (S⫹, top) and negative outcome (S⫺, bottom) were analyzed separately. The bispectra show wPLF magnitude averaged over a representative session in 600 ms windows, time-locked to the colored time indices shown in the trial outlines. Colors indicate a magnitude scale from low (blue) to high (red) wPLF magnitude. PAC occurs between comparable frequencies for both S⫹ and S⫺ trial types. Note the appearance of PAC between theta and gamma frequencies only after rats enter the odor port. iti, Intertrial interval; psd, prestimulus-delay. B, The unfiltered LFP signals for the phase-providing channel [P(raw)] and amplitude-providing channel [A(raw)] in a PAC pair, recorded on different tetrodes, are plotted against time from odor onset in a single S⫹ trial. In red, the phase-providing LFP trace bandpass filtered for theta (4 –12 Hz) is shown [P(theta)], whereas in blue, the amplitude-providing LFP trace filtered for gamma (30 –100 Hz) is depicted [A(gamma)]. In green, the envelope (smoothed squared amplitude) of the gamma-filtered signal is shown [A(G-env)]. Red vertical lines indicate peaks (solid lines) and troughs (dashed lines) of the theta cycles; green vertical lines indicate local maxima of the gamma amplitude envelope, showing consistent timing relative to the theta cycle.
van Wingerden et al. • Phase-Amplitude Coupling in Rat Orbitofrontal Cortex
496 • J. Neurosci., January 8, 2014 • 34(2):493–505
*
*
normalized wPLF magn
normalized wPLF magn
*
PAC (wPLF magn)
Amplitude frequency (Hz)
PAC (wPLF magn)
odor sampling period, where increases in oscilA C D 0.01 latory power and spike-field synchronization S+ trials 0.02 in these frequency bands coexist (van Wing0.12 S- trials 0 erden et al., 2010b; Pennartz et al., 2011b). We 0.01 used an event-related method for calculating PAC, by concatenating complex-valued 0.08 −0.01 ALL CHANNELS 0 wPLFs, obtained from 600 ms windows, over 0.01 trials, thereby retaining high temporal resolu−0.01 0.04 tion within trials with respect to behavioral 0 events. To determine an optimal window for −0.02 −1.5 −1 −0.5 0 0.5 1 RE-REFERENCED detecting wPLF magnitude, we used a sliding all S+ all S- HIT CREJ FA −0.01 HIT CREJ FA window approach, calculating magnitudes Trial Type Time from odor onset (s) (from the previously established FOI window) B HITS FALSE ALARMS per session in blocks of 600 ms. We next moved 189 0.1 this analysis window from ⫺1.4 to ⫹1.4 s rel135 ative to odor onset, yielding 12 windows of 600 105 ms centered on time points from ⫺1.1 to ⫹1.1 0.08 76 s stepped in 200 ms increments (Figs. 2A, 4B– 50 D). We narrowed this period down to the time 0.06 34 window that resulted in the highest wPLF mag28 nitudes, averaged across sessions and for both 0.04 16 odor exemplars (selected window: centered at 18 ⫹0.5 s after odor onset, spanning from ⫹0.2 to 0.02 3 ⫹0.8 s after odor onset). 9 Comparisons between trial types: magnitude, 5 9 13 18 26 38 54 70 105 189 5 9 13 18 26 38 54 70 105 189 preferred phase, and phase concentration. As a Phase frequency (Hz) Phase frequency (Hz) first step, whole session averages were constructed for wPLF magnitudes taken from this selected time window, per trial type. To facili- Figure 2. PAC strength: comparisons between trial types. A, Group averages (mean ⫾ SE over all sessions) of wPLF magnitudes tate comparison across sessions, wPLF magni- in 600 ms sliding windows. Peak magnitudes occur at 500 ms after odor onset for both S⫹ odor-sampling periods (purple) and S⫺ tudes were mean-normalized between trial odor-sampling periods (orange). Black line indicates significant differences (*p ⬍ 0.05, Wilcoxon matched pairs signed rank test). types under comparison (i.e., once for the B, Bispectrum of wPLF magnitude taken from the optimal PAC window (⫹200 to ⫹800 ms after odor onset), averaged across all S⫹/S⫺ trial comparison and once for HIT, selected channel combinations. Left, HIT trials; Right, FA trials. Black box indicates FOI ⫻ FOI window used in further analyses. C, CREJ, and FA trials). Normalized wPLF mag- Group averages of mean-normalized wPLF magnitude (wPLF magnitudes for each trial type from which the common mean was nitude was compared between conditions at subtracted; this mean was computed across all trial types) across selected channels over sessions. wPLF magnitude was calculated the session-average level (N ⫽ 10; Fig. 2C,D) for the optimal PAC window (⫹200 – 800 ms after odor onset) and split according to trial type. S⫹ trials (purple) showed using paired tests. The bispectrum across the significantly larger wPLF magnitude than all S⫺ trials considered together (orange; p ⬍ 0.05, Wilcoxon test). This difference could full range of analyzed frequencies is shown in be unpacked into a significant difference between HIT and FA trials ( p ⬍ 0.05), whereas the other comparisons were not signifiFigure 2B for HIT and FA trial types. The cir- cant. Misses rarely occurred and were not further analyzed. D, As in C, but now showing mean-normalized wPLF magnitude for the cular distribution of preferred coupling phase control dataset that comprised session means averaged over wPLFs obtained from all channel combinations in a session (N ⫽ 110 relations was assessed by performing Ray- per session). E, As in C, but now showing mean-normalized wPLF for the re-referenced dataset. leigh’s test for circular uniformity on the pretime-resolved performance and neural measures using averages per ferred coupling phase distribution per trial type. To evaluate differences performance bin per session, pooled over sessions (one data point per in mean coupling phase between conditions, we calculated pairwise cousession per performance bin; Fig. 3C). To corroborate this correlationpling phase differences between conditions for each channel combinabased analysis, the change in wPLF magnitude from the block of trials tion and tested whether the mean phase of the resulting distribution of with behavioral performance lower than 70% to the block of trials with coupling phase differences was significantly different from zero. To asperformance ⬎85% (⌬wPLF) was calculated per trial type. ⌬wPLF valsess differences in the concentration of preferred coupling phases across ues were compared against zero and between trial types. sessions, we fitted a Von Mises circular normal distribution to the circuAdditional behavioral parameters (i.e., odor sample time, reaction lar distribution of the coupling phases within sessions, yielding the time from odor port to fluid well) were similarly converted to four trial concentration variable per trial type. To compare values between time-resolved parameters and correlated to time-resolved wPLF trial types across sessions, values were Z-scored across trial types magnitudes. within sessions. Subsequently, paired t tests on Z-scored values were Analysis of changes in wPLF magnitude within sessions. To compare the carried out. evolution of PAC strength directly to the learning curve within sessions, Correlations between PAC and behavioral parameters. To assess controlling for different session durations, we used linear interpolation whether changes in PAC scores are related to behavioral learning, we to generate equal-length time series of 50 estimates of wPLF magnitudes performed a correlation analysis between wPLF magnitudes and behavper trial type. Next, we pooled the interpolated data points from all ioral performance. First, we calculated time-resolved wPLF magnitudes sessions and computed Pearson’s correlation coefficients with 95% conby averaging wPLF magnitudes using a sliding window block of four fidence intervals between trial number and the pooled interpolated wPLF trials, per trial type. Second, we extracted the time-resolved behavioral magnitude, separately for each trial type. This analysis could potentially performance scores (ranging from 55 to 95% in steps of 5%; chance level reveal dynamics in PAC strength nonspecific to trial type but instead at 50%, see above) for each trial. Third, per trial type within a session, we related to the passage of time. Alternatively, divergent patterns of PAC normalized wPLF magnitudes by subtracting their mean and dividing by strength evolution between trial types would favor an explanation that their SD across trials (Z-scoring, per trial type). Finally, we calculated R 2 links PAC to learning stimulus-outcome contingencies. values for regressions of Z-scored wPLF magnitude, averaged per perforControlling for fluctuations in theta power in phase-providing chanmance bin across sessions, on behavioral performance scores (Fig. nels. Because wPLF magnitude, and indeed any measure of PAC strength, 3 A, B). This analysis was performed both using pooled wPLF magnitudes depends on accurate estimation of the phase of the phase-providing frefrom all three trial types (Fig. 3A), and also separately per trial type (Fig. quency, power differences in the phase-providing frequency between 3B). We also computed Pearson correlation coefficients between these
van Wingerden et al. • Phase-Amplitude Coupling in Rat Orbitofrontal Cortex
J. Neurosci., January 8, 2014 • 34(2):493–505 • 497
PAC (z−scored wPLF)
A
tion analysis between wPLF and performance. We also computed Pearson’s correlation coefficients with 95% confidence intervals between trial number and theta power, separately for each trial type, averaging the theta power over the four selected channels and across the selected frequencies (4 –12 Hz; see Fig. 6). Anatomical distribution of PAC scores. To assess whether PAC strength increases as a function of recording depth, whole-session wPLF magnitudes were extracted per channel pair. As each rat contributed at least three sessions, these sessions were categorized as “superficial,” “intermediate,” or “deep,” based on position in the recording order for that rat. wPLF magnitudes per channel pair were averaged across depth level and Z-scored within a channel pair to facilitate aggregation across sessions. Subsequently, Z-scored wPLF magnitudes were averaged into session means and pairwise comparisons were made between wPLF means at the session level for the different depth levels. In 2 of 3 rats (N ⫽ 7 of 10 sessions), recordings were made with a circular tetrode arrangement. This tetrode placement layout allows at least a crude analysis of the distribution of PAC strength based on anatomical location. wPLF magnitudes were sorted according to phaseproviding channel and according to amplitude-providing channel. To combine data from all seven sessions, wPLF magnitudes across channels were normalized between 0 and 1 within a session and compared between anatomical quadrants (posteromedial, posterolateral, anterolateral, and anteromedial).
2
R : 0.97 R2: 0.93 R2: 0.87
0.4 0.2 0 −0.2
selected channels all channels re-referenced
−0.4
60
70
80
90
PAC (z−scored wPLF)
B 1
R2: 0.64 R2: 0.54 R2: 0.14
0.5
0
Results We trained rats (N ⫽ 3) to make Go–NoGo decisions in a twoodor discrimination associative learning task (Fig. 1A). In each session (N ⫽ 10 sessions in total) of this task, animals must learn to discriminate between a pair of novel odors. One odor (S⫹) is predictive of reward (sucrose solution) when followed by a Go response, whereas a second odor (S⫺) is predictive of an aversive outcome (quinine solution) if followed by a Go response.
−0.5
−1
60 70 80 90 Performance (% correct trials) 0.4
***
D
*
PAC (∆wPLF)
corr.coef.
C 0.2 0 −0.2
0.01 0
*** *** * a
a b
−0.01
−0.4 HIT
CREJ
FA
HIT CREJ
FA
Figure 3. PAC strength correlates with behavioral performance. A, wPLF magnitudes (computed with a four-trial sliding window) were z-scored within sessions and binned according to behavioral performance (percentage correct trials in a 20-trial sliding window) across all channel pairs in all sessions. A linear regression between performance bin and z-scored wPLF magnitude, averaged per bin across all sessions, was significant for the dataset with selected channels (R 2 ⫽ 0.97, p ⬍ 0.001; black), the dataset with all channel combinations (R 2 ⫽ 0.93, p ⬍ 0.001; dark gray) and the re-referenced dataset (R 2 ⫽ 0.87, p ⬍ 0.001; light gray). Circle diameter indicates relative N of trials in that performance bin; error bars, SEM. (B) As in A, but now split according to trial type. Blue: HIT (R 2 ⫽ 0.64; r ⫽ 0.80, p ⬍ 0.05); Green: CREJ (R 2 ⫽ 0.54, r ⫽ 0.73, p ⬍ 0.05); Red: FA (R 2 ⫽ 0.14; r ⫽ ⫺0.38, p ⫽ 0.40). C, Pearson correlations coefficients with confidence intervals for HIT (r ⫽ 0.23; 95% CI: 0.12– 0.34; p ⬍ 0.001, blue), CREJ (r ⫽ 0.13; CI: 0.01– 0.26; p ⬍ 0.05, green) and FA trials (r ⫽ ⫺0.09; CI: ⫺0.30 to 0.14; n.s.) for correlations between z-scored wPLF magnitude, averaged per performance bin per session, pooled across all sessions (yielding 1 value per performance bin per session). D, Differences in wPLF magnitude between high and low performance bins per trial type (⌬wPLF) for HIT (mean ⫾ SEM: 0.012 ⫾ 0.003, p ⬍ 0.0001 one-sample t test against 0; blue), CREJ trials (0.013 ⫾ 0.003, p ⬍ 0.0001; green), and FA trials (⫺0.010 ⫾ 0.004, p ⬍ 0.05; red). Letters indicate groups that differ from each other. Both HIT and FA trials, as well as CREJ and FA trials, differed at p ⬍ 0.001 (t test). The difference between HIT and CREJ trials was not significant. trials or conditions being compared will affect the signal-to-noise ratio of the estimated phase. To examine this potential confound, we computed the correlation between behavioral performance and mean normalized theta power, averaged at the session level, analogous to the correla-
Behavioral results A typical trial begins with the onset of a light stimulus, followed by a nose poke into an odor chamber. Here, the animal samples one of two odors and decides whether or not to collect an associated outcome in a fluid well, located at the other side of the operant cage (Go response). In the course of learning, animals make Go responses to the odor predicting positive outcome (HIT trials; 60 ⫾ 7 or 49.9 ⫾ 0.56% per session; mean ⫾ SEM), as well as to the odor predicting negative outcome (FA trials; 22 ⫾ 5 or 17.4 ⫾ 0.68%). When rats correctly decide to avoid the negative outcome (NoGo), the trial times out after 10 s (CREJ trials; 32 ⫾ 4 or 27.1 ⫾ 0.74%). Only rarely did animals fail to retrieve the positive outcome (MISS trials; 7 ⫾ 1 or 5.5 ⫾ 0.59%) and therefore this trial type was not analyzed further. On average, animals took 120 ⫾ 16 trials to reach a behavioral criterion, defined as 85% of trials correct in a block of 20 trials. Upon reaching the criterion, either the session was terminated or the odor-outcome contingencies were reversed. This reversal phase was not further analyzed here. Over the course of learning, the reaction time (defined as the time from odor offset to entry into the fluid well) decreased significantly for HIT trials (mean ⫾ SEM: 2.94 ⫾ 0.11 s; Pearson correlation r ⫽ ⫺0.14, p ⬍ 0.01), but not FA trials (2.93 ⫾ 0.14 s, difference not significant; r ⫽ ⫺0.09, n.s.). In previous research using this task, we have found increased spectral power and spike-field rhythmic synchronization in the theta (4 –12 Hz) and gamma (30 –100 Hz) frequency bands, compared with baseline, specifically during the sampling of outcomepredictive odors in this task (van Wingerden et al., 2010a,b, 2012). Recent reports have indicated that systematic relationships between oscillations in different frequency bands can exist (PAC; Tort et al., 2009; Axmacher et al., 2010; Fujisawa and Buz-
498 • J. Neurosci., January 8, 2014 • 34(2):493–505
saki, 2011; van der Meij et al., 2012). Therefore, we asked whether a systematic relation between theta phase and gamma amplitude exists during odor sampling and whether this relationship is modulated in conjunction with associative learning. If crossfrequency interactions between local field potential oscillations contribute to information processing (Lisman and Buzsa´ki, 2008; Canolty and Knight, 2010; van der Meij et al., 2012; Lisman and Jensen, 2013) then it can be hypothesized that measures of PAC correlate with decision-making performance. We recorded LFP signals from the OFC of three rats engaged in this behavioral task to evaluate this hypothesis. Theta-gamma PAC occurs time-locked to odor onset To quantify the dynamics of phase-amplitude coupling, we calculated between-channel PAC using wPLFs (Maris et al., 2011; van der Meij et al., 2012) per session, in time windows of 600 ms time-locked to odor onset, separately for odor sampling periods using stimuli predicting an appetitive or an aversive outcome. Figure 1A shows the color-coded magnitude of the wPLF bispectrum for an example session, averaged over all trials and selected between-channel combinations (Fig. 1B shows an example of raw and filtered LFP traces). The top row shows the bispectra for the periods of sampling odor predicting sucrose (S⫹, “positive odor”), whereas the bottom row depicts the sampling periods related to the odor predicting negative outcome (S⫺, “negative odor”). Figure 2A shows the time course of wPLF magnitude, averaged across sessions and relative to odor onset, for S⫹ trials (purple) and S⫺ trials (orange). Both time courses peak ⬃500 ms into the odor-sampling period and decay to levels not significantly above preodor sampling baseline periods after odor offset (average odor sampling duration, 1.24 ⫾ 0.07 s). Importantly, odor sample duration did not shorten as sessions progressed, which could otherwise have affected wPLF calculation in the chosen time window. Odor sample durations, pooled across sessions, increased within sessions only for HIT trials (median ⫾ SEM: 1.43 ⫾ 0.06 s; Pearson correlation with trial number: r ⫽ 0.89, p ⬍ 0.001), but not for CREJ (1.03 ⫾ 0.02 s; r ⫽ 0.25, p ⫽ 0.08) and FA trials (1.06 ⫾ 0.04 s; r ⫽ 0.04, p ⫽ 0.80). The mean odor sample duration for HITs was significantly larger than for both FA and CREJ trials (both p ⬍ 0.05, t test); the difference between FA and CREJ was not significant. Hereafter, we will restrict analysis to the 600 ms time window centered at 0.5 s after odor onset (ranging from 200 to 800 ms after odor onset). Theta-gamma PAC differentiates between trial types We next asked whether differences in wPLF magnitude could be observed between trial types. When we compared S⫹ versus S⫺ odor sampling periods within sessions, controlling for absolute magnitude differences between sessions, we found significantly higher wPLF differences, averaged across the FOI window, for S⫹ trials compared with all S⫺ trials (difference in wPLF magnitude, mean ⫾ SE; 0.017 ⫾ 0.010, p ⬍ 0.05 Wilcoxon test; Figure 2C). This result could be unpacked in a significant difference between HIT trials (S⫹ trials with a Go response, HIT) and FA trials (S⫺ trials with Go response; FA, difference in wPLF magnitude ⫽ 0.022 ⫾ 0.013, p ⬍ 0.05 Wilcoxon test). Figure 2B shows the complete bispectrum of wPLF magnitude for HITS (left) and FA trials (right), averaged across all sessions. To investigate whether these differences between trial types exist only between those channel pairs with large spectral power (selected channels), or whether they generalize to the whole dataset, we reran this analysis using averages of whole-session wPLF magnitudes (N ⫽ 10, as in the main analysis) constructed from all
van Wingerden et al. • Phase-Amplitude Coupling in Rat Orbitofrontal Cortex
Table 1. Preferred coupling phase parameters per trial type Rayleigh’s Z ( p value) von Mises Z (mean ⫾ SEM)
Mean phase ⫹ 95% CI HIT ⫺38.0° 关⫺69.2° to ⫺6.72°兴 CREJ ⫺14.2° 关⫺55.5° to 27.1°兴 FA ⫺11.9° 关⫺73.0° to 49.3°兴b
a
5.65c, p ⬍ 0.01 3.93c, p ⬍ 0.05 2.43d, n.s.
(0.45 ⫾ 0.23)e** (0.17 ⫾ 0.23)e* (⫺0.62 ⫾ 0.23)f
The mean preferred coupling phase, calculated per session over channel combinations and subsequently averaged over sessions (N ⫽ 10), differs between trial types. The distributions of pairwise comparisons of coupling phase between trial types at the channel combination level (with an expected difference in phase angle of 0°) were tested using a circular paired t test. Mean phases marked with a differ from b; p ⬍ 0.05. Rayleigh’s Z values (larger Z values indicate phase distributions deviating more from a uniform distribution) marked with cdiffer from dacross sessions; p ⬍ 0.05. The concentration of phase distributions (concentration parameter from the fit to a von Mises distribution) also differed between trial types. z-scored values for groups marked with e are larger than for the group marked f; **p ⬍ 0.01, *p ⬍ 0.05. n.s., Not significant.
available channel pairs (N ⫽ 110 per session). This approach introduced additional noise, as signals with low relative spectral power will render less precise theta phase estimations and smaller fluctuations in gamma amplitude compared with the channels selected on univariate characteristics in the main analysis [though higher spectral power (univariate parameter) does not imply larger wPLF magnitude (bivariate parameter) per se, see below]. In addition, we controlled for a potential influence of shared frequency components (originating, for example, from the reference electrodes) on wPLF magnitude by re-referencing the raw LFP data to the mean of the recorded traces. The results of these two control analyses for whole-session PAC are depicted in Figure 2D (top, all channels; bottom, re-referenced channels). These degraded signals still showed the same overall pattern for comparisons between HIT, CREJ, and FA trials. However, comparisons between trial types failed to reach statistical significance using these datasets. PAC preferred coupling phase differentiates between trial types The reported wPLF magnitudes indicate that, within sessions, the preferred coupling phase between phase-providing and amplitude-providing channels shows consistency across trials, and more so for correct versus incorrect trial types. If this coupling is a general temporal patterning phenomenon related to evaluative sensory processing in OFC, one could expect that the preferred coupling phase remains relatively constant across sessions and animals as well (consistency in preferred coupling phase over sessions, which could differ between trial types as well). Moreover, the preferred coupling phase could differ between successful and unsuccessful trials. To address these issues, we first calculated the circular mean of preferred phases across sessions and tested the distribution of these phases for uniformity over the circle (using Rayleigh’s test). Second, to measure the concentration of the phase distribution and compare this concentration between conditions, we fitted the dataset of phase angles with a von Mises distribution, from which we obtained the concentration parameter . Finally, to evaluate differences in mean phase between conditions, we calculated pairwise phase differences between conditions at the channel combination level and tested whether the mean phase of the resulting distribution of phase differences was significantly different from zero (Table 1). When analyzed over sessions, the distribution of mean preferred coupling phase was significantly different from uniformity for HIT (Rayleigh’s Z ⫽ 5.65, p ⬍ 0.01) and CREJ trials (Z ⫽ 3.93, p ⬍ 0.05) but not FA trials (Z ⫽ 2.43, n.s.). Furthermore, direct comparisons between Rayleigh’s Z values, normalized across trial types within sessions, aggregated over sessions, indicated significant differences in phase concentration
van Wingerden et al. • Phase-Amplitude Coupling in Rat Orbitofrontal Cortex
between HIT and FA trials (dZ: 1.06 ⫾ 0.44, p ⬍ 0.05), CREJ and FA trials (dZ: 0.84 ⫾ 0.36, p ⬍ 0.05) but not HIT and CREJ trials (dZ: 0.22 ⫾ 0.36, n.s.). Pairwise differences in z-transformed values obtained from von Mises distribution fits confirmed this analysis: both HIT (0.45 ⫾ 0.23) and CREJ (0.17 ⫾ 0.23) were larger than FA (⫺0.62 ⫾ 0.23, p ⫽ 0.009 and p ⫽ 0.035, respectively). Again, the difference between HIT and CREJ was not significant. When we examined the pairwise phase differences between trial types, averaged across the FOI window and across channel-combinations into session-level mean coupling phases, we found that the pairwise phase difference between HIT and FA coupling phases was significantly different from 0 (⌬phase ⫽ ⫺31.5°, 95% CI: ⫺57.9° to ⫺5.22°, p ⬍ 0.05 one-sample circular test for mean direction). Contrasts between HIT and CREJ (⌬phase ⫽ ⫺15.0°, CI: ⫺39.2° to 9.26°), and between CREJ and FA trial phases (⌬phase ⫽ ⫺8.51°, CI: ⫺37.4° to 20.4°) did not reach statistical significance. These results suggest that the consistency of preferred PAC coupling phases across sessions is greater for correct compared with incorrect trials and is associated, in HIT trials, with somewhat earlier coupling phases. Correlations between PAC and behavioral parameters Next, we analyzed whether wPLF magnitudes are sensitive to learning within sessions. To compare within-session changes in session-level averages of wPLF magnitude with behavioral performance data, we first created a time-series of wPLF magnitudes by computing wPLFs across a block of four trials, and sliding this block across the session. To control for differences in wPLF magnitude between sessions, the magnitude time-series were z-transformed per session. Next, these wPLF magnitudes were binned according to behavioral performance (see Materials and Methods). The regression of mean binned wPLF magnitude on performance score was significant (R 2 ⫽ 0.97; Pearson’s r ⫽ 0.98, p ⬍ 0.001; Fig. 3A). As a control analysis, we performed a similar regression of wPLF magnitudes, averaged across sessions per performance bin, on behavioral performance for wPLF magnitudes taken from the dataset with session-averages constructed from channel combinations within a session (PACALL) and for wPLF magnitudes from the re-referenced dataset (PACREREF). Both control analyses showed significant correlations as well (RALL 2 ⫽ 0.93; r ⫽ 0.97, p ⬍ 0.001; RREREF 2 ⫽ 0.87; r ⫽ 0.93, p ⬍ 0.01). When trial types were examined separately, we found significant Pearson correlations between z-transformed wPLF magnitudes and performance scores for HIT (R 2 ⫽ 0.64 for a regression of wPLF magnitudes for HIT trials, averaged per performance bin across sessions, onto performance; r ⫽ 0.80, p ⬍ 0.05), CREJ (R 2 ⫽ 0.54, r ⫽ 0.73, p ⬍ 0.05), but not FA trials (R 2 ⫽ 0.14; r ⫽ ⫺0.38, p ⫽ 0.40; Fig. 3B). A correlation between z-scored wPLF magnitude, averaged per performance bin per session, pooled across all sessions (yielding 1 value per performance bin per session), and performance was also significant for HIT (r ⫽ 0.23; 95% CI: 0.12– 0.34; p ⬍ 0.001) and CREJ trials (r ⫽ 0.13; CI: 0.01– 0.26; p ⬍ 0.05), but not FA trials (r ⫽ ⫺0.09; CI: ⫺0.30 to 0.14, n.s.;Fig. 3C). To corroborate this correlation-based approach, wPLF differences (⌬wPLF, calculated as session averages of wPLF differences, per trial type) between the group of trials with performance ⬎85% correct (high-performance bin) and the group of trials when it was lower than 70% correct (low-performance bin) were calculated. In line with these correlations, we observed ⌬wPLF values significantly different from 0 for HIT (0.012 ⫾ 0.003; p ⬍ 0.0001 one-sample t test; Fig. 3D) and CREJ trials (0.013 ⫾ 0.003: p ⬍ 0.0001). For FA trials, mean wPLF became smaller for high
J. Neurosci., January 8, 2014 • 34(2):493–505 • 499
performance trials compared with low-performance trials (⫺0.010 ⫾ 0.004; p ⬍ 0.05). In the high performance bin, ⌬wPLFHIT and ⌬wPLFCREJ differed significantly from ⌬wPLFFA (both p ⬍ 0.001, t test), but not from each other. A similar analysis performed on the PACALL dataset yielded comparable results: ⌬wPLFHIT-ALL (0.012 ⫾ 0.002) and ⌬wPLFCREJ-ALL (0.006 ⫾ 0.002) both differed from 0 ( p ⬍ 0.001 and p ⬍ 0.01, respectively) and from ⌬wPLFFA-ALL (0.000 ⫾ 0.003, n.s.; pairwise comparisons to HITALL and CREJALL both p ⬍0.05), but the difference in ⌬wPLF between HITALL and CREJALL was not significant. This suggests that the learning-related changes in wPLF magnitude selectively occur in trials with correct decisions. To compare the evolution of PAC strength directly to the learning curve, we correlated wPLF magnitudes to the percentage of session completion. We controlled for sessions with unequal trial numbers by linear interpolating wPLF magnitudes and behavioral performance per session to equal-length time series of 50 estimates per trial type (Fig. 4). To illustrate the dynamics of PAC in relation to odor sampling, we extended this analysis over 15 partially overlapping windows, stepped in 100 ms increments relative to odor onset (⫺0.3 to ⫹1.1 s). Using this interpolated dataset, the pattern of results obtained for changes in wPLF magnitude within sessions was comparable to the analysis of wPLF magnitude binned on performance data, i.e., increments in PAC strength with increasing session completion for HIT and CREJ, but not FA trials. As illustrated in Figure 5, Pearson coefficients with 95% confidence intervals for correlations between the percentage of session completion (50 steps of 2%) and all interpolated wPLF magnitude data points, averaged into session-based means for selected channels, were significantly ⬎0 for HIT (r ⫽ 0.19; 95% CI: 0.11– 0.28, p ⬍ 0.001; Fig. 5) and CREJ (r ⫽ 0.16; 95% CI: 0.08 – 0.25, p ⬍ 0.001) but not FA trials (r ⫽ 0.04; 95% CI: ⫺0.06 to 0.12, n.s). In addition, the correlation coefficients for HIT and CREJ trials were significantly different from the correlation coefficient for FA trials (HIT vs FA: p ⬍ 0.05; CREJ vs FA: p ⬍ 0.05; Fisher’s z test for comparing correlation coefficients). We repeated this analysis for session-based wPLFs, averaged across all channel pairs, with similar results (HITall: r: 0.22, p ⬍ 0.001; CREJall: r: 0.13, p ⬍ 0.01; FAall: r: 0.09, n.s.). This analysis suggests that the possibility of a nonselective drift in wPLF magnitudes varying with progressive session completion influencing the previous performance-based analysis is unlikely, as the variation with time in the task was different between trials with correct versus incorrect decisions. Correlations between wPLF magnitude and reaction times (defined as the time between odor offset and fluid well entry for HIT and FA trials) were not significant (both p ⬎0.1); correlations between wPLF magnitude and odor sampling time were significant only for HIT trials (r ⫽ 0.68, p ⬍ 0.001). Even though odor sample times increased for HIT trials, the onset of elevated PAC remained locked to odor onset: correlations between the time bin exhibiting maximum PAC strength (peak wPLF magnitude), relative to odor onset, and odor sample durations on a given trial were not significant for any trial type. Rather, the peak wPLF magnitude remained time-locked to odor onset, occurring in the time window centered 500 ms after odor onset instead of following the dynamic in median odor sampling time for HIT trials (Fig. 4B, purple line). The bin with peak wPLF magnitude did not differ significantly between the first and last quintile of session length for any trial type. The coefficient for a Spearman rank correlation between median odor sample duration and peak magnitude bin relative to odor offset on HIT trials was significant however (r ⫽ ⫺0.15, p ⫽ 0.001), suggesting that, as odor sample
van Wingerden et al. • Phase-Amplitude Coupling in Rat Orbitofrontal Cortex
500 • J. Neurosci., January 8, 2014 • 34(2):493–505
A
B 10
30 0.14
40
0.12
50
0.1 60 0.08
PAC (wPLF magn)
Session completion (% of total trials)
20
70 80 90 100 60 70 80 90 100
Performance (% correct trials)
0
0.4
0.8
1.2
HITS
1.6
0
0.4
0.8
CREJ
0
0.4
0.8
FA
Time from odor onset (s)
Figure 4. PAC dynamics in relation to the learning curve. A, Performance scores (percentage correct responses across a 20-trial sliding window) were interpolated to 50 data points per session and pooled across sessions. Mean interpolated performance score is plotted against percentage session completion (i.e., 50 bins, 2% of session length). Shading indicates 95% CI on the mean. Dashed line, Behavioral criterion (85% correct) used to terminate behavioral sessions. B, Interpolated wPLF magnitude, pooled across sessions, is plotted in several 600 ms time windows relative to odor onset. Each 100 ms bin represents the time point on which the corresponding 600 ms time window was centered. Time on x-axis refers to bin centers. Dashed lines indicate the window used in the main analysis, centered on the ⫹0.5 s bin, running from ⫹0.2 to ⫹0.8 s after odor onset. Left, HIT trials; Middle, CREJ trials; Right, FA trials. Purple and white lines indicate median odor sample durations, similarly interpolated to 50 data points.
durations get longer for HITS, peak magnitude shifts away from the termination of odor sampling and the initiation of the behavioral response. Therefore, we interpret the correlation between odor sampling duration and wPLF magnitude as a spurious byproduct of the pre-existing correlations between session completion and wPLF magnitude on the one hand, and between session completion and odor sampling duration on the other, and not as evidence that wPLF magnitudes increase because there would be a prolonged period of elevated PAC. In conclusion, using performance-based and session lengthbased metrics we found that PAC became stronger across learning trials, independent of other behavioral parameters, but only for correct (HITs and CREJs) and not incorrect decisions. PAC magnitude is not positively correlated with theta power Because the wPLF magnitude calculation depends, in part, on an accurate estimation of the phase of oscillations in the theta band, fluctuations in theta power could bias PAC measures. However, in contrast to wPLF magnitude, we found that z-scored theta power, averaged over all channels within a session and aggregated over sessions, correlated negatively with behavioral performance
(R 2 ⫽ 0.51; Pearson’ r ⫽ ⫺0.71, p ⬍ 0.05; Fig. 6A). Broken down by trial type, we found significant negative correlations for HIT (r ⫽ ⫺0.20; p ⬍ 0.001; Fig. 6B) and CREJ (r ⫽ ⫺0.16, p ⬍ 0.05), but not FA trials (r ⫽ 0.00, n.s.). Direct comparisons of normalized theta power between the high- and low-performance bin (⌬theta, a.u.) revealed a significant decrease of normalized theta power for HIT (⫺0.14 ⫾ 0.06; p ⬍ 0.05 one-sample t test vs 0; Fig. 6C) and CREJ (⫺0.15 ⫾ 0.06; p ⬍ 0.05), but not FA trials (⫺0.05 ⫾ 0.12; n.s.). These ⌬theta values did not differ significantly between trial types. This analysis suggests that the increase in wPLF magnitude with performance is not due to better phase estimation in LFP epochs with higher theta power, and that differences in wPLF magnitude between trial types can exist in the absence of significant differences in theta power. Variation in wPLF magnitude according to electrode placement We obtained multiple recordings from each rat, spread out over recording days. As tetrodes were advanced along the dorsoventral axis daily, early and late sessions predominantly sample dorsal and ventral OFC, respectively. To compare the evolution of wPLF
van Wingerden et al. • Phase-Amplitude Coupling in Rat Orbitofrontal Cortex
*** *
A
****
0.6
0.2 0.1
0.4
Theta power (z−scored)
PAC (wPLF magn)
0.16
corr.coef.
0.3
0.18
J. Neurosci., January 8, 2014 • 34(2):493–505 • 501
0
HIT
FA
CREJ
0.14
0.12
0.10 10
20
30
40
50
60
70
80
90
R2: 0.51 0.2
0
−0.2
−0.4
100
% of session completion
B
C 0.2
**
*
∆theta power
magnitude over different recording depths, sessions were categorized as dorsal, intermediate, or ventral, based on position in the recording order per rat. wPLF magnitudes per channel pair were mean-normalized across depths within a rat. Subsequently, wPLF magnitudes were averaged across channel combinations within sessions (Fig. 7A). Pairwise comparisons between mean-normalized wPLF magnitudes across depth levels revealed significant differences between dorsal (mean ⫾ SEM, ⫺0.030 ⫾ 0.009) and intermediate (0.007 ⫾ 0.008, p ⬍ 0.05, t test) levels, as well as between dorsal and ventral (0.023 ⫾ 0.007, p ⬍ 0.01; intermediate vs ventral, n.s.) depth levels. These findings suggest that high PAC can be found throughout the intermediate and ventral layers of the OFC and do not support alternative explanations on the origin of OFC PAC that would place the source of the rhythmic activity underlying PAC outside the OFC. In 2 of 3 rats (N ⫽ 7 of 10 sessions), recordings were made with a circular tetrode arrangement (Fig. 7 B, C), which allowed us to examine the coarse distribution of PAC strength based on anatomical location in the horizontal plane. To investigate whether wPLF magnitudes were asymmetrically distributed, we sorted session-averaged wPLF magnitudes from selected channel pairs once according to phase-providing channel (Fig. 7B) and once according to amplitude-providing channel (Fig. 7C). To combine data from different sessions, wPLF magnitudes were normalized within a session, averaged into session-level means, and subsequently pooled. We split the channel data in four anatomical quadrants along the anterior–posterior and mediolateral axes and tested the pooled data of all other quadrants against the mean wPLF magnitude per quadrant. In the dataset sorted according to phase-providing channel, only the posteromedial quadrant exhibited significantly different wPLF magnitudes compared with the mean of the other quadrants (mean ⫾ SEM: Zpm ⫽ 0.32; Zother ⫺ 0.06 ⫾ 0.15; one-sample t test, p ⬍ 0.05; Fig. 7D). For the amplitude-providing channel data, both the posterolateral (mean ⫾ SEM: Zpm ⫽ 0.95; Zother ⫺0.30 ⫾ 0.12; p ⬍ 0.001) and the posteromedial (mean ⫾ SEM: Zpm ⫽ ⫺0.52; Zother
60 70 80 90 Performance (% correct trials)
corr.coef.
Figure 5. Changes in wPLF magnitude across trials. wPLF magnitudes were calculated over four-trial blocks, spanning sessions in a sliding window analysis. Session length was normalized by interpolating to 50 data points. Mean wPLF magnitude across sessions is plotted for HITS (blue), FA (red), and CREJ (green) trials, along with their linear regression lines. Pearson correlations with 95% confidence intervals were calculated between percentage of session completed and wPLF magnitudes for trial types in all sessions (inset). The correlation coefficients for HIT (r ⫽ 0.22, 95% CI: 0.14 – 0.30, ***p ⬍ 0.001) and CREJ (r ⫽ 0.22, 95% CI: 0.14 – 0.30, p ⬍ 0.001) trials were significantly ⬎0 and significantly greater (*p ⬍ 0.05, Fisher’s Z test) than the correlation coefficient for FA trials (r ⫽ 0.07, 95% CI: ⫺0.02 to 0.15; n.s.).
0 −0.2 HIT
CREJ
FA
0.1 0
*
*
a
a
−0.1
b
−0.2 HIT CREJ
FA
Figure 6. Theta power does not correlate positively with performance. A, A similar analysis as used in Figure 3A, now using normalized theta power, shows a significant negative correlation between performance bin and z-scored theta power (R 2: 0.51, p ⬍ 0.05). Circle diameter indicates relative N of observations in that performance bin. Error bars indicate SEM. B, Pearson correlations coefficients with confidence intervals for HIT (⫺0.20, **p ⬍ 0.01; blue), CREJ (r: ⫺0.16, *p ⬍ 0.05; green), and FA trials (r ⫽ 0.00, n.s.; red). C, Differences in normalized theta power between high- and low-performance bins per trial type (⌬theta, a.u.) for HIT (mean ⫾ SEM, ⫺0.14 ⫾ 0.06; *p ⬍ 0.05, one-sample t test vs 0; blue), CREJ trials (⫺0.15 ⫾ 0.06, *p ⬍ 0.05; green), and FA trials (⫺0.05 ⫾ 0.12, n.s.; red).
0.33 ⫾ 0.20; p ⬍ 0.001) quadrant differed from the other quadrants (Fig. 7E). Note that these quadrants exhibiting the largest wPLF deviations do not necessarily correspond to the quadrants with the largest N (visualized per electrode location as circle diameter) of selected channels, i.e., channels with either high univariate power in the theta (phase-providing electrode; Fig. 7B) or gamma band (amplitude-providing electrode; Fig. 7C).
Discussion Here we demonstrate PAC between theta (4 –12 Hz) and gamma (30 –100 Hz) oscillatory activity, two frequency bands previously identified in local field potential recordings from rat OFC in the context of the current behavioral task (van Wingerden et al., 2010a,b, 2012; Pennartz et al., 2011b). In our olfactory discrimination task, where rats learn the association between a stimulus predicting positive outcome and a stimulus predicting negative outcome, PAC appeared time-locked to odor sampling (Fig. 1). When sessions were split into samples of HIT, FA, and CREJ, session averaged PAC was found to be higher on HIT compared with FA trials (Fig. 2). The concentration of preferred coupling phases, pooled across sessions, also differed between trial types, with preferred coupling phases in HIT and CREJ trials showing more consistency than FA trials. Pairwise comparisons on the preferred cou-
van Wingerden et al. • Phase-Amplitude Coupling in Rat Orbitofrontal Cortex
502 • J. Neurosci., January 8, 2014 • 34(2):493–505
B
AP (mm from Bregma) 0.02
n.s.
*
**
intermediate
ventral
0.4
*
4
3
2 S
0
PL PM
AI
DLO 3
2
1
0.2
AL AM
1
PAC strength (Z-scored)
−0.02
Depth of recording
PAC (z-scored wPLF)
4
0
dorsal
D
5
5
ML (mm from Bregma)
PAC (normalized wPLF)
A
LO
0.5
Cl
OB VO
0 −0.5
MO IL
PrL
−1
0
Phase providing channels
−0.2
C
−0.4
5
5
4
3
2
Quadrant of phase-providing channel
-4.6 mm DV
0.5
0
−0.5
***
PAC (z-scored wPLF)
1
−1
4
AI DLO 3
2
1
−1.5
PL
AL
AM
PM
Quadrant of amplitude-providing channel
PAC strength (Z-scored)
***
1.5
ML (mm from Bregma)
E
0.8
LO
Cl
OB 0.4
VO 0
MO −0.4
PrL
IL
0
Amplitude providing channels
Figure 7. Anatomical distribution of PAC. A, For all channel pairs, wPLF magnitudes were split into early, middle, and late recording sessions along the DV axis, corresponding to dorsal, intermediate, and ventral recording depths and mean-subtracted per channel pair across depth levels. Subsequently, these mean-normalized wPLFs were averaged into session means and pooled across trial types. Session mean (⫾SEM) wPLF magnitude is plotted against depth level (*p ⬍ 0.05, **p ⬍ 0.01, t test). B, wPLF magnitude was z-transformed within sessions, sorted by phase-providing channel, aggregated across recording columns at the channel combination level and projected on the horizontal plane (⫺4.6 mm from bregma). Black cross indicates the split into four anatomical quadrants. AM, Anteromedial; AL, anterolateral; PL, posterolateral; PM, posteromedial; MO, medial orbital cortex; Prl, prelimbic cortex; Il, infralimbic (Figure legend continues.)
van Wingerden et al. • Phase-Amplitude Coupling in Rat Orbitofrontal Cortex
pling phase showed a phase lag for FA error trials compared with HIT trials. This suggests that evaluative processing of two distinct odor stimuli, leading to correct Go and NoGo decisions respectively, is associated with a relatively fixed coupling phase range and, conversely, that inconsistency in preferred coupling phase is associated with errors. Within sessions, PAC strength correlated positively with behavioral performance, but only for correct trials (HITS and CREJ trials) and resulted in significant tandem increments in PAC for these trials (Fig. 3). These results suggest that higher PAC is associated with good decisions, regardless of the associated behavioral response (Go vs NoGo), and does not depend on nonspecific drift with time across the learning session (Figs. 4, 5). Importantly, these within-session changes did not correlate positively with theta power; rather, in periods of high performance, when wPLF magnitudes differed between trial types, theta power did not (Fig. 6). Finally, we presented initial evidence that PAC strength within the OFC complex is heterogeneous (Fig. 7), with strong PAC occurring between posteromedial phase-providing channels (VO/LO) and posterolateral amplitude-providing channels (LO/ AI). With respect to the dorsal-ventral axis, wPLF magnitudes were found to rise quickly with increasing depth to remain at similar levels once the OFC core (intermediate-ventral) was reached. These results are consistent with our previous reports of a source-sink couple contributing to theta-band oscillations located in central OFC (van Wingerden et al., 2010a), and phase heterogeneity of these theta-band oscillations across the OFC recording sites (Vinck et al., 2011). Combined with the results from the locally re-referenced dataset, this renders an explanation of observed PAC in terms oscillations exogenous to OFC (e.g., from piriform cortex) unlikely. In contrast to other reports from human recordings (Axmacher et al., 2010; Voytek et al., 2010), we did not find systematic variation in the exact frequency of the phase-providing channels associated with peak wPLF magnitudes. Our report of rodent PAC during evaluative stimulus sampling contrasts with a body of studies demonstrating PAC in human EEG/MEG and intracortical subdural electrocorticogram recordings that focused primarily on passive rest, reward processing and motor/verbal or working memory tasks (Canolty et al., 2006; Osipova et al., 2008; Cohen et al., 2009a b; Maris et al., 2011; van der Meij et al., 2012). Recent reports have shown PAC in rodents in relation to context retrieval in the hippocampus (Tort et al., 2009) and working memory processes in the medial prefrontal cortex (Fujisawa and Buzsa´ki, 2011). Tort et al. (2008, 2009) described PAC within the striatum and hippocampus, also between striato-hippocampal channel pairs. In their data, within-area CA3 theta-gamma PAC was modulated by learning, and persisted with overtraining. Whereas PAC in our data was strongest in the absence of whole-body movement, Tort et al., using an item-in-context learning paradigm, found that PAC was maximal during active spatial exploration in an open4 (Figure legend continued.) cortex; Cl, claustrum; OB, olfactory bulb. Anatomical subdivisions according to the Rat Atlas by Paxinos and Watson (2007). The relative diameter of each circle represents the N of channels in the selected channel dataset at that location in the horizontal plane. C, As in B, but wPLFs are now sorted according to amplitude-providing channel. D, Mean z-transformed wPLF magnitude, aggregated across phase-providing electrodes at the channel combination level in an anatomical quadrant. The mean of each quadrant was used as a reference point for a one-sample t test using the data from all other quadrants; *p ⬍ 0.05; ***p ⬍ 0.001, Bonferroni-corrected. E, As in D, but now showing z-scored wPLF magnitudes aggregated per amplitude-providing electrode.
J. Neurosci., January 8, 2014 • 34(2):493–505 • 503
field maze, which they related to context-based retrieval of a task rule. This hippocampal PAC, however, differs from the OFC PAC described here in that it declined sharply upon stimulus sampling (odorant sniffing). Fujisawa and Buzsa´ki (2011) showed that the phase of a 4 Hz slow oscillation recorded from mPFC modulated the amplitude of gamma-band frequencies during the working memory period of a T-maze task. Our data differ from this study in showing theta-gamma PAC in the absence of locomotion. Moreover, our measure of PAC strength, wPLF magnitude (van der Meij et al., 2012), not only increases with task acquisition (cf. Tort et al., 2009), but, importantly, also discriminates between correct and incorrect decisions. Incorrect Go trials (FA) showed significantly lower wPLF magnitudes and a significantly lagging coupling phase across sessions compared with correct Go trials (HIT). In addition, these error trials lacked the withinsession increase observed in correct trials, both in relation to performance and session completion. Conversely, no differences between PAC for good decisions (HIT vs CREJ trials) were detected either in whole-session PAC (Fig. 2) or in within-session PAC changes (Fig. 3D). A possible explanation for the lack of a significant difference between CREJ and FA trials in wholesession wPLF magnitude, in contrast to the observed difference between HIT and FA trials, could lie in the wPLF magnitude offset (i.e., at session onset; as apparent in Fig. 5) between HIT and CREJ trial types, as the correlation coefficients for wPLF magnitude increases for these two trial types did not differ significantly. Moreover, the relative increase of wPLF magnitude with learning also did not differ significantly between the correct trial types (Fig. 3D). Finally, the interpolated data (Fig. 4) suggested an earlier onset of the rise in wPLF magnitude for HITS compared with the other trial types. As the acquisition phase was terminated immediately after the rats reached a behavioral criterion, our data do not speak in favor or against the possibility that PAC saturation effects could have occurred with prolonged supracriterion performance or overtraining (cf. Tort et al., 2009). We hypothesize that orbitofrontal theta-gamma PAC in this task is instrumental in supporting stimulus evaluation, i.e., the attribution of outcome expectancies to sensory input, and subsequent decision-making. In support of this hypothesis, we previously showed that particular subsets of OFC single units, conveying odor or expected outcome information, phase-lock preferentially to theta and gamma band frequencies, respectively, during odor sampling (van Wingerden et al., 2010b). The modulation of gamma power by theta phase in this behavioral period may be instrumental in forging links through Hebbian, spiketiming-dependent plasticity (Bi and Poo, 1998; Cassenaer and Laurent, 2007; Canolty and Knight, 2010) between units that are part of assemblies representing stimulus-outcome and actionoutcome associations within areas belonging to the orbital and medial prefrontal networks identified anatomically (Ongu¨r and Price, 2000, 2003; Hoover and Vertes, 2011) and functionally (Mar et al., 2011). Furthermore, theta-band modulated synchrony of firing patterns conveying reward-related information within OFC may be essential for efficient modification of stimulus-outcome and action-outcome associations in distal target areas (Schoenbaum et al., 2009, 2011; Takahashi et al., 2009; Pennartz et al., 2011b; Wallis and Kennerley, 2011) through cross-structural coherence in low frequencies such as theta-band (Schroeder and Lakatos, 2009; Benchenane et al., 2010; Womelsdorf et al., 2010; Fujisawa and Buzsa´ki, 2011). The superimposed OFC gamma rhythm, probably reflecting local processing (van Wingerden et al., 2010b; Buzsa´ki and Wang, 2012) may promote precise spike timing
504 • J. Neurosci., January 8, 2014 • 34(2):493–505
within assemblies, possibly enhancing cross-structural spiketiming-dependent associative processes and retrieval of stimulusoutcome mappings. We previously reported that gamma-band synchronization did not appear to discriminate between trial types, under control conditions (van Wingerden et al., 2010b) or under local antagonism of the NMDA-receptor (van Wingerden et al., 2012). It is therefore striking that in the current dataset, clear PAC differences emerge between correct and incorrect trial types, suggesting it is the precise phase-timing, and not the spectral power of the gamma synchronization, that is important for correct performance. As wPLF magnitudes were correlated with correct behavioral performance, these findings are consistent with the hypothesis that PAC may be associated with a high quality of retrieval of expected outcome information associated with stimuli, and may contribute to synaptic plasticity in local circuits (Canolty and Knight, 2010), associated with changes in neural discrimination of Go/NoGo stimuli in OFC (van Wingerden et al., 2012). They are also consistent with the idea, previously coined in relation to OFC gamma rhythm (van Wingerden et al., 2010b), that high theta-gamma PAC may function to suppress (inhibit) premature or incorrect behavioral (Go) responses in Hit and CREJ trials, respectively. Consistent with this, PAC was low in FA trials, quite probably along with an insufficient inhibition of the incorrect Go response. These two accounts both explain why PAC remains high in correct trial types when most learning has been completed. In this light, it would be interesting to examine PAC dynamics under a regime of plasticity blockade. A critical test for the hypothesis that PAC is causally important for the functions in outcome-related learning attributed to the OFC, however, would be the selective disruption of PAC or its components, for example using optogenetic control of spike timing or gamma synchronization (cf. Cardin et al., 2009) in the context of a learning task known to depend on OFC integrity.
References Axmacher N, Henseler MM, Jensen O, Weinreich I, Elger CE, Fell J (2010) Cross-frequency coupling supports multi-item working memory in the human hippocampus. Proc Natl Acad Sci U S A 107:3228 –3233. CrossRef Medline Baxter MG, Parker A, Lindner CC, Izquierdo AD, Murray EA (2000) Control of response selection by reinforcer value requires interaction of amygdala and orbital prefrontal cortex. J Neurosci 20:4311– 4319. Medline Benchenane K, Peyrache A, Khamassi M, Tierney PL, Gioanni Y, Battaglia FP, Wiener SI (2010) Coherent theta oscillations and reorganization of spike timing in the hippocampal-prefrontal network upon learning. Neuron 66:921–936. CrossRef Medline Berens P (2009) CircStat: a MATLAB toolbox for circular statistics. J Stat Softw 31:1–21. Bi GQ, Poo MM (1998) Synaptic modifications in cultured hippocampal neurons: dependence on spike timing, synaptic strength, and postsynaptic cell type. J Neurosci 18:10464 –10472. Medline Bragin A, Jando´ G, Na´adasdy Z, Hetke J, Wise K, Buzsa´aki G (1995) Gamma (40 –100 Hz) oscillation in the hippocampus of the behaving rat. J Neurosci 15:47– 60. Medline Buzsa´ki G, Draguhn A (2004) Neuronal oscillations in cortical networks. Science 304:1926 –1929. CrossRef Medline Buzsa´ki G, Wang XJ (2012) Mechanisms of gamma oscillations. Annu Rev Neurosci 35:203–225. CrossRef Medline Canolty RT, Knight RT (2010) The functional role of cross-frequency coupling. Trends Cogn Sci 14:506 –515. CrossRef Medline Canolty RT, Edwards E, Dalal SS, Soltani M, Nagarajan SS, Kirsch HE, Berger MS, Barbaro NM, Knight RT (2006) High gamma power is phaselocked to theta oscillations in human neocortex. Science 313:1626 –1628. CrossRef Medline Canolty RT, Ganguly K, Kennerley SW, Cadieu CF, Koepsell K, Wallis JD, Carmena JM (2010) Oscillatory phase coupling coordinates anatomi-
van Wingerden et al. • Phase-Amplitude Coupling in Rat Orbitofrontal Cortex cally dispersed functional cell assemblies. Proc Natl Acad Sci U S A 107: 17356 –17361. CrossRef Medline Cardin JA, Carle´n M, Meletis K, Knoblich U, Zhang F, Deisseroth K, Tsai LH, Moore CI (2009) Driving fast-spiking cells induces gamma rhythm and controls sensory responses. Nature 459:663– 667. CrossRef Medline Cassenaer S, Laurent G (2007) Hebbian STDP in mushroom bodies facilitates the synchronous flow of olfactory information in locusts. Nature 448:709 –713. CrossRef Medline Cavada C, Compan˜y T, Tejedor J, Cruz-Rizzolo RJ, Reinoso-Sua´rez F (2000) The anatomical connections of the macaque monkey orbitofrontal cortex: a review. Cereb Cortex 10:220 –242. CrossRef Medline Chrobak JJ, Buzsa´ki G (1998) Gamma oscillations in the entorhinal cortex of the freely behaving rat. J Neurosci 18:388 –398. Medline Cohen MX, Elger CE, Fell J (2009a) Oscillatory activity and phaseamplitude coupling in the human medial frontal cortex during decision making. J Cogn Neurosci 21:390 – 402. CrossRef Medline Cohen MX, Axmacher N, Lenartz D, Elger CE, Sturm V, Schlaepfer TE (2009b) Good vibrations: cross-frequency coupling in the human nucleus accumbens during reward processing. J Cogn Neurosci 21:875– 889. CrossRef Medline Colgin LL, Denninger T, Fyhn M, Hafting T, Bonnevie T, Jensen O, Moser MB, Moser EI (2009) Frequency of gamma oscillations routes flow of information in the hippocampus. Nature 462:353–357. CrossRef Medline Fellows LK, Farah MJ (2003) Ventromedial frontal cortex mediates affective shifting in humans: evidence from a reversal learning paradigm. Brain 126:1830 –1837. CrossRef Medline Fries P (2005) A mechanism for cognitive dynamics: neuronal communication through neuronal coherence. Trends Cogn Sci 9:474 – 480. CrossRef Medline Fujisawa S, Buzsa´ki G (2011) A 4 Hz oscillation adaptively synchronizes prefrontal, VTA, and hippocampal activities. Neuron 72:153–165. CrossRef Medline Gray CM, Maldonado PE, Wilson M, McNaughton B (1995) Tetrodes markedly improve the reliability and yield of multiple single-unit isolation from multi-unit recordings in cat striate cortex. J Neurosci Methods 63:43–54. CrossRef Medline Groenewegen HJ, Uylings HBM (2010) Organization of prefrontal-striatal connections. In: Handbook of basal ganglia structure and function, pp 353–365. London:Academic. Hare TA, O’Doherty J, Camerer CF, Schultz W, Rangel A (2008) Dissociating the role of the orbitofrontal cortex and the striatum in the computation of goal values and prediction errors. J Neurosci 28:5623–5630. CrossRef Medline Hikosaka K, Watanabe M (2000) Delay activity of orbital and lateral prefrontal neurons of the monkey varying with different rewards. Cereb Cortex 10:263–271. CrossRef Medline Hoover WB, Vertes RP (2011) Projections of the medial orbital and ventral orbital cortex in the rat. J Comp Neurol 519:3766 –3801. CrossRef Medline Lisman J (2005) The theta/gamma discrete phase code occuring during the hippocampal phase precession may be a more general brain coding scheme. Hippocampus 15:913–922. CrossRef Medline Lisman J, Buzsa´ki G (2008) A neural coding scheme formed by the combined function of gamma and theta oscillations. Schizophr Bull 34:974 – 980. CrossRef Medline Lisman JE, Jensen O (2013) The theta-gamma neural code. Neuron 77: 1002–1016. CrossRef Medline Mar AC, Walker AL, Theobald DE, Eagle DM, Robbins TW (2011) Dissociable effects of lesions to orbitofrontal cortex subregions on impulsive choice in the rat. J Neurosci 31:6398 – 6404. CrossRef Medline Maris E, van Vugt M, Kahana M (2011) Spatially distributed patterns of oscillatory coupling between high-frequency amplitudes and lowfrequency phases in human iEEG. Neuroimage 54:836 – 850. CrossRef Medline McDannald MA, Lucantonio F, Burke KA, Niv Y, Schoenbaum G (2011) Ventral striatum and orbitofrontal cortex are both required for modelbased, but not model-free, reinforcement learning. J Neurosci 31:2700 – 2705. CrossRef Medline McDannald MA, Takahashi YK, Lopatina N, Pietras BW, Jones JL, Schoenbaum G (2012) Model-based learning and the contribution of the orbitofrontal cortex to the model-free world. Eur J Neurosci 35:991–996. CrossRef Medline
van Wingerden et al. • Phase-Amplitude Coupling in Rat Orbitofrontal Cortex Ongu¨r D, Price JL (2000) The organization of networks within the orbital and medial prefrontal cortex of rats, monkeys and humans. Cereb Cortex 10:206 –219. CrossRef Medline Ongu¨r D, Ferry AT, Price JL (2003) Architectonic subdivision of the human orbital and medial prefrontal cortex. J Comp Neurol 460:425– 449. CrossRef Medline Osipova D, Hermes D, Jensen O (2008) Gamma power is phase-locked to posterior alpha activity. PLoS One 3:e3990. CrossRef Medline Padoa-Schioppa C, Assad JA (2006) Neurons in the orbitofrontal cortex encode economic value. Nature 441:223–226. CrossRef Medline Paxinos G, Watson C (2007) The rat brain in stereotaxic coordinates, Ed 6. Amsterdam: Academic/Elsevier. Pennartz CM, Ito R, Verschure PF, Battaglia FP, Robbins TW (2011a) The hippocampal-striatal axis in learning, prediction and goal-directed behavior. Trends Neurosci 34:548 –559. CrossRef Medline Pennartz CM, van Wingerden M, Vinck M (2011b) Population coding and neural rhythmicity in the orbitofrontal cortex. Ann N Y Acad Sci 1239: 149 –161. CrossRef Medline Rolls ET, Hornak J, Wade D, McGrath J (1994) Emotion-related learning in patients with social and emotional changes associated with frontal lobe damage. J Neurol Neurosurg Psychiatry 57:1518 –1524. CrossRef Medline Schoenbaum G, Nugent SL, Saddoris MP, Setlow B (2002) Orbitofrontal lesions in rats impair reversal but not acquisition of go, no-go odor discriminations. Neuroreport 13:885– 890. CrossRef Medline Schoenbaum G, Chiba AA, Gallagher M (1998) Orbitofrontal cortex and basolateral amygdala encode expected outcomes during learning. Nat Neurosci 1:155–159. CrossRef Medline Schoenbaum G, Roesch MR, Stalnaker TA, Takahashi YK (2009) A new perspective on the role of the orbitofrontal cortex in adaptive behaviour. Nat Rev Neurosci 10:885– 892. Medline Schoenbaum G, Takahashi Y, Liu TL, McDannald MA (2011) Does the orbitofrontal cortex signal value? Ann N Y Acad Sci 1239:87–99. CrossRef Medline Schroeder CE, Lakatos P (2009) Low-frequency neuronal oscillations as instruments of sensory selection. Trends Neurosci 32:9 –18. CrossRef Medline Sirota A, Montgomery S, Fujisawa S, Isomura Y, Zugaro M, Buzsa´ki G (2008) Entrainment of neocortical neurons and gamma oscillations by the hippocampal theta rhythm. Neuron 60:683– 697. CrossRef Medline Takahashi YK, Roesch MR, Stalnaker TA, Haney RZ, Calu DJ, Taylor AR, Burke KA, Schoenbaum G (2009) The orbitofrontal cortex and ventral tegmental area are necessary for learning from unexpected outcomes. Neuron 62:269 –280. CrossRef Medline Tort AB, Kramer MA, Thorn C, Gibson DJ, Kubota Y, Graybiel AM, Kopell NJ (2008) Dynamic cross-frequency couplings of local field potential
J. Neurosci., January 8, 2014 • 34(2):493–505 • 505 oscillations in rat striatum and hippocampus during performance of a T-maze task. Proc Natl Acad Sci U S A 105:20517–20522. CrossRef Medline Tort AB, Komorowski RW, Manns JR, Kopell NJ, Eichenbaum H (2009) Theta-gamma coupling increases during the learning of item-context associations. Proc Natl Acad Sci U S A 106:20942–20947. CrossRef Medline Tremblay L, Schultz W (1999) Relative reward preference in primate orbitofrontal cortex. Nature 398:704 –708. CrossRef Medline van der Meij R, Kahana M, Maris E (2012) Phase-amplitude coupling in human electrocorticography is spatially distributed and phase diverse. J Neurosci 32:111–123. CrossRef Medline van Duuren E, Lankelma J, Pennartz CM (2008) Population coding of reward magnitude in the orbitofrontal cortex of the rat. J Neurosci 28: 8590 – 8603. CrossRef Medline van Wingerden M, Vinck M, Lankelma J, Pennartz CM (2010a) Theta-band phase locking of orbitofrontal neurons during reward expectancy. J Neurosci 30:7078 –7087. CrossRef Medline van Wingerden M, Vinck M, Lankelma JV, Pennartz CM (2010b) Learningassociated gamma-band phase-locking of action-outcome selective neurons in orbitofrontal cortex. J Neurosci 30:10025–10038. CrossRef Medline van Wingerden M, Vinck M, Tijms V, Ferreira IR, Jonker AJ, Pennartz CM (2012) NMDA receptors control cue-outcome selectivity and plasticity of orbitofrontal firing patterns during associative stimulus–reward learning. Neuron 76:813– 825. CrossRef Medline Vinck M, Oostenveld R, van Wingerden M, Battaglia F, Pennartz CM (2011) An improved index of phase-synchronization for electrophysiological data in the presence of volume-conduction, noise and sample-size bias. Neuroimage 55:1548 –1565. CrossRef Medline Voytek B, Canolty RT, Shestyuk A, Crone NE, Parvizi J, Knight RT (2010) Shifts in gamma phase-amplitude coupling frequency from theta to alpha over posterior cortex during visual tasks. Front Hum Neurosci 4:191. CrossRef Medline Wallis JD, Kennerley SW (2011) Contrasting reward signals in the orbitofrontal cortex and anterior cingulate cortex. Ann N Y Acad Sci 1239:33– 42. CrossRef Medline Wallis JD, Miller EK (2003) Neuronal activity in primate dorsolateral and orbital prefrontal cortex during performance of a reward preference task. Eur J Neurosci 18:2069 –2081. CrossRef Medline Womelsdorf T, Schoffelen JM, Oostenveld R, Singer W, Desimone R, Engel AK, Fries P (2007) Modulation of neuronal interactions through neuronal synchronization. Science 316:1609 –1612. CrossRef Medline Womelsdorf T, Vinck M, Leung LS, Everling S (2010) Selective thetasynchronization of choice-relevant information subserves goal-directed behavior. Front Hum Neurosci 4:210. CrossRef Medline