818
OPTICS LETTERS / Vol. 33, No. 8 / April 15, 2008
Phase contrast Talbot array illuminators Cheng-Shan Guo,1,* Ling Li,1 Lin-Wei Zhu,1 Gong-Xiang Wei,1 Jianping Ding,2 and Hui-Tian Wang2 1
Physics Department, Shandong Normal University, Jinan, Shandong, 250014, China 2 Department of Physics, Nanjing University, Nanjing 210093, China *Corresponding author:
[email protected]
Received January 18, 2008; revised March 5, 2008; accepted March 7, 2008; posted March 12, 2008 (Doc. ID 91889); published April 11, 2008 We propose a method for designing an improved phase-only Talbot array illuminator, called a phase contrast Talbot array illuminator (PCTAI), which could be used to generate an array of spots with a special intensity structure and high efficiency. As examples, we designed two types of PCTAIs for generating an array of line and hollow spots, respectively. Some experimental results revealing the phase contrast effect and demonstrating the feasibility of the PCTAIs are also given. © 2008 Optical Society of America OCIS codes: 050.1970, 070.6760, 230.1360.
A Talbot array illuminator (TAI) [1] is a phase-only diffractive element that transforms a plane wave into an array of bright spots. Recently, it has been demonstrated that TAIs can be applied in constructing large-scale optical traps on a chip for optical sorting [2,3]. Using a TAI, a large-scale optical lattice can be created with high efficiency and a high compression ratio. However, the spots generated by the existing TAIs usually have a uniform intensity distribution, and their geometric shape is also limited by the symmetrical structure of the output array. In this Letter, we propose a simple method for generating an array of spots with an inhomogeneous intensity distribution by use of an improved phase-only TAI. The design of this improved TAI is based on an interesting “phase contrast” effect in the diffraction of a TAI, which we observed in the experiments. Using this method we designed two types of improved TAIs, called phase contrast Talbot array illuminators (PCTAIs), to generate an array of lines and rectangular hollow spots, respectively. According to the reciprocal vector theory of the fractional Talbot effect [4,5], a two-dimensional (2D) periodic optical array can be expressed as
ជ 兲, U共rជ 兲 = u0共rជ 兲 ⴱ lattice共rជ ,R n
共1兲
where ⴱ denotes the convolution integral, u0共rជ 兲 is the complex amplitude of one unit cell of the array, and ជ 兲 defines a special array of 2D periodic lattice 共rជ , R n delta functions, corresponding to the lattice points of ជ = n aជ the optical array with the lattice vector of R n 1 1 + n2aជ 2. Here n1 and n2 are the lattice index (zero or integers) and aជ 1 and aជ 2 are the basis vectors of the lattice. These types of optical arrays can be generated by a TAI with the following complex amplitude transmittance [5]:
ជ /兲兴, U = u0共rជ 兲 ⴱ 关c共rជ 兲lattice共rជ ,R n
共2兲
where  is an integer, known as the fraction parameter, and c共rជ 兲 can be expressed as c共rជ 兲 = A共n1,n2, 兲exp兵j共n1,n2, 兲其.
共3兲
The values of the amplitude A (n1, n2, ) and the phase (n1, n2, ) depend on the lattice symmetry of 0146-9592/08/080818-3/$15.00
the array. For example, when the required optical array is a square array with the basis vectors of 兩aជ 1兩 = 兩aជ 2兩 = a, the amplitude and phase at the position of the lattice point 共n1 , n2兲 can be expressed as A共n1,n2, 兲
=
冦
1, for odd  1, for even ,
even /2,
1, for even ,
odd /2,
0, for even ,
others
and
共n1,n2, 兲 =
冉 冊
1
2 
n1 and n2 n1 and n2
− ␣ 共n12 + n22兲,
冧
,
共4兲
共5兲
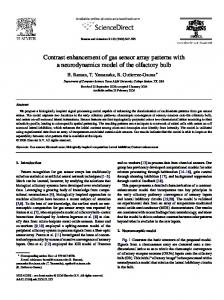
respectively, where ␣ is a constant depending on the parity of the fraction parameter  [5]. It is obvious that, only when the amplitude of the unit cell u0共rជ 兲 is a constant and the geometric shape of the spot satisfies the condition of connecting the neighboring spots together, the transmittance of Eq. (2) could keep a phase-only distribution, which is required in designing a phase-only TAI with high efficiency. It means that the unit cell u0共rជ 兲 for the square array described herein must be a square spot with a side length of 2a /  (for even ) and a constant amplitude distribution. Figure 1 gives an example of such a TAI and its reconstructed intensity distribution at the fractional Talbot distance. The size of the basis vector is taken as 64 pixels, the fraction parameter  is taken as 8, and the side length of the unit spot is taken as 16 pixels, respectively. Figure 1(a) is the phase distribution of the TAI (only part of the TAI is shown). The reconstruction of the TAI is realized in the experiment by displaying the TAI onto a phase-only spatial light modulator (PO-SLM) with the pixel size of ⬃18.1 m. The wavelength of the illumination beam is 632.8 nm. The reconstructed optical array can be obtained at the fractional Talbot distance of 530 mm. Figure 1(b) shows the reconstructed spots array (only © 2008 Optical Society of America
April 15, 2008 / Vol. 33, No. 8 / OPTICS LETTERS
Fig. 1. Example of (a) conventional TAI for a square array designed according to Eq. (2) with a fractional parameter of  = 8 and (b) its reconstructed intensity distribution at the fractional Talbot distance.
four neighboring unit spots are shown). We can see that the TAI with the phase-only distribution shown in Fig. 1(a) successfully transforms an input plane beam into a square array of bright spots with a compression ratio of 2 / 4 = 16. In some applications, such as optical trapping and sorting, however, we often need the output spots to possess other shapes and intensity contours. For example, if we want to trap some absorbing particles in an array, the intensity contour of each spot should be taken as a hollow spot. Directly setting the amplitude of the unit spot in its central part to be zero in designing the TAI is not permitted because of the phase-only limit described herein. In our experiments for observing the diffraction properties of a TAI at a defocused distance away from the fractional Talbot plane, we find that a spot with a required intensity distribution could be obtained by defocusing a phase-only spot with a special phase distribution. In general, if the unit cell function of a TAI for a square array described herein is taken as a phaseonly function as u共rជ 兲 =
再
exp兵j共rជ 兲其, 兩x兩 艋 2a/, 0,
兩y兩 艋 2a/
others
冎
819
Figure 2(a) shows an example of a phase configuration of the unit cell for generating an optical array of line spots. In this configuration, the phase distribution is binary and the phase step is equal to rad. Figure 2(b) shows the phase distribution of a PCTAI for a square array that we designed according to Eq. (2) and the phase-only distribution of the unit cell shown in Fig. 2(a). In this example, the designed parameters are the same as the example of the conventional TAI shown in Fig. 1. The width of the rectangular area with a rad additional phase in the unit cell is 6 pixels. Figure 2(c) shows the reconstructed spot array (only four neighboring unit spots are shown) of the PCTAI shown in Fig. 2(b) when it is displayed on the PO-SLM described herein and illuminated by a plane wave. The output plane is at a distance of ⬃540 mm apart from the PCTAI; that is, the defocused distance ⌬z is equal to ⬃10 mm. We can see that each unit spot of the output array reconstructed by the PCTAI is transformed into three bright lines separated from each other. If we change the width of the central rectangular area of the unit cell, other intensity patterns could also be obtained. For example, if the width of the rectangular area is reduced to 2 pixels, each output spot of the PCTAI is split into two bright lines as shown in Fig. 2(d). It is also noticed in Figs. 2(c) and 2(d) that, although the output plane is not at the fractional Talbot plane, no evident diffraction blur of the spots occurs because the defocused distance is much smaller than the fractional Talbot distance. Figure 3 gives another example of generating an
, 共6兲
and the output plane deviates a small distance of ⌬z from the fractional Talbot plane, the intensity distribution of the reconstructed spots can be approximately expressed as
ជ 兲, I共rជ 兲 = I0兩Fr⌬z兵u0共rជ 兲其兩2 ⴱ lattice共rជ ,R n
共7兲
where Fr⌬z { } denotes the diffraction integral through a diffraction distance of ⌬z in free space and I0 is a constant depending on the input intensity and the fraction parameter. Obviously, this situation is similar to the phase contrast imaging under a defocus condition [6]. Therefore a spot with a required intensity distribution could be obtained by choosing a suitable phase distribution and a defocused distance ⌬z. To demonstrate the feasibility of this approach, we simulate the defocused intensity distributions of a small spot with different phase distributions and defocused distances. We find some interesting configurations, which can be used to design the PCTAIs for generating arrays of spots with different nonuniform intensity distribution.
Fig. 2. (a) Phase configuration of the unit cell for generating an array of line spots, (b) corresponding PCTAI of a square array when the width of the central rectangle is equal to 6 pixels, (c) reconstructed line spot array (only four neighboring unit spots are shown) of the PCTAI shown in (b), and (d) reconstructed spot array when the width of the central rectangle of the unit cell is changed into 2 pixels.
820
OPTICS LETTERS / Vol. 33, No. 8 / April 15, 2008
Fig. 4. Curve of the central peak intensity of the reconstructed spots shown in Fig. 3(d) versus the defocused distance.
Fig. 3. (a) Phase configuration of the unit cell for generating an array of rectanglar hollow spots. (b) PCTAIs designed according to the phase configuration of the unit cell shown in (a); the side length of the smaller square is equal to 10 pixels. (c) Array of spots reconstructed by the PCTAI shown in (b) and (d) reconstructed array of spots when the side length of the smaller square is reduced to 6 pixels.
array of hollow spots. The phase distribution of the unit cell is shown in Fig. 3(a), in which an additional phase of rad is added to a smaller square area located at the center of the unit cell. The side length of the smaller square is determined by the size of the required hollow annular. Figure 3(b) is an example of the designed PCTAI when the side length is taken as 10 pixels. Figure 3(c) shows the reconstructed optical array of this PCTAI when the output plane is located at a distance of 537 mm; that is, the defocused distance is ⬃7 mm. It is obvious that a hollow spot array with a high intensity contrast is obtained. Figure 3(d) shows the output array reconstructed by a PCTAI when the side length of the smaller square is reduced to 6 pixels. We can see that the scale of the reconstructed hollow spots is also decreased. At the same time, a very small spot with the peak intensity appears at the center of each hollow spot. The value of the peak intensity depends on the defocused distance. Figure 4 shows the curve of the peak intensity versus the defocused distance by computer simulations. We can see that the peak intensity after a suitable defocus could be largely enhanced. In the experimental results shown in Figs. 2 and 3 we can see some undesired weak spot noise near the bright spots. For example, a weak line spot noise emerges in the center of Fig. 2(c), which should not exist in theory. This weak spot noise is mainly brought by the phase deviation of the PO-SLM adopted in our experiments; that is, when a PCTAI is
displayed on the PO-SLM, the corresponding phase distribution of the PO-SLM will deviate more or less from the designed phase of the PCTAIs because of the response error of the PO-SLM. Therefore, this noise could be eliminated or suppressed by adopting a POSLM with high quality. In conclusion, it is feasible to generate an array of spots with an adjustable shape and intensity contour by use of the PCTAIs described herein. In comparison with conventional TAIs, the PCTAIs overcome the limit of the array structure and symmetry to the shape of the unit spot and its intensity contour. The phase configurations of the unit cell described herein are only two typical examples used to generate an array of line and rectangular hollow spots, respectively. It is obvious that other useful spot arrays could be realized by configuring corresponding phase distributions and defocused distances in the design of the PCTAIs. Therefore, the PCTAIs could be useful in some applications, such as optical micromanipulations. This work was supported by the National Natural Science Foundation of China under grant 60678027 and the Natural Science Foundation of Shandong under grant Y2006A20. References 1. A. W. Lohmann and J. A. Thomas, Appl. Opt. 29, 4337 (1990). 2. Y. Y. Sun, X.-C. Yuan, L. S. Ong, J. Bu, S. W. Zhu, and R. Liu, Appl. Phys. Lett. 90, 031107 (2007). 3. Y. Y. Sun, J. Bu, L. S. Ong, and X.-C. Yuan, Appl. Phys. Lett. 91, 051101 (2007). 4. C. S. Guo, X. Yin, L. W. Zhu, and Z. P. Hong, Opt. Lett. 32, 2079 (2007). 5. L. W. Zhu, X. Yin, Z. P. Hong, and C. S. Guo, J. Opt. Soc. Am. A 25, 203 (2008). 6. A. Barty, K. A. Nugent, D. Paganin, and A. Roberts, Opt. Lett. 23, 817 (1998).