Vet. Res. 36 (2005) 1–12 © INRA, EDP Sciences, 2005 DOI: 10.1051/vetres:2004047
1
Original article
Phenotype of hepatic infiltrates and hepatic lymph nodes of lambs primarily and challenge infected with Fasciola hepatica, with and without triclabendazole treatment José PÉREZa*, Joaquín ORTEGAb, Ana BRAVOc, Pablo DÍEZ-BAÑOSd, Patrocinio MORRONDOd, Teodoro MORENOe, Alvaro MARTÍNEZ-MORENOe a Departamento
de Anatomía y Anatomía Patológica Comparadas, Edificio de Sanidad Animal, Campus de Rabanales, Ctra, Madrid-Cádiz, Km 396, 14014 Córdoba, Spain de Sanidad Humana y Animal, Facultad de Ciencias Experimentales y de la Salud Universidad Cardenal Herrera-CEU Valencia, Spain c Unidad Docente de Anatomía Patológica Veterinaria, Departamento de Patología Animal, Facultad de Veterinaria de Lugo, Universidad de Santiago de Compostela, Spain d Cátedra de Parasitología y Enfermedades Parasitarias, Departamento de Patología Animal, Facultad de Veterinaria de Lugo, Universidad de Santiago de Compostela, Spain e Cátedra de Parasitología, Departamento de Sanidad Animal, Facultad de Veterinaria de Córdoba, Spain b Departamento
(Received 29 January 2004; accepted 9 June 2004)
Abstract – The phenotype of the hepatic inflammatory infiltrate and hepatic lymph nodes (HLN) was analysed in lambs primarily and challenge infected with Fasciola hepatica. Group 1 was primarily and challenge infected with two doses of 200 metacercariae (mc) each and was nontreated. Trickle infection was administered to five groups: group 2 was challenge infected and nontreated; group 3 was primarily infected and non-treated; group 4 was primarily infected and treated with triclabendazole (TCBZ) at 12 weeks postinfection (wpi); group 5 was treated at 4 wpi and challenge infected and group 6 was treated at 12 wpi and challenge infected. An uninfected group was used as the control. The distribution of T cell subpopulations (CD3, CD4 and CD8), and B cells (CD79α, IgM, IgG) was analysed. The hepatic inflammatory infiltrate was represented mainly by CD3 and CD4 T cells, and B cells (CD79α, IgG). These infiltrates were more severe (P < 0.05) in primarily (group 3) or challenge (groups 2, 5 and 6) trickle infected lambs than in the group single challenge infected (group 1). Cellular changes in HLN consisted in an increase of CD4 over CD8 T cells and an increase of B cells and IgG+ plasma cells, and they were more severe in primarily and challenge trickle infected groups than in the group infected with two larger doses of mc, although significant differences were not found with respect to all challenge trickle infected groups. The strong local cellular and humoral immune responses did not protect against subsequent infections, neither in non-treated lambs (group 2) nor in lambs treated with TCBZ at 4 wpi (group 5) or 12 wpi (group 6). Fasciola hepatica / sheep / immune response / lymphocyte subsets / triclabendazole
* Corresponding author:
[email protected]
2
J. Pérez et al.
1. INTRODUCTION Fasciolosis caused by Fasciola hepatica is an economically important disease of ruminants worldwide. In recent years much attention has been focused on the study of vaccination strategies as an alternative to chemotherapy for the control of the disease due to the high cost of repetitive chemical treatments, drug-resistance and the hazard of chemical residues in food and the environment [8, 9, 29]. Resistance to reinfection and host response to F. hepatica vary greatly between species [12]. Several studies have investigated immune response to F. hepatica in sheep [4, 5, 16]. These studies reported that sheep do not develop resistance to reinfection. However, more recent studies have demonstrated that some immunisation protocols induce a significant protective response against challenge infection in sheep [1, 25] and cattle [19, 20]. Therefore, there are many questions concerning the immunological basis of susceptibility and resistance in sheep that should be elucidated [1, 8, 9, 18]. Local and systemic immune responses have been studied in sheep infected and reinfected with F. hepatica [4, 5, 16]. More recently, the effects of infection and treatment on subsequent challenge have been studied in cattle [13]. Our group studies the
effects of small repetitive infections (trickle infection), which are similar to those that often occur in natural fasciolosis [7], with and without treatment upon subsequent challenges in sheep [24]. The aim of this study was to analyse the distribution of T cell subsets, B cells and IgG bearing plasma cells in hepatic lesions and hepatic lymph nodes of sheep infected with F. hepatica in order to study the immune response in the following: (i) challenge single-dose and trickle infections; (ii) primary trickle infection and (iii) primary and challenge trickle infections in animals treated with triclabendazole (TCBZ).
2. MATERIALS AND METHODS 2.1. Experimental infection Forty three-month old lambs were used for the study (Tab. I). Group 1 was the only group that was primarily and challenge infected with two single doses of 200 metacercariae (mc). Trickled infections were used throughout the experiment. Group 2 was challenge infected 18 weeks postprimary infection (wppi); group 3 was primarily infected; group 4 was primarily infected
Table I. Design of experimental infection and number of fluke recovered from the liver (mean ± SD). Group
Control (n = 4) 1 (n = 7) 2 (n = 7) 3 (n = 7) 4 (n = 4) 5 (n = 7) 6 (n = 4)
Primary infection
TCBZ treatmenta
Challenge infection (wppi)
Euthanasia (wppi)
Number of fluke recovered
Percentage of infective doseb
_
_
_
18, 30, 34, 42
0
–
* † † † † †
_ _ _ 12 wpi 4 wpi 12 wpi
* (18) † (18) _ _ † (22) ‡ (30)
30 30 18 30 34 42
54 ± 16 88.71 ± 27.8 55.29 ± 25.4 0 64.43 ± 11.6 10.75 ± 5.6
13.5 25.3 31.5 0 36.8 8.6
* One single dose of 200 mc; † seven daily doses of 25 mc each; ‡ five daily doses of 25 mc each. a Treatment with triclabendazole (10 mg/kg). b Significant difference (P < 0.05) was found only between groups 5 and 6. wppi: weeks postprimary infection; wpi: weeks postinfection.
Local immune response in ovine fasciolosis
and treated with triclabendazole (TCBZ) at 12 weeks postinfection (wpi); group 5 was primarily infected and treated at 4 wpi and challenge infected 18 weeks after treatment; group 6 was primarily infected, treated at 12 wpi and challenge infected 18 weeks after treatment. An uninfected group was used as a control. All lambs used in the study were free of parasitic and infectious disease as indicated by faecal analysis and the absence of clinical signs. F. hepatica mc of bovine origin obtained in the Department of Animal Pathology of the Faculty of Veterinary Medicine, Lugo (Spain) was administered orally in gelatine capsules. TCBZ treatment in groups 4, 5 and 6 was administered orally in one single dose of 10 mg/kg of body weight. The seven groups of lambs were housed separately. Infected and control lambs were sacrificed by intravenous injection of thiobarbital as follows: groups 1 and 2 at 30 wppi, group 3 at 18 wppi, group 4 at 30 wppi, group 5 at 34 wppi and group 6 at 42 wppi. All reinfected groups (1, 2, 5 and 6) were sacrificed 12 weeks following challenge infection to allow for the complete development of adult parasites. A control lamb was sacrificed synchronously with the other experimental groups (i.e. 18, 30, 34 and 42 wppi). At necropsy, the liver and the gallbladder of all lambs were dissected and flukes were recovered, fixed by standard methods and measured [28]. The experiment was carried out in accordance with the Code of Practice for Housing and Care of Animals used in Scientific Procedures. 2.2. Immunohistochemistry Infected and control lambs were necropsied and tissue samples from the left and right hepatic lobes and hepatic lymph nodes (HLN) were snap frozen in Tissue-Tek® OCTTM (Sakura Finetek Europe B.V., The Netherlands) by immersion in iso-pentane (Merk, Darmstadt, Germany) pre-cooled in liquid nitrogen. Frozen samples were stored at –80 °C until they were cut in 7 µm thick serial tissue sections using a cryostat at
3
Table II. Primary antibodies used and dilution. Antibody
Specificity
Dilution
pAb
Human CD3
1:300
Dako*
GC50A1
Bovine CD4
1:50
VMRD†
CACT80C
Bovine CD8
1:500
VMRD
BAQ155A
Source
Bovine IgM
1:200
VMRD
HM57
Human CD79α
1:50
Dako
pAb
Human λ-IgG
1:2000
Dako
pAb: polyclonal antibody. * Dako, Glostrup, Denmark; † VMRD Pullman Inc. (Pullman, USA).
–20 °C. The sections were stored again at –80 °C until use. The avidin-biotin-peroxidase (ABC) method [22] was used. Details about primary antibodies are summarised in Table II. Tissue sections were defrozen and fixed in acetone for 10 min. Endogenous peroxidase activity was blocked by incubation with 0.05% phenyl-hydrazine (Sigma, St. Louis, MO, USA) in tris buffer saline (TBS), pH 7.2. Tissue sections were incubated with 5% normal goat serum (Vector Laboratories, Burlingame, CA, USA) for 30 min at room temperature. The primary antibodies (Tab. II) were then applied for 18 hours at 4 °C. Monoclonal antibodies (mAb) to CD4, CD8 and B-B4 showed cross-reactivity with these ovine leukocyte antigens [11]. The anti-CD3 polyclonal antibody (pAb) was used as a pan-T cell marker, and was shown to cross-react with ovine T lymphocytes [26]. A rabbit anti-human IgGlambda light chain (pAb), which cross-reacts with sheep IgG [24], was used to label IgG. An anti-human CD79α mAb, which crossreacts with B cells of sheep [21], was used as a pan-B cell marker. A biotinylated goat anti-mouse immunoglobulin serum (Dako) diluted 1:50 for mAb and a biotinylated goat anti-rabbit IgG (Vector) diluted 1:200 for pAb were used as secondary antibodies. An ABC complex (Vector) diluted 1:50 was applied as a third reagent. Tissue sections
4
J. Pérez et al.
Table III. Number of immunolabelled cells (mean ± SD) per area of 0.06 mm2 in hepatic lesions. In parentheses are given those groups that showed significant differences (P < 0.05) with the stated groups. Antibody
Group Control
1
2
3
4
5
6
CD3
3.8 ± 0.3 (*)
32.3 ± 4.1 (2, 3, 5, 6)
66.1 ± 9.3 (1, 4, 6)
60.1±9.4 (1, 4)
34.7 ± 7.3 (2, 3, 5, 6)
69.0 ± 7.6 (1, 4, 6)
49.3 ± 7.9 (1, 2, 4, 5)
CD4
1.8 ± 0.4 (*)
20.1 ± 3.4 (2, 3, 5, 6)
47.7 ± 4.6 (1, 4, 6)
38.7 ± 8.0 (1, 4, 5)
23.9 ± 3.6 (2, 3, 5, 6)
50.3 ± 4.8 (1, 3, 4, 6)
35.0 ± 4.7 (1, 2, 4)
CD8
0.7 ± 0.3 (*)
9.7 ± 2.2 (2, 3, 5)
15.0 ± 2.9 (1, 4)
15.7 ± 3.5 (1, 4)
8.0 ± 1.7 (2, 3, 5)
15.3 ± 2.9 (1, 4)
11.3 ± 3.3 (None)
CD79a
1.9 ± 0.9 (*)
12.2 ± 3.1 (2, 3, 5, 6)
47.4 ± 7.0 (1, 3, 4, 5)
28.7 ± 3.9 (1, 2, 4, 5)
14.3 ± 2.3 49.3 ± 7.5 (1, 2, 3, 5, 6) (1, 3, 4, 6)
23.8 ± 3.1 (1, 2, 4, 5)
IgG
1.3 ± 0.4 (*)
9.5 ± 2.9 (2, 3, 5, 6)
38.7 ± 5.9 (1, 3, 4, 5)
27.3 ± 4.8 (1, 2, 4, 5, 6)
11.0 ± 2.7 (1, 2, 5, 6)
38.6 ± 5.7 18 ± 3.9 (1, 3, 4, 6) (1, 2, 3, 4, 5)
* Significant differences with all infected groups.
were then incubated with 3 3’-diaminobenzidine tetrahydrochloride (Sigma) diluted 0.035% in TBS with 0.1% hydrogen peroxide for 1 min, rinsed in tap water, lightly counterstained with Mayer haematoxylin and mounted with aqueous medium (Shandon, Pittsburgh, PA, USA). Tissue sections in which the specific primary antibodies were substituted with TBS or non-immune isotypic sera were used as negative controls. Lymph nodes of the control animals were used as a positive control for all the primary antibodies. 2.3. Cell counts and statistical analysis Immunoreactive cells were counted in 30 fields of 0.06 mm2 randomly selected in hepatic lesions. The results were expressed as the mean ± standard deviation. The ratio CD4/CD8 was calculated using mean values. B-B4+ cells were not counted in the hepatic lesions, since they were only located in lymph node follicles and their number varied greatly depending on the number of follicles in portal areas. In the HLN, CD3, CD4 and CD8 T lymphocytes were counted in 30 fields of 0.06 mm2 in interfollicular
and paracortical areas, whereas B-B4+, CD79α+ and IgG+ plasma cells were counted in lymph node follicles and medullary cords. The results are expressed as the percentage of immunolabelled and non-labelled cells. 2.4. Statistical analysis Fluke burdens and cell subset counts in the liver and hepatic lymph nodes were compared and the differences were statistically analysed. The Kruskall-Wallis test for non-parametric distributions was used for global comparisons between groups. When significant differences existed, comparisons between the pairs of groups were made using the Mann-Whitney U test for nonparametric distributions. P < 0.05 was considered significant. All analyses were performed in INSTAT 3.0 (GraphPad Software Inc.). 3. RESULTS The number of immunolabelled cells in hepatic lesions and the comparison between pairs of groups are given in Table III. All cell types tested were occasionally found in
Local immune response in ovine fasciolosis
5
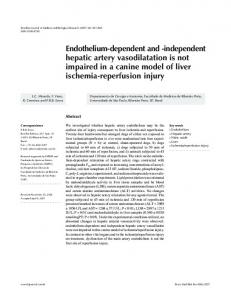
Figure 1. Group 2, liver, CD3. Severe portal inflammatory infiltrate showing numerous CD3+ T lymphocytes. Arrow: bile duct. ABC reagent, Mayer haematoxylin counterstain. ×240.
the portal spaces and in the hepatic sinusoids of uninfected control sheep. The ratio CD4/CD8 was 2.6 in the control group. 3.1. Challenge single-dose and trickle infections (groups 1 and 2) 3.1.1. Liver Group 2 (trickled infected) showed a noticeably higher, although insignificant, number of flukes (Tab. I) and significantly higher numbers of all cell subsets (Tab. III) than group 1 (single-dose infected). CD3+ and CD4+ T lymphocytes (Figs. 1 and 2) were numerous in granulomatous lesions and portal areas, whereas CD8+ T cells were mainly located in fibrotic areas or portal tracts with marked hyperplasia of bile ducts and were less numerous in granulomata (Fig. 3). The ratio CD4/CD8 was 2.1 and 3.2 for groups 1 and 2, respectively. CD79α+ B cells and IgG+ plasma cells (Figs. 4 and 5) were numerous in portal areas and granulomatous lesions, whereas B-B4+ cells (Fig. 6) were located almost exclusively in the lymphoid follicles of portal areas.
3.1.2. Hepatic lymph nodes The HLN showed very severe (group 1) or moderate (group 2) hyperplasia of lymph node follicles and medullary cords. Hyperplasia of paracortical areas was moderate in both groups. Table IV shows the density (in percentages) of the immunolabelled cells marked with the different antibodies used. The density of CD8+ T cells decreased, particularly in group 2, as compared to the control group, whereas the density of CD4+ T lymphocytes showed no significant differences. The density of CD79α+ and IgG+ cells increased in both groups compared to the control group, and in group 2 compared to group 1. 3.2. Primary trickle infection (group 3) 3.2.1. Liver Group 3 showed a lower, but not significant, number of adult parasites in the liver than group 2 (challenge trickle infection). The hepatic inflammatory infiltrate in group 3
6
J. Pérez et al.
Figure 2. Group 2, liver, CD4. Severe portal inflammatory infiltrate with numerous CD4+ T lymphocytes. ABC reagent, Mayer haematoxylin counterstain. ×240.
Figure 3. Group 2, liver, CD8. Inflammatory infiltration of a granulomatous lesion showing a moderate number of CD8+ T cells. ABC reagent, Mayer haematoxylin counterstain. ×240.
was severe and exhibited a similar distribution to that reported in group 2. The ratio CD4/CD8 was 2.5. The number of CD3+, CD4+ and CD8+ T lymphocytes in group 3 showed no statistical differences as compared to group 2 (Tab. III). However, the
number of CD79α+ B cells and IgG+ plasma cells was significantly lower than that found in group 2. On the contrary, group 3 showed a significantly higher number of all inflammatory cell subsets analysed than did group 1 (challenge single infection).
Local immune response in ovine fasciolosis
7
Figure 4. Group 2, liver, CD79α. Inflammatory infiltrate of a granulomatous lesion showing a necrotic area (N) surrounded by a moderate number of CD79α+ cells. ABC reagent, Mayer haematoxylin counterstain. ×300.
Figure 5. Group 2, liver, IgG. Hyperplasia of bile ducts among which numerous IgG+ plasma cells are observed. ABC reagent, Mayer haematoxylin counterstain. ×200.
The number of flukes recovered in the liver was similar in both groups. 3.2.2. Hepatic lymph nodes Severe hyperplasia of the lymphoid follicles and medullary cords of the HLN was
observed. The density of cell subsets showed a significant increase (CD4, CD79α and IgG) or decrease (CD8) when compared to the control group and group 1, whereas no significant changes were found with respect to group 2 (Tab. IV).
8
J. Pérez et al.
Figure 6. Group 2, liver, B-B4. Lymphoid follicle located in a portal area showing numerous B-B4+ cells. Arrow: bile duct. ABC reagent, Mayer haematoxylin counterstain. ×240.
Table IV. Density of immunolabelled cells with the stated antibody in different areas of the hepatic lymph nodes (mean percentage ± standard deviation). In parentheses are given those groups that showed significant differences (P < 0.05) with the stated groups. Antibody
Group Control
1
2
3
4
5
6
CD3*
96.7 ± 2.6
93.3 ± 4.3
90.2 ± 5.2
89.4 ± 4.3
95.8 ± 3.3
92.6 ± 6.7
92.6 ± 4.1
CD4*
60.5 ± 4.6 (3)
62.3 ± 5.1 (3)
69.2 ± 5.7 (4)
70.3 ± 4.1 (C, 1, 4)
59.6 ± 2.9 (2, 3, 5)
68.5 ± 6.6 (4)
65.3 ± 3.5
CD8*
36.8 ± 4.1 (2, 3, 5, 6)
31.0 ± 4.6 (2, 3, 5)
22.0 ± 3.5 20.4 ± 3.7 (C, 1, 4) (C, 1, 4, 6)
32.5 ± 3.7 (2, 3, 5)
23.8 ± 4.7 (C, 1, 4)
26.9 ± 4.0 (C, 3)
80.8 ± 5.7 (C, 4)
70.1 ± 3.5 (3, 5, 6)
87.2 ± 4.3 (C, 1, 4)
85.7 ± 5.8 (C, 1, 4)
83.4 ± 6.2 (C)
75.3 ± 4.7 (2, 5, 6)
84.3 ± 6.4 (C, 4)
87.1 ± 3.6 (C, 1, 4)
CD79a†
65.4 ± 3.2 75.5 ± 4.8 84.6 ± 5.1 (1, 2, 3, 5, 6) (C, 2, 5, 6) (C, 1, 4)
B-B4†
72.3 ± 2.4 (2, 3, 5, 6)
77.3 ± 5.1 (6)
85.7 ± 4.9 (C, 4)
IgG‡
3.5 ± 1.3 11.6 ± 3.3 30.6 ± 5.2 22.4 ± 5.5 8.6 ± 2.7 34.4 ± 5.3 23.8 ± 5.3 (+) (C, 2, 3, 5, 6) (C, 1, 3, 4) (C, 1, 2, 4, 5) (C, 2, 3, 5, 6) (C, 1, 3, 4, 6) (C, 1, 4, 5)
* Paracortical areas; † lymph node follicles and medulla; ‡ medulla; C: control group. (+) Significant differences with all infected groups.
Local immune response in ovine fasciolosis
3.3. Primary and challenge trickle infections in the treated animals (groups 4, 5 and 6)
9
pared to the control group, whereas the density of CD79α and B-B4 cells and IgG bearing plasma cells increased in these two groups (Tab. IV).
3.3.1. Liver All lambs in group 4 showed an absence of parasites and eggs in the hepatic parenchyma and gallbladder, as well as the lowest hepatic inflammatory infiltrate compared with the remaining infected groups. Thus, group 4 showed a significant decrease in the number of all cell subsets analysed with respect to all the infected groups, with the exception of CD8+ T cells, which were lower in number than in group 6. However, this difference was not significant (Tab. III). The lambs in group 5 showed a high number of flukes in the liver (Tab. I) and very severe hepatic inflammatory infiltrate. Thus, the number of all cell subsets was slightly or moderately higher than in groups 2 and 3, respectively, but without significant differences except for CD4+ T cells, which increased significantly as compared to group 3. Finally, the lambs in group 6 showed a low number of parasites in the liver (Tab. I). The numbers of CD3+, CD4+ T cells, CD79α+ B cells and IgG+ plasma cells were significantly reduced with respect to groups 2 and 4, but increased significantly with respect to groups 1 and 4 (Tab. III). CD8+ T lymphocytes did not change significantly with respect to the remaining infected groups. The ratio CD4/CD8 was 3.0 (group 4), 3.3 (group 5) and 3.1 (group 6). 3.3.2. Hepatic lymph nodes Hyperplasia of lymph node follicles and medullary cords was very severe in groups 4 and 5, and moderate in group 6. Hyperplasia of paracortical areas was moderate in all the groups treated (4, 5 and 6). When compared to the control group, group 4 showed no significant differences for all cell subsets, except for IgG. Among T cell subsets, only the density of CD8+ T cells significantly decreased in groups 5 and 6 com-
4. DISCUSSION In a previous study, we found that trickle infections (either primary or challenge) induced more severe hepatic damage than infections with two larger doses in sheep [24]. The present study revealed a higher hepatic inflammatory infiltrate of T cell subsets (CD3+, CD4+ and CD8+), CD79α+ B cells and IgG bearing plasma cells in trickle-infected lambs (group 2) than in the single-dose challenge lambs (group 1). The increase of CD4+ over CD8+ T cells, as well as the increase of B cells and IgG+ plasma cells in the HLN was proportional and also more pronounced in trickle-infected lambs. These results strongly suggest that trickle infections induce a greater local cellular and humoral immune response in sheep. However, this strong local immune response is unable to provide enough protection to prevent subsequent infections, as revealed by the number of hepatic parasites and the severe hepatic lesions found in group 2. Similar results have been reported in sheep which have been challenge infected with one to three doses of F. hepatica mc [5, 16, 29]. In contrast, similar fluke burdens, higher hepatic damage and cell-mediated and humoral responses were found in single-dose-infected calves compared to trickleinfected calves [2, 3], suggesting a different response of sheep and cattle to single and trickle F. hepatica infections. The local cellular immune response in primary and challenge infections was characterised by a higher proportion of CD4+ over CD8+ T cells in the hepatic lesions. The ratio CD4/CD8 was similar in all infected groups (ranging from 2.1 in group 1 to 3.3 in group 5). These results are in striking contrast with those of Meeusen et al. [16], who reported a lower proportion of CD4+
10
J. Pérez et al.
over CD8+ cells in chronic primary infection (ratio 1.6) and a higher ratio (5.0) in chronic challenge infection. Such discrepancies may be due to the different infection protocols used (trickle infection in the sheep of the present study) or to the fact that samples were taken at different stages of the disease. In the Meeusen study, for example, the sheep were killed 10 days after the last infection, whereas in our study the lambs were killed between 14 and 17 weeks after the last infection, when flukes had reached the biliary system. This event would have induced a proliferation of CD8+ T lymphocytes in portal tracts displaying hyperplasia of bile ducts; quite similar to what has been reported in chronic stages of primary infections in sheep [4]. The similar cellular pattern observed in the HLN of primary (group 3) and challenge (groups 2, 5 and 6) trickle-infected sheep suggests that chronic antigenic stimulation might lead to an intense humoral response in both conditions. This strong humoral response has been previously reported in the HLN of sheep [4, 6, 16] and goats [22, 23] chronically infected with F. hepatica, and correlates with the high levels of serum IgG that have also been found in sheep [4, 27] and goats [14, 15]. The results of the primary trickle-infected and treated lambs (group 4) indicate that TCBZ therapy administered at 12 wpi is effective in eliminating parasites and in significantly reducing the hepatic inflammatory infiltrate by 30 wpi, as previously reported [24]. However, in this study the use of TCBZ during the migratory stage of the parasites (group 5) did not induce significant protection against future infections in sheep as indicated by the number of hepatic parasites and the heavy hepatic infiltrate of all cell subsets found in this group. These results contrast with those reported in cattle treated with TCBZ 5 and 6 days after the primary infection, which showed a significant protective response to subsequent challenges [13]. This difference may be due to the fact that treatment was
administered at a different stage of the disease in both studies, or to a different host response in cattle and sheep. Further studies are required to evaluate if early therapy with TCBZ (5 to 7 dpi) induces a protective response in sheep as occurs in cattle. TCBZ treatment during the biliary stage (group 6) induced a reduction of the fluke burden (Tab. I) and hepatic inflammatory infiltrate (Tab. II) compared to the other challenge trickle-infected groups. This could be due to partial resistance or to the lower number of mc administered in the challenge infection of group 6. In conclusion, the present study revealed that both single and challenge trickle infections induced more severe hepatic T cell subsets, B cells and IgG+ plasma cells than challenge single-dose infection in sheep. The local immune response was mainly represented by CD4+ T cells, B cells and IgG+ plasma cells. However, these strong cellular and humoral immune responses did not protect against future challenges. Recently, high levels of protection have been obtained in sheep with purified cathepsin L proteases [8, 10, 17, 25] and recombinant antigen Sm14 [1]. Nonetheless, their specific protective mechanisms are yet to be elucidated. More studies are needed to further understand the differences between natural and induced immune responses and the specificity of effective mechanisms of protection in sheep fasciolosis.
ACKNOWLEDGMENTS This work was supported by grants XUGA26104B-98 from the Galician Government and AGR 137 from the Andalusian Government.
REFERENCES [1] Almeida M.S., Torloni H., Lee-Ho P., Vilar M.M., Thaumaturgo N., Simpson A.J., Tendler M., Vaccination against Fasciola hepatica infection using a Schistosoma mansoni defined
Local immune response in ovine fasciolosis
recombinant antigen, Sm14, Parasite Immunol. 25 (2003) 135–137. [2] Bossaert K., Farnir F., Leclipteux T., Protz M., Lonneux J.F., Losson B., Humoral immune response in calves to single-dose, trickle and challenge infections with Fasciola hepatica, Vet. Parasitol. 87 (2000) 103–123. [3] Bossaert K., Jacquinet E., Saunders J., Farnir F., Losson B., Cell-mediated immune response in calves to single-dose, trickle, and challenge infections with Fasciola hepatica, Vet. Parasitol. 88 (2000) 17–34. [4] Chauvin A., Boulard C., Local immune response to experimental Fasciola hepatica infection in sheep, Parasite 3 (1996) 209–215. [5] Chauvin A., Bouvet G., Boulard C., Humoral and cellular immune responses to Fasciola hepatica experimental primary and secondary infection in sheep, Int. J. Parasitol. 25 (1995) 1227–1241.
11
[12] Haroun E.T., Hillyer G.V., Resistance to fascioliosis: a review, Vet. Parasitol. 20 (1986) 63–93. [13] Hoyle D.V., Dalton J.P., Chase-Topping M., Taylor D.W., Pre-exposure of cattle to drugabbreviated Fasciola hepatica infections: the effect upon subsequent challenge infection and the early immune response, Vet. Parasitol. 111 (2003) 65–82. [14] Martínez-Moreno A., Martínez-Cruz M.S., Martínez F.J., Gutierrez P.N., Hernández S., Detection of antibodies to Fasciola hepatica excretory-secretory antigens in experimentally infected goats by enzyme immunosorbent assay, Vet. Parasitol. 62 (1996) 247–252. [15] Martínez-Moreno A., Martínez-Moreno F.J., Acosta Y., Gutiérrez P.N., Becerra C., Hernández S., Humoral and cellular immune responses to experimental Fasciola hepatica infections in goats, Parasitol. Res. 83 (1997) 680–686.
[6] Chauvin A., Moreau E., Boulard C., Responses of Fasciola hepatica infected sheep to various infection levels, Vet. Res. 32 (2001) 87–92.
[16] Meeusen E., Lee C.S., Rickard M.D., Brandon M.R., Cellular responses during liver fluke infection in sheep and its evasion by the parasite, Parasite Immunol. 17 (1995) 37–45.
[7] Clery D., Torgerson P.R., Mulcahy G., Immune responses of chronically-infected adult cattle to Fasciola hepatica, Vet. Parasitol. 62 (1996) 71–82.
[17] Mulcahy G., Dalton J.P., Cathepsin L proteinases as vaccines against infection with Fasciola hepatica (liver fluke) in ruminants, Res. Vet. Sci. 70 (2001) 83–86.
[8] Dalton J.P., Brindley P.J., Knox D.P., Brady C.P., Hotez P.J., Donnelly S., O'Neill S.M., Mulcahy G., Loukas A., Helminth vaccines: from mining genomic information for vaccine targets to systems used for protein expression, Int. J. Parasitol. 33 (2003) 621–640.
[18] Mulcahy G., Joyce P., Dalton J.P., Immunology of Fasciola hepatica infection, in: Dalton J.P. (Ed.), Fasciolosis, CABI Publishing, Wallingford, 1999, pp. 341–377.
[9] Dalton J.P., Mulcahy G., Parasite vaccines – a reality? Vet. Parasitol. 98 (2001) 149–167. [10] Dalton J.P., Neill S.O., Stack C., Collins P., Walshe A., Sekiya M., Doyle S., Mulcahy G., Hoyle D., Khaznadji E., Moire N., Brennan G., Mousley A., Kreshchenko N., Maule A.G., Donnelly S.M., Fasciola hepatica cathepsin L-like proteases: biology, function, and potential in the development of first generation liver fluke vaccines, Int. J. Parasitol. 33 (2003) 1173–1181. [11] Davis W.C., Marusic S., Lewin H.A., Splitter G.A., Perryman L.E., McGuire T.C., Gorham J.R., The development and analysis of species specific and cross reactive monoclonal antibodies to leukocyte differentiation antigens and antigens of the major histocompatibility complex for use in the study of the immune system in cattle and other species, Vet. Immunol. Immunopathol. 15 (1987) 337–376.
[19] Mulcahy G., O'Connor F., Clery D., Hogan S.F., Dowd A.J., Andrews S.J., Dalton J.P., Immune responses of cattle to experimental anti-Fasciola hepatica vaccines, Res. Vet. Sci. 67 (1999) 27–33. [20] Mulcahy G., O’Connor F., McGonigle S., Dowd A., Clery D.G., Andrews S.J., Dalton J.P., Correlation of specific antibody titre and avidity with protection in cattle immunized against Fasciola hepatica, Vaccine 16 (1998) 932–939. [21] Pearson G.R., Day M.J., Pawade M.J., B-cell (CD79a+) lymphoma affecting the tarsal joint synovia in a sheep, J. Comp. Pathol. 120 (1999) 295–299. [22] Pérez J., Martín de las Mulas J., Carrasco L., Gutierrez P.N., Martínez-Cruz M.S., MartínezMoreno A., Pathological and immunohistological study of the liver and hepatic lymph nodes in goats primarily and secondarily infected with Fasciola hepatica, J. Comp. Pathol. 120 (1999) 199–210.
12
J. Pérez et al.
[23] Pérez J., Martín de las Mulas J., De Lara F.C., Gutierrez-Palomino P.N., Becerra-Martel C., Martínez-Moreno A., Immunohistochemical study of the local immune response to Fasciola hepatica in primarily and secondarily infected goats, Vet. Immunol. Immunopathol. 64 (1998) 337–348. [24] Pérez J., Ortega J., Moreno T., Morrondo P., López-Sández C., Martínez-Moreno A., Pathological and immunohistochemical study of the liver and hepatic lymph nodes of sheep chronically reinfected with Fasciola hepatica, with or without triclabendazole treatment, J. Comp. Pathol. 127 (2002) 30–36. [25] Piacenza L., Acosta D., Basmadijian L., Dalton J.P., Carmona C., Vaccination with cathepsin L proteinases and with leucine aminopeptidase induces high levels of protection against fasciolosis in sheep, Infect. Immun. 67 (1999) 1954–1961.
[26] Ramos-Vara J.A., Miller M.A., López E., Prats N., Brevik L., Reactivity of polyclonal human CD3 antiserum in lymphoid tissues of cattle, sheep, goats, rats and mice, Am. J. Vet. Res. 55 (1994) 63–66. [27] Sanchez Andrade R., Paz Silva A., Suarez J.L., Panadero R., Pedreira J., Diez Banos P., Morrondo P., Effect of fasciolicides on the antigenaemia in sheep naturally infected with Fasciola hepatica, Parasitol. Res. 87 (2001) 609–614. [28] Schmidt G.D., Handbook of tapeworm identification, CRC Press, Boca Raton, Florida, 1986, p. 7. [29] Spithill T.W., Smooker P.M., Sexton J.L., Bozas E., Morrison C.A., Creaney J., Parsons J.C., Development of vaccines against Fasciola hepatica, in: Dalton J.P. (Ed.), Fasciolosis, CABI Publishing, Wallingford, 1999, pp. 377– 402.
To access this journal online: www.edpsciences.org