ICPhS XVII
Plenary Lecture
Hong Kong, 17-21 August 2011
PHONOLOGICAL COMPLEXITY IN LINGUISTIC PATTERNING Ian Maddieson University of New Mexico, USA; University of California, Berkeley, USA
[email protected]
things the importance of the effects of relative frequency of exposure to particular forms — such models help to explain why similar words may have quite distinct individual histories [3, 31]. At the same time there is plentiful evidence that linguistic behavior also displays categorical organization and relies on abstraction from the variation found in repetitions of the same or similar utterances [4, 6, 12, 29]. Without this, the concept of a homonym would not arise, such features as rhyme, alliteration, and metrical regularity would not be used in verbal art [14, 26, 33], and alphabetic writing systems would be unlikely to have the success they do. The categorical perspective has been the basis for much traditional phonetic and phonological analysis, such as the design of the International Phonetic Alphabet, the analysis of individual languages into phonemes, syllables and other phonological structures, and the establishment of reference pronunciations of lexical forms. This categorical model allows comparisons to be made between languages in terms of their complexity of phonological organization which are not really possible on the basis of exemplar models. Given a categorical perspective, it makes sense to compile an inventory of the vowels, consonants and tones of a given language, and to make statements about stress patterns, canonical syllable structures, and structural patterns at the level of words or longer constructs. These data can then be assessed across a sample of languages and general patterns sought out. Influential earlier comparative surveys of cross-linguistic phonological patterns were made by Trubetskoy [35] and Hockett [15] and by participants in the Stanford Language Universals project [11]. The UPSID sample was first described in 1984 [20] and expanded in the 1990‟s [25]. Since then, work has proceeded on further expansion of this database, including not only more languages but also a wider range of information about each language, especially on syllable structure, and tone and stress systems. A publically-accessible version is under development and is due for at least partial release soon [19].
ABSTRACT Exemplar models have challenged categorical interpretations of phonological organization, but there is good evidence that both exemplar and categorical perspectives are valid. Cross-language comparisons are more readily conducted using categorical data, but including frequency data provides some linkage between the perspectives. This paper briefly summarizes work examining how various basic categorical properties of phonological systems relate to each other in a large sample of languages. This shows that to a great degree complexity in various sub-systems cooccurs, rather than languages „compensating‟ for complexity in one area with simplicity in another. How compensation might nonetheless be detected by adding in consideration of relative frequency is noted and an exploratory examination of relative frequency of different word-lengths is reported. This is based on exploiting the availability in many languages of a common text — the fable of “The North Wind and the Sun” long used for illustrations of different languages by the International Phonetic Association. The final section considers some explanations for the global distribution of phonological complexity that might deserve further exploration, including environmental and demographic factors. Keywords: complexity, frequency, word length, acoustic adaption hypothesis, demography 1. INTRODUCTION Several decades of accumulating evidence show that people store and retrieve detailed phonetic information about particular utterances which encodes context of usage, individual speaker traits, and other properties of specific linguistic experiences [8, 10, 36]. Speakers and listeners are envisaged as creating and accessing a „cloud‟ of exemplars of any given utterance so that, for example, it can even be said that time and thyme are not homophones since their exemplar clouds are distinct [9]. The exemplar models developed in response to this data emphasize among other 28
ICPhS XVII
Plenary Lecture
This expanded database has been used in a number of previous studies and formed the basis of several chapters on phonological topics in the World Atlas of Language Structures [5]. Supplemental data, for example on segment frequency and word length, and links to recorded speech samples are being added as time and availability allow. Examination of the individual components of phonological systems, such as the structure of sets of vowels, provides interesting insights into overall language structure, but the most interesting results come from examining the interactions of the different components. Many linguists expect languages to „compensate‟ for increased complexity on one or more of the variables examined with reduced complexity on others. In the analyses conducted of the relationships between sizes of inventories of consonants and vowels, and the elaboration of tone inventories, stress patterns, and syllable structure a compensatory pattern is, for the most part, not what is found. Rather, elaboration on several of these parameters tends to co-occur. As a result, languages vary considerably in the overall complexity of their basic phonological patterns, rather than being similar to each other in this respect. A brief summary of these results is presented here, before discussing exploratory investigations of possible compensatory effects in relative frequency of word-length. A final section considers some of the potential explanations offered for the distribution of phonological complexity.
Hong Kong, 17-21 August 2011
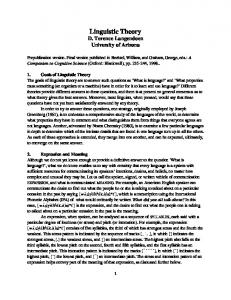
complexity of codas for each language. Languages such as English or Dutch receive the maximum score of 8, whereas a language such as Yoruba with a maximum syllable of CV receives a score of 1. The Tone Index in Figure 3 ranges from 1 for languages with no tone to 4 for those with a complex tone system of four or more contrasts. Figure 1: Consonant (CTot) and total vowel (VTot) inventories.
Figure 2: Mean consonant inventory by syllable index.
2. COMPLEXITY The brief results presented in this section are each based on analysis of a sample of between about 450 and 650 languages, depending on the completeness of the data available for each individual language on the given issue (cf [22]). Consonant inventory size is unrelated to the number of basic vowel qualities, but is positively correlated with total vowel inventory (Figure 1) — although this correlation does not account for a large proportion of the variance. Basic vowel inventory abstracts away from properties such as vowel length, nasalization and voice quality differences. Mean size of consonant inventory is positively correlated with both elaboration of the syllable canon (Figure 2) and of the tone system (Figure 3). The Syllable Index in Figure 2 is the sum of values ranging from 0-3 for the complexity of onsets, 1-2 for the complexity of nuclei, and 0-3 for the
Figure 3: Mean consonant inventory by tone index.
29
ICPhS XVII
Plenary Lecture
Hong Kong, 17-21 August 2011
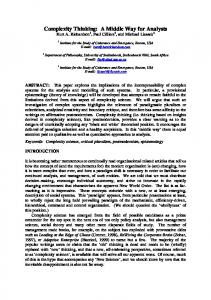
Figure 6: Onset + coda complexity by stress role (means — shown above bars — are joined by the line).
Although no overall linear trend is found, languages with the simplest syllable structures have the smallest total vowel inventories and those with the most complex syllables have the largest (Figure 4). Elaboration of the tone inventory correlates with increase in basic vowel inventory (Figure 5). A similar effect is found with total vowel inventory, except that there is no difference between steps 2 and 3 (no figure shown).
2.32
1.97
1.85
Figure 4: Mean total vowel inventory by syllable index.
Other pairwise comparisons between the primary phonological elements considered here generally show no relationship between them, although vowel inventories are higher in languages with no stress contrast, and more elaborated syllable structures inversely correlate with tone system complexity [23, 24]. Apart from these exceptions, the pattern of compensation anticipated by many is — for the most part — absent. Greater complexity in one aspect of the phonological system more often goes hand in hand with greater complexity in others. Figure 5: Mean vowel quality inventory by tone index.
3. CONSIDERING FREQUENCY These results could nonetheless be misleading in a number of possible ways. They do not take account of the inherent complexity of individual elements or their relative frequency. For example, it might be the case that more complex elements are very rare in the languages in which they occur, and so contribute little to the complexity of the language in everyday usage [24]. Or larger segment inventories and richer syllabic templates might systematically allow for average morpheme or word length to be shorter, which is arguably a lower level of complexity. These thoughts invite the investigation of a larger variety of ways of expressing phonological complexity, for example, through counts of segment frequencies and of the frequency distribution of word lengths. Considering frequency when evaluating complexity provides some linkage between exemplar and categorical perspectives on phonological structure. Frequencies can be counted in text or in wordlists. In making cross-language comparisons there are difficulties to be faced in either case. Counts based on wordlists can be strongly influenced by the choice made of the form selected
Use of stress for lexical contrast also correlates with elaboration of the consonantal elements of syllable structure (the sum of onset and coda indices) as shown in Figure 6. Languages with predictable or rarely contrastive stress are considered to have a minor role for this parameter. Contrastive stress placement is considered to be more complex than predictable stress, which is taken to be less complex than the absence of stress.
30
ICPhS XVII
Plenary Lecture
for lexical entries. Counts based on texts can avoid this problem but can be strongly affected by the nature of the topic and style. Well-matched texts must be sought if any confidence is to be placed in the results. One short but relatively uniform text that is available for a well-diversified sample of languages is the fable of The North Wind and the Sun which has long been used by the International Phonetic Association for its „Illustrations‟. Over 150 versions of this text have been collected, culled from the IPA Handbook [18], the Journal of the IPA and its predecessors, the Principles of the IPA [17] and other sources. The relationship between phonological inventories, syllable structure and word-length has been investigated using a selection of the available versions of this fable, The sample is not as wellbalanced as would be desirable. Using the 6 arealgenetic grouping defined in [21] only one language from Oceania („Papuan‟ and Australian languages) is available, but a fair variety of African, North American, Central and South American, and East and South-East Asian languages occur as well as languages from smaller families in the Europe and West and South Asian area (e.g. Hungarian, Basque, Georgian). Length of words in syllables was calculated for a subsample of the available languages (selected in such a way as to diminish the over-representation of European languages). Two parameters were calculated for each language, the mean word-length and the percentage of monosyllables (since monosyllabic words seem to have a special status, being absent from content word classes in a good number of languages). Note that certain languages of East Asia, such as Mandarin and Cantonese, that are often said to be „monosyllabic‟ are interpreted as having many bisyllabic and longer words, as represented in the Illustrations of these two languages in the Principles. Mean word-length is not significantly related to consonant inventory size, but is strongly related to the size of the vowel inventory, measured both in terms of basic vowels and total vowels. The fit in a model using both basic and total vowel inventory is shown in figure 7 for a sample of 75 languages, split between areas as shown in Table 1. The two measures of vowel inventory are of course, somewhat correlated as total vowels includes the basic vowel set, and in many languages the two are in fact equal. However, in a stepwise multiple regression total vowel inventory makes a significant independent contribution to predicting mean vowel
Hong Kong, 17-21 August 2011
length over and above the basic vowel inventory, which by itself has a R2 of .27. This improves to .32 when total vowel inventory is added to the model. Table 1: Language sample for text analysis.
Europe, W&S Asia East & SE Asia Africa N America S America Oceania
29 20 20 6 5 1
Mean word length is also related to the Syllable Index (cf Figure 2) when variables are considered in isolation, but this factor makes no significant independent contribution when the variables are jointly considered. Figure 7: Predicted versus actual mean word length.
Figure 8: Predicted monosyllables.
versus
actual
percent
The percentage of monosyllables is also related primarily to the size of the basic vowel inventory but in this case the Syllable Index does make a
31
ICPhS XVII
Plenary Lecture
significant additional contribution. The fit in a model including these two factors is shown in Figure 8 for a sample of 79 languages. These analyses indicate that there is some connection between the richness of a language‟s phonological resources and the relative frequency of words of different lengths, with longer words being primarily associated with a smaller inventory of vowels, but also with simpler syllable structures. There is a hint of a compensatory relationship in this result, but it is not an across-the-board phenomenon: A smaller inventory of consonants does not predict longer words.
Hong Kong, 17-21 August 2011
of the language‟s point location (a central location for the speaker population; a capital city for major world languages) minus 45. A language whose point location is given as 45˚N or 45˚S latitude has a value of 0 on this measure, one at the equator (or at the poles!) has a value of 45. There is a highly significant correlation between this phonological index and the distance from the central latitude of the world's temperate zones (p < .0001, R2 = .21), with decreasing values correlating with increasing distance from the temperate zone — which means primarily toward the tropics as language density and land area are much greater than toward the poles. Results are shown in Figure 9.
4. SOME SUGGESTED EXPLANATIONS The general observation that phonological complexity (at the very basic levels examined here) shows a cumulative distribution rather than being approximately equal among languages can be considered in the light of a number of theories that link language development to historical, environmental and social factors, instead of looking at linguistic properties in isolation. Two particular suggestions will be examined here. Several anthropological studies, e.g. [7, 28] propose that language design can insightfully be considered in relation to the acoustic adaptation hypothesis [27, 30]. This hypothesis suggests that animal vocal communication systems (avian and mammalian) are adapted to the climatic/ecological environment in which they operate, optimizing for the transmission characteristics of the environment. Temperate environments with open vegetation facilitate transmission of higher frequency signals better than warmer more densely vegetated environments. Hence, languages in the first setting will tend to be more consonant-heavy (more consonant contrasts, more consonant-heavy syllables), whereas those in the second are likely to be more vocalic and to have simpler syllable structures (and perhaps longer words). This proposition has been previously tested using wordlists from a relatively small sample of languages, selected from the Human Relations Area Files [16]. The somewhat crude but broader test offered here uses the large sample employed in the studies presented in section 2 above. It examines the correlation of the sum of consonant inventory size and Syllable Index (both normalized to give them equal weight) against a rough measure of a language's closeness to the temperate zone. This measure is the absolute value of latitude
Figure 9: Sum of normalized consonant inventory and syllable complexity values against distance from temperate zone.
Others see a relationship between phonological complexity and size of community [13], proposing that phonological complexity is reduced in languages spoken in smaller communities. Recently, Atkinson [1] suggested that such an effect may even be reflected in a pattern of decreasing phonological complexity in proportion to distance from the African origin of the dispersal of modern humans. Since, it is argued, communities on the frontier of advancement would always be small, a correlation between population size and phonological complexity leads to serial effects continually tending to reduce complexity the longer the migration path. This is argued to parallel diminished human genetic diversity with distance from Africa, e.g. [32]. This intriguing idea raises the question of why no signal of such an overall effect has been found in more conventional historical linguistic studies, which look for specific sound/meaning correspondences. 32
ICPhS XVII
Plenary Lecture
The general observation that phonological complexity declines with distance from a posited best-fit origin in Africa, measured through plausible transit points, such as the Red Sea, the Bosphorus and the Bering Straits, seems correct. This is shown by the linear fit illustrated in Figure 10. This figure plots the sum of normalized values of the three basic variables that contribute to the effect proposed by Atkinson against the distances that he provides for a sample of 424 languages. This analysis uses the raw values of consonant and basic vowel inventory, rather than the binned values reported in [5] which Atkinson relied on. Figure 10 also shows that there are local peaks and troughs at various distances from the posited origin, which are tracked by the cubic spline shown in the figure. This leaves open the possibility that an apparent overall correlation with distance could be an artifact due to the interaction of various other effects, such as the suggested impact of ecological setting discussed above. The discussion initiated by Atkinson is certainly worth continuing.
Hong Kong, 17-21 August 2011
5. SUMMARY Intellectual currents in the phonetic sciences in recent years have rightly emphasized the importance of detail and variation rather than constancy in linguistic signals. This new emphasis complements but does not supplant the understanding that the phonetic form of languages also shows a categorical organization. Linguistic traits at the categorical level can be more readily compared to look for general crosslinguistic patterns. Analyses of a large language sample indicate that phonological complexity at a categorical level shows a tendency to be a cumulative trait, with several factors increasing in tandem. A test was conducted of the hypothesis that increased segmental and syllabic complexity predicts shorter words, which provided only weak support for the idea that such a trade-off could be where languages „balance‟ their phonological complexity. As alternatives to purely linguistic explanations two other proposals were examined using the large language sample. These suggest on the one hand that ecological setting may play a role in shaping the phonetic form of individual languages, and on the other that effects of speaker population size have left a trace of the original spread of modern humans from Africa in the contemporary distribution of patterns of phonological complexity. Both these ideas seek to link the broadly cumulative distribution of phonological complexity to influences that are not purely language-internal, and open perspectives for understanding why such cross-linguistic variation in complexity exists. Finally, it may be worth stating that is not necessary to assert that all languages are equally complex to continue to value each language equally.
Figure 10: Sum of normalized consonant inventory, basic vowel inventory and tone values against Atkinson‟s best-origin distance (in km). Linear (grey) and cubic spline (black) fits.
6. REFERENCES
A problem that remains, however, is whether a reliable independent signal of a correlation of population size with phonological traits can be obtained from contemporary data, given the effects of disease, war, displacement and assimilation which have decimated so many indigenous language groups, especially in Australia [2] and the Americas [34].
[1] Atkinson, Q.D. 2011. Phonemic diversity supports a serial founder effect model of language expansion from Africa. Science 332, 346-349. [2] Butlin, N. 1983. Our Original Aggression: Aboriginal Populations of Southeastern Australia. Sydney: Allen and Unwin, 1788-1850. [3] Bybee, J. 2001. Phonology and Language Use. Cambridge: Cambridge University Press. [4] Cutler, A., Eisner, F., McQueen, J.M., Norris, D. 2010. How abstract phonemic categories are necessary for coping with speaker-related variation. In Fougeron, C., Kühnert, B., D‟Imperio, M., Vallée, N. (eds.),
33
ICPhS XVII
[5]
[6] [7]
[8]
[9]
[10]
[11]
[12]
[13] [14] [15]
[16] [17] [18]
[19]
[20] [21]
[22]
[23]
[24]
Plenary Lecture
Laboratory Phonology. Berlin: De Gruyter Mouton, 10, 91-111. Dryer, M.S., Haspelmath, M. (eds.). 2009. World Atlas of Language Structures (electronic edition). Leipzig: Max Planck Institute of Evolutionary Anthropology. http://wals.info/ Ernestus, M. In press. Acoustic reduction and the roles of abstractions and exemplars in speech processing. Lingua. Fought, J.G., Munroe, R.L., Fought, C.R., Good, E.M. 2004. Sonority and climate in a world sample of languages. Cross-Cultural Research 38, 27-51. Foulkes, P. 2010. Exploring social-indexical variation: a long past but a short history. Laboratory Phonology 1, 539. Gahl, S. 2008. Time and Thyme are not homophones: The effect of lemma frequency on word durations in spontaneous speech. Language 84, 474-496. Goldinger, S.D. 1998. Echoes of echoes? An episodic theory of lexical access. Psychological Review 105, 251279. Greenberg, J.H., Ferguson, C.A., Moravcsik, E.A. (eds.). 1978. Universals of Human Language, Volume 2, Phonology. Stanford, CA: Stanford University Press. Hawkins, S. 2010. Phonetic variation as communicative system: Perception of the particular and the abstract. In Fougeron, C., et al. (eds.), Laboratory Phonology 10. Berlin: De Gruyter Mouton, 479-510. Hay, J., Bauer, L. 2007. Short report: Phoneme inventory size and population size. Language 83, 388-400. Hayes, B. 1979. The rhythmic structure of Persian verse. Edebiyat 4, 193-242. Hockett, C. 1955. A manual of phonology. Indiana University Publications in Anthropology and Linguistics 11 (Supplement to the International Journal of American Linguistics). Human Relations Area Files. New Haven: Yale University. http://www.yale.edu./hraf International Phonetic Association. 1949. Principles of the IPA. London: International Phonetic Association. International Phonetic Association. 1999. IPA The Handbook of the IPA. Cambridge: Cambridge University Press. LAPSyD (Lyon-Albuquerque Phonological Systems Database). http://www.lapsyd.ddl.ish-lyon.cnrs.fr/lapsyd/index.php Maddieson, I. 1984 [2009]. Patterns of Sounds. Cambridge: Cambridge University Press. Maddieson, I. 2006b. Correlating phonological complexity: data and validation. Linguistic Typology 10, 108-125. Maddieson, I. 2007. Issues of phonological complexity: Statistical analysis of the relationship between syllable structures, segment inventories and tone contrasts. In Solé, M-J., Beddor, P., Ohala, M. (eds.), Experimental Approaches to Phonology. Oxford and New York: Oxford University Press, 93-103. Maddieson, I. 2009. Calculating phonological complexity. In Pellegrino, F., Marsico, E., Chitoran, I., Coupé, C. (eds.), Approaches to Phonological Complexity. Berlin: Mouton de Gruyter, 83-110. Maddieson, I. 2010. Correlating syllable complexity with other measures of phonological complexity. Phonological Studies. Tokyo: Phonological Society of Japan, Kaitakusha, 13, 105-116.
Hong Kong, 17-21 August 2011
[25] Maddieson, I., Precoda, K. 1990. Updating UPSID. UCLA Working Papers in Phonetics 74, 104-114. [26] Maddieson, I., Smith, C. 2009. Alliteration: Discrete segments not gradient similarity. Actes des 6èmes Journées d’Études Linguistiques. Nantes: Université de Nantes, 75-80. [27] Morton, E.S. 1975. Ecological sources of selection on avian sounds. American Naturalist 109, 17-34. [28] Munroe, R.L., Fought J.G., Macaulay R.K.S. 2009. Warm climates and sonority classes: Not simply more vowels and fewer consonants. Cross-Cultural Research 43, 123-133. [29] Pallier, C., Colomé, A., Sebastián-Gallés, N. 2001. The influence of native-language phonology on lexical access: Exemplar-based versus abstract lexical entries. Psychological Science 5, 42-46. [30] Peters, G., Peters, M.K. 2010. Long-distance call evolution in the Felidae: effects of body weight, habitat, and phylogeny. Biological Journal of the Linnean Society 101(2), 487-500. [31] Pierrehumbert, J. 2001. Exemplar dynamics: word frequency, lenition and contrast. In Bybee, J., Hopper, P. (eds.), Frequency and the emergence of linguistic structure. Amsterdam: John Benjamins, 137-157. [32] Ramachandran, S., Deshpande, O., Roseman, C.C., Rosenberg, N.A., Feldman, M.W., Cavalli-Sforza, L.L. 2005. Support from the relationship of genetic and geographic distance in human populations for a serial founder effect originating in Africa. Proceedings of the National Academy of Sciences, U.S.A. 102, 15942-15947. [33] Schuh, R. 1989. Toward a metrical analysis of Hausa verse prosody: Mutadaarik. In Haïk, I., Tuller, L. (eds.), Current Approaches to African Linguistics. Dordrecht: Foris, 6, 161-175. [34] Stannard, D. 1992. American Holocaust: Columbus and the Conquest of the New World. New York: Oxford University Press. [35] Trubetskoy, N. 1939. Grundzüge der Phonologie. Travaux du Cercle Linguistique de Prague 7. [36] Walker, A., Hay, J. 2011. Congruence between „word age‟ and „voice age‟ facilitates lexical access. Laboratory Phonology 2, 219-237.
34