Catalysis Today 161 (2011) 15–22
Contents lists available at ScienceDirect
Catalysis Today journal homepage: www.elsevier.com/locate/cattod
Photocatalytic evaluation of TiO2 /nylon systems prepared at different impregnation times M.I. Mejía a,∗ , J.M. Marín a , G. Restrepo a , C. Pulgarín b , J. Kiwi b a b
Applied Physicochemical Processes Group, Chemical Engineering Department, Antioquia University, Engineering College, Street 67 53-108, AA 1226 Medellín, Colombia EPFL-SB-ISIC-GGEC, Station 6, Ecole Polytechnique Fédérale de Lausanne, 1015 Lausanne, Switzerland
a r t i c l e
i n f o
Article history: Available online 20 October 2010 Keywords: Impregnation time Photocatalysis TiO2 /nylon Methanol photodegradation
a b s t r a c t TiO2 /nylon fabrics were investigated for methanol degradation under UV light irradiation. TiO2 Degussa P-25 was supported on nylon by immersing the nylon in sol–gel TiO2 and silicone. The TiO2 layers on the nylon were explored as a function of the time of immersion, impregnation agent and the type of nylon fabric used. The energy diffuse spectroscopy (EDS) and infrared spectroscopy (ATR-FTIR) confirmed the presence of TiO2 bonded to the nylon fabrics. Optical microscopy (OM) and scanning electron microscopy (SEM) show a more uniform distribution of TiO2 on nylon fabrics prepared by immersion in sol–gel as compared to the silicone method. The most suitable photodegradation of gaseous methanol by TiO2 /nylon samples was obtained by sol–gel samples prepared by 24 h immersion time. © 2010 Elsevier B.V. All rights reserved.
1. Introduction
2. Experimental
Methanol is a VOC’s type gaseous emission from numerous industries. It is widely used as industrial solvent, raw material in the manufacture of formaldehyde, as antifreeze in vehicles, fuel for camping-gas canisters, and in the preparation of dyes, resins and adhesives [1]. At 20 ◦ C it is harmful in the air leading to irritation of eyes, skin and respiratory problems within a short exposure. Higher doses lead to unconsciousness and death [2,3]. Heterogeneous photocatalysis is a promising technology for the removal of VOC’s, by the use of supported TiO2 to abate pollutants in the gas phase [4]. Photoactive systems TiO2 /textile fibers are promising supports for TiO2 due to their low cost, high surface area, flexibility and relative stability [1]. Studies of TiO2 coated fabrics for pollutant degradation [5–7], self-cleaning [5,8,9] and bacterial inactivation have been recently reported, and show a potential for large scale application [5,10,11]. Two immersion–diffusion methods for the catalyst preparation by dip coating were evaluated at different impregnation times [12,13] focusing on the immersion time of the nylon in the TiO2 suspensions. The first method used silica sol–gel as the TiO2 binder and the second method used silicone as the binding agent. The photocatalytic degradation was investigated as a function of the type of binder, the immersion time and the type of nylon used.
2.1. Materials
∗ Corresponding author. Tel.: +57 4 2196543; fax: +57 4 2196543. E-mail addresses:
[email protected],
[email protected] (M.I. Mejía). 0920-5861/$ – see front matter © 2010 Elsevier B.V. All rights reserved. doi:10.1016/j.cattod.2010.09.005
Two types of 100% nylon fabrics were used: the first type, nylon NT is a commercially ready for use in the form of a cohesive yarn containing lubricants, bleaching agents and stabilizers [1,12]. The second type, nylon NC, is a fabric that has not the finishing process [12]. Both types of nylon were provided by local textile industries.
2.2. Nylon textiles prepared using TiO2 –SiO2 sol–gel The sol–gel of SiO2 to impregnate the nylon was prepared using 15 mL of tetraethyl orto-silicate (TEOS), 2.4 mL of distilled water, 25 mL of isopropyl alcohol (ISO) and 0.1 mL of HCl 3 M. All chemicals were reagent grade (p.a.). The hydrolysis of TEOS leads to the substitution of OR groups linked to silicon by silanol Si–OH groups (Fig. 1a and b). These groups react to form Si–O–Si (siloxane), leading to a three-dimensional network (Fig. 1c). The isopropyl alcohol and ethanol formed during the process remained within the pores of the network (Fig. 1d) [12,13]. After ageing for 24 h, the silica structure was formed. Then, TiO2 Degussa P-25 (3.6 g) was added and was trapped within the pores of silica matrix (Fig. 1d). The TiO2 enters the SiO2 matrix and remains catalytically active as observed during the degradation of methanol. Subsequently the nylon sample of 9 cm2 of area was immersed into this TiO2 –SiO2 suspension and left for 11 or 24 h for the
16
M.I. Mejía et al. / Catalysis Today 161 (2011) 15–22
Fig. 1. Mechanism of silica matrix formation by sol–gel method and addition of TiO2 Degussa P-25 (in the figure, a bi-dimensional view is displayed). a and b) Substitution of OR groups linked to silicon by silanol Si–OH groups, c) Si–OH groups react to form Si–O–Si (siloxane) bonds, and d) isopropyl alcohol (ISOP) and ethanol (ET) formed during the process remained within the pores, additionally TiO2 Degussa P-25 is trapped within the pores after its addition.
suspension to diffuse into nylon. Coated samples were washed and dried at 100 ◦ C for 1 h as noted in the scheme shown in Fig. 2. The silica added on the nylon served as a binder for TiO2 and protected the nylon from the H+ attack during light irradiation.
silicone. The poly-silicone has been widely reported as a binding agent [1]. Nylon samples impregnated with silicone presented a yellow color unlike the sol–gel coated with SiO2 fabrics that were observed to be white. The coloration of the fabrics is due to the oxidation of silicone leading to colored functional groups [14,15].
2.3. Nylon samples prepared with TiO2 using silicone 2.4. Characterization of samples In the second method, the silicone dispersion was prepared by diluting 0.84 g of silicone in 50.4 mL of dichloromethane under magnetic stirring. Then, 3.5 g of TiO2 was added to the dispersion. Nylon fabrics were immersed in the dispersion for 11 or 24 h. Then, the coated samples were dried in oven at 100 ◦ C for 1 h and washed thoroughly. Fig. 3 shows the schematic of the coating process using
Fig. 2. Schematic of the sol–gel coating.
Scanning electron microscopy (SEM) analysis of the coated fabrics was carried out in scanning electron microscope (JEOL JSM 5910LV) provided with a BS-SE-detector. An X-ray detector type EDS (energy dispersive spectrometer) was used for the surface chemical composition analysis. Optical microscopy images of the impregnated TiO2 surface were made using a NICO E200 microscope in a transmittance mode.
Fig. 3. Schematic of the coating process using silicone.
M.I. Mejía et al. / Catalysis Today 161 (2011) 15–22
17
Fig. 4. Photodegradation unit of methanol.
The infrared spectroscopy was performed with an IR-Prestige21/8400S Fourier Infrared Transform Spectrometer provided with an attenuated total reflectance (ATR-FTIR) attachment. The spectrum was taken in the range of 4000–500 cm−1 . 2.5. Photocatalytic evaluation of the fabrics The photocatalysis was carried out by passing a methanol gas flow over TiO2 coated nylon fabrics in a reactor provided with three
UV lamps (365 nm, 4 W, Phillips). Plug flow tubular reactor made of Pyrex glass was used (9 cm length, effective volume 50 mL) and TiO2 coated fabrics were positioned inside on the reactor wall. The UV lamps were positioned around the reactor and aligned in a concentric axial geometry at 120◦ of each other. An average power of 4.6 W/m2 and a temperature of 33 ◦ C were measured in the reactor unit during the irradiation of the samples. The schematic diagram of the photodegradation unit is shown in Fig. 4. The airflow was split into two streams; the first flow
Fig. 5. SEM images of coated nylons with immersion time of 24 h by a and b) silicone and c and d) sol–gel.
18
M.I. Mejía et al. / Catalysis Today 161 (2011) 15–22
Fig. 6. SEM images of coated nylons with immersion time of 11 h by a and b) silicone and c and d) sol–gel.
(carrier flow) allowed dragging the methanol into the photoreactor. The contaminant was kept at −13 ◦ C in a cooling bath to control the spontaneous evaporation. The second airflow (the dilution flow) allowed diluting the methanol to reach the concentration range required for the experiments. 0.5 SCCM of carrier gas flow along 70 SCCM of the dilution gas flow were employed. This flow was introduced into photoreactor and the methanol degradation was measured by gas chromatography. The gas temperature in gas inlet was 24 ◦ C and methanol concentration was 103 ppmv. Methanol degradation was determined by gas chromatography in an Agilent-6890N chromatograph, using TCD detector (thermal conductivity detector) at 105 ◦ C, EC-WAX column of 30 m × 0.25 m × 250 m at 55 ◦ C and splitless mode injector at 80 ◦ C. The chromatographic readings were taken every 8 min. The photocatalytic decomposition percentage of methanol (%Mphot ) was calculated by %Mphot =
C0 − C × 100 C0
where C0 is the initial concentration of methanol, and C is the residual photoreactor concentration of methanol after 140 min of photocatalysis. The initial concentration of methanol (C0 concentration) was measured when the nylon was saturated. In this way, the methanol absorption effect on nylon during the photocatalytic degradation measurements was avoided and the decrease in the methanol concentration was only due to photocatalysis.
Absorption equilibrium was determinated by gas chromatography when the peak area of the methanol peak in the chromatographic spectra became stable. 3. Results and discussion 3.1. Scanning electron microscopy (SEM) Fig. 5 shows the microscopy of fabrics NC and NT coated by two methods at 24 h. Samples prepared with silicone (Fig. 5a and b) present a rough non-homogeneous layer of TiO2 and some cracks are visible. In the case of NC fabric, some delamination was observed. Fabrics impregnated by sol–gel at 24 h (Fig. 5c and d), show a thinner TiO2 uniform surface layer than samples coated by silicone. Samples coated for 11 h of immersion are shown in Fig. 6. TiO2 film on fabrics impregnated by silicone (Fig. 6a and b) presents a similar structure and morphologic characteristic than those coated for 24 h. Fabrics impregnated by sol–gel at 11 h show a more uniform coating compared to samples obtained by sol–gel during 24 h (Fig. 6c and d). 3.2. Optical microscopy (OM) Optical microscopy images of fabrics prepared by sol–gel and by silicone at immersion times of 24 and 11 h are shown in Figs. 7 and 8, respectively. A superficial film of TiO2 was observed in the samples made with silicone; this film was not observed in fabrics coated by sol–gel where the coatings were thinner compared to the fabrics coated by silicone.
M.I. Mejía et al. / Catalysis Today 161 (2011) 15–22
19
Fig. 7. Optical microscopic images with 5× of coated nylons with immersion time of 24 h by a and b) silicone and c and d) sol–gel.
Furthermore, TiO2 films coated by silicone at 24 h of immersion (Fig. 7a and b) were less homogeneous and had higher crack density compared with NC and NT coated by sol–gel method at 24 h immersion time (Fig. 7c and d). A similar trend was observed in fabrics with 11 h of immersion (Fig. 8).
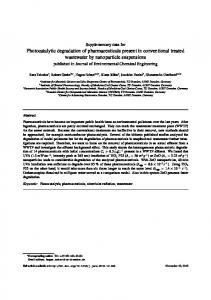
Chemical analysis (EDS) showed TiO2 presence in the coated samples (Fig. 9a and b) compared with non-impregnated nylon (Fig. 9c). These results indicate the TiO2 presence on the nylon fabric. The presence of C and O in the EDS spectra is due to the nylon. The signal due to Si (from tetraethyl orto-silicate TEOS) was also observed in fabrics coated by sol–gel.
symmetric and asymmetric stretching were found at 2930 and 2854 cm−1 , associated at ∼720 cm−1 with the vibration of 4 or more –CH2 groups in the polymer chain. The band at 1634 cm−1 is associated with the C O stretching and the 1535 cm−1 band is due to a combination of the bending N–H band and the stretching of the C–N [17–19]. ATR-FTIR spectrum of TiO2 /nylon samples prepared with silicone (Fig. 10b) shows the TiO2 band between 800 and 500 cm−1 and the characteristic bands of nylon. Silicone bands of the methyl silicone were also observed in Fig. 10b. The 1728 cm−1 band corresponds to C O stretching of the ester-radicals of the silicone. The CH3 asymmetric and symmetric stretching of Si(CH3 –Si) were observed at 1365 and 1226 cm−1 , respectively, as well as the silicone bands at 1118 and 1018 cm−1 due to Si–O–Si stretching vibrations [20–22].
3.4. Infrared spectroscopy of TiO2 /nylon samples (ATR-FTIR)
3.5. Photocatalytic methanol degradation
Fig. 10a shows the ATR-FTIR spectrum of TiO2 /nylon samples prepared by sol–gel method at 11 h of immersion. The ATR-FTIR spectra shows TiO2 band in the range of 800–500 cm−1 . The band at 940 cm−1 was assigned to the stretching vibration of Si–OH or Si–O groups. Furthermore, symmetric and asymmetric stretching bands of Si–O–Si were found at 1180 and 1050 cm−1 , respectively [16]. The presence of the later bands confirms that SiO2 was formed during TEOS hydrolysis. Characteristic bands of the nylon fibers were observed at 3300 cm−1 with an overtone at 3080 cm−1 due to the stretching of hydrogen bonded to the N–H and the N–H bending. The CH2
The concentration ratio C/C0 vs. time of irradiation was plotted for the photocatalytic decomposition of methanol (%Mphot ) and it is shown in Fig. 11. Methanol concentration gradually decreased up to 120 min when the methanol concentration reaches a plateau. A similar trend was found for other TiO2 catalysts on nylon mediating methanol photodegradation. Gas chromatography measurement showed that methanol degradation was not observed during photolysis. Table 1 shows the %Mphot for fabrics impregnated by two immersion–diffusion methods. TiO2 coated nylon obtained by sol–gel immersion reached higher percentages of degradation than
3.3. Energy dispersive spectroscopy (EDS)
20
M.I. Mejía et al. / Catalysis Today 161 (2011) 15–22
Fig. 8. Optical microscopic images with 5× of nylon coated by immersion time of 11 h: a and b) silicone and c and d) sol–gel.
that obtained by silicone. This result is consistent with SEM and OM analysis where coatings obtained by silicone present a higher density of cracks than the samples prepared by sol–gel immersion.
Additionally, six different methanol degradation cycles were carried out with a TiO2 /nylon sample coated by sol–gel. A good reproducibility during the methanol degradation cycles was found indicating the stability of the photocatalyst used.
Fig. 9. EDS spectra of coated nylons with immersion time of 24 h by a) sol–gel, b) silicone and c) non-impregnated nylon.
M.I. Mejía et al. / Catalysis Today 161 (2011) 15–22
21
Fig. 10. ATR-FTIR spectra of TiO2 /nylon samples prepared by a) sol–gel and b) silicone after 11 h of immersion. Table 1 Methanol degradation percentage related with immersion time and type of nylon. Type of nylon impregnation method
%Mphot 11 h
%Mphot 24 h
NT (sol–gel) NC (sol–gel) NT (silicone) NC (silicone)
15.93% 13.07% 10.04% 10.68%
20.33% 25.40% 8.56% 15.45%
4. Conclusions
Fig. 11. Photocatalytic degradation of methanol vs. time using TiO2 /nylon prepared by sol–gel with immersion time of 11 h.
• Results indicate that TiO2 /nylon supported photocatalysts prepared by immersion were useful on methanol photodegradation. A dependence was observed between the time of immersion and the TiO2 film structure on the nylon.
22
M.I. Mejía et al. / Catalysis Today 161 (2011) 15–22
• TiO2 /nylon showed photocatalytic activity leading to the elimination of gaseous methanol. A higher degradation was reached with samples prepared by sol–gel at 24 h. TiO2 /nylon coated using silicone leads to less effective methanol degradation. • Sol–gel coatings were more uniform than the TiO2 coatings applying silicone. The later ones showed more cracks and some TiO2 was lost due to the gas flow in the photocatalytic reactor during methanol degradation. Acknowledgements
[6] [7] [8] [9] [10] [11] [12] [13] [14] [15]
The authors thank COLCIENCIAS and the University of Antioquia through the “Estrategia de Sostenibilidad de Grupos” program for financing the project. References [1] M.I. Mejía, J.M. Marín, G. Restrepo, L.A. Rios, C. Pulgarín, J. Kiwi, Appl. Catal. B 94 (2010) 166–172. [2] R.J. Nelson, C.L. Flakker, D.S. Muggli, Appl. Catal. B 69 (2007) 189–195. [3] R. Kavet, K.M. Nauss, Crit. Rev. Toxicol. 21 (1) (1990) 21–50. [4] E.A. Kozlova, A.V. Vorontsov, Appl. Catal. B 77 (2007) 35–45. [5] M.I. Mejía, J.M. Marín, G. Restrepo, C. Pulgarín, E. Mielczarski, J. Mielczarski, Y. Arroyo, J.-C. Lavanchy, J. Kiwi, Appl. Catal. B 91 (2009) 481–488.
[16] [17] [18] [19] [20] [21] [22]
Y. Dong, Z. Bai, R. Liu, T. Zhu, Catal. Today 126 (2007) 320–327. H. Wang, Z. Wu, W. Zhao, B. Guan, Chemosphere 66 (2007) 185–190. T. Yuranova, D. Laub, J. Kiwi, Catal. Today 122 (1–2) (2007) 109–117. W.S. Tung, W.A. Daoud, J. Colloids Interface Sci. 326 (2008) 283–288. W. Kangwansupamonkon, V. Lauruengtana, S. Surassmo, U. Ruktanonchai, Nanomed. Nanotechnol. Biol. Med. 5 (2) (2009) 240–249. K. Qi, J.H. Xin, W.A. Daoud, Int. J. Appl. Ceram. Technol. 4 (6) (2007) 554– 563. M.I. Mejia, J.M. Marín, G. Restrepo, L.A. Ríos, Sci. Techn. 36 (2007) 97–101. H. Schmidt, M. Mennig, Wet Coating Technologies for Glass. (accessed May 2006). M.A. Angulo-Luna, March 2006. http://sisbib.unmsm.edu.pe/bibvirtualdata/ Tesis/Ingenie/angulo lm/angulo lm.pdf. W.G. Penney, The theory of molecular structure. IOPscience, Rep. Prog. Phys. (6) (1939) 212. K.C. Cole, H. Ben Daly, B. Sanschagrin, K.T. Nguyen, A. Ajji, Polymer 40 (1999) 3505–3513. Z. Wu, C. Zhou, R. Qi, H. Zhang, J. Appl. Polym. Sci. 83 (2002) 2403–2410. S.G. Gholap, D.A. Musale, S.S. Kulkarni, S.K. Karodel, U.K. Kharul, J. Membr. Sci. 183 (2001) 89–99. E.M. Enlow, J.L. Kennedy, A.A. Nieuwland, J.E. Hendrix, S.L. Morgan, Appl. Spectrosc. 59 (8) (2005) 986–992. WCASLAB, FTIR, http://www.wcaslab.com/TECH/tbftir.htm (accessed, May 2009). D.A. Skoog, F.J. Holler, T.A. Nieman, Instrumental Anal., 5a ed., Mc Graw Hill, Madrid, 2001. I. Skeist, in: Van Nostrand Reinhol (Ed.), Handbook of Adhesives, vol. (2), 1977, p. 921, New Jersey.